
Cybersecurity threats continue to rise every year, and businesses of all sizes face the real risk of data breaches. The faster an organization detects, contains, investigates, and resolves breaches, the lower the financial and reputational damage. But without clear metrics, teams cannot measure their effectiveness or understand which areas need improvement. The Data Breach Response KPI Dashboard in Google Sheets provides a simple, powerful, and real-time solution for tracking every stage of breach response with accuracy.Data Breach Response KPI Dashboard in Google Sheets
This dashboard transforms Google Sheets into a full cybersecurity command center. It helps teams visualize monthly and yearly performance, compare results with targets and previous-year benchmarks, and understand overall incident readiness. With automated formulas, dynamic charts, KPI cards, and responsive slicers, this template helps security teams monitor trends, detect weaknesses, improve response efforts, and enhance cross-team coordination.Data Breach Response KPI Dashboard in Google Sheets
✨ Key Features of the Data Breach Response KPI Dashboard in Google Sheets
📊 1. Complete KPI Monitoring System
Track 20 essential cybersecurity KPIs covering detection, containment, investigation, escalation, communication, impact, and recovery. Each KPI updates automatically for MTD, YTD, target, and previous-year comparisons.
🟢🔴 2. Up/Down Arrow Indicators
Conditional formatting instantly highlights performance:
-
Green arrow (↑) = Improvement
-
Red arrow (↓) = Decline
This makes decision-making fast and effortless for leadership teams.
📈 3. Dynamic Month-by-Month Trend Charts
Each KPI has a full trend analysis view, helping teams identify patterns, seasonal spikes, and long-term behavior.
📁 4. Structured Entry Sheets (Actual, Target, PY)
Simply enter actual monthly numbers, yearly targets, and previous-year values. The dashboard updates instantly with no manual adjustments needed.
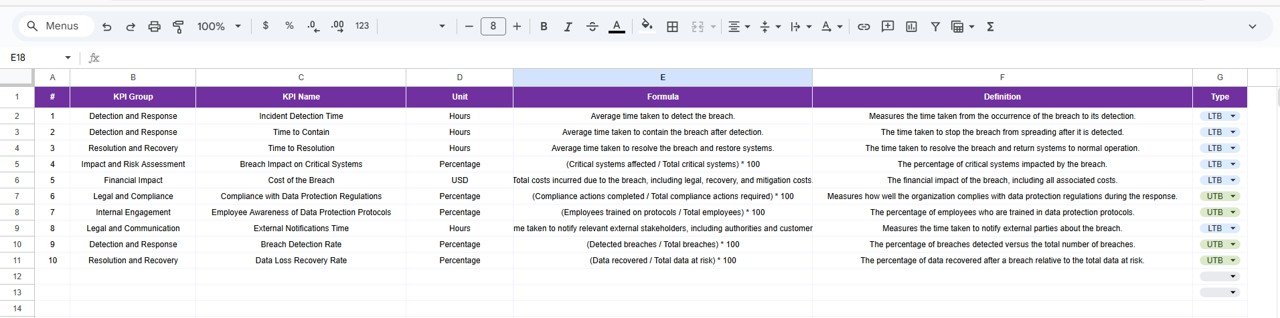
📚 5. KPI Definition Database
Includes detailed descriptions, units, formulas, KPI groups, and KPI types (UTB / LTB). This ensures clarity and standardization for all team members.
📦 What’s Inside the Data Breach Response KPI Dashboard in Google Sheets
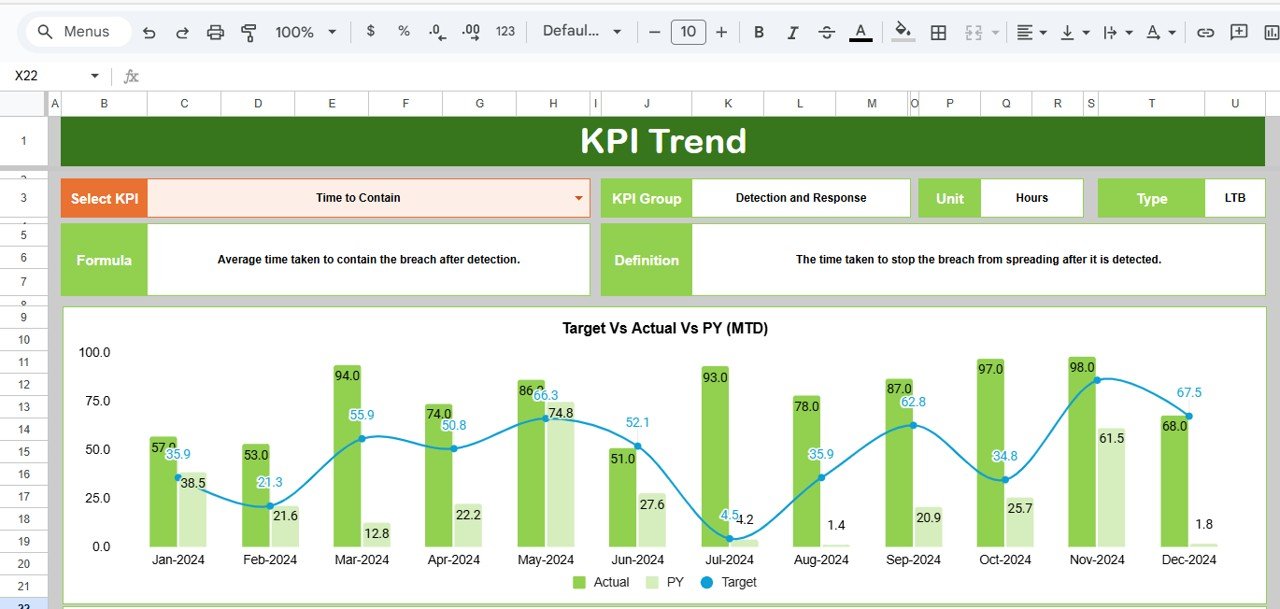
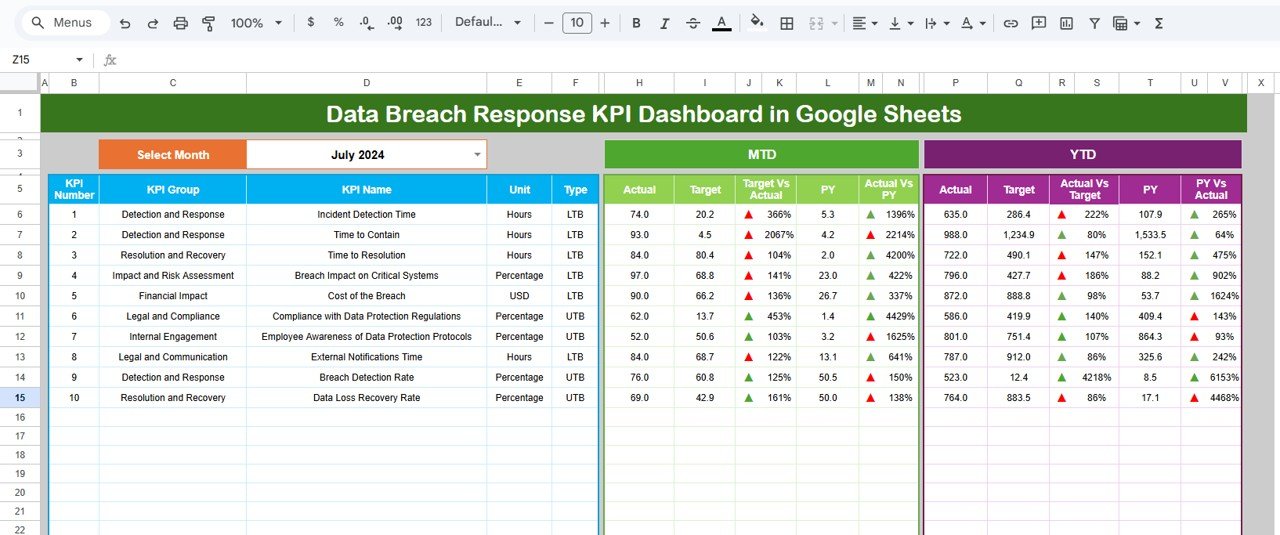
📊 1. Dashboard Sheet (Main Page)
This is the command center of the system. Select the month from cell D3, and the dashboard automatically displays:
-
MTD Actual
-
MTD Target
-
MTD Previous Year
-
MTD Target vs Actual
-
MTD PY vs Actual
-
YTD Actual
-
YTD Target
-
YTD Previous Year
-
YTD Target vs Actual
-
YTD PY vs Actual
With automated KPI cards and visual indicators, teams can instantly see where they stand.
📉 2. KPI Trend Sheet
Choose any KPI from the dropdown and view:
-
KPI group
-
KPI unit
-
KPI definition
-
KPI formula
-
KPI type (Upper/Lower the Better)
-
Annual trend chart
Perfect for root-cause identification and performance evaluation.
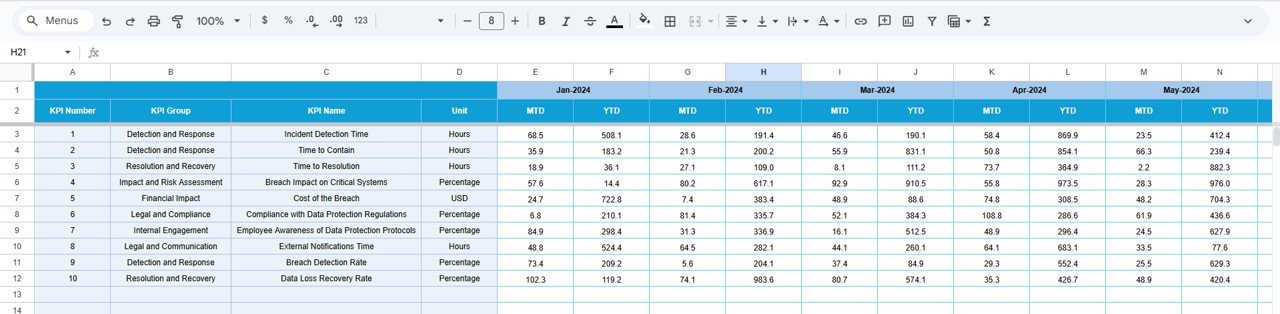
📘 3. Actual Number Sheet
Enter your monthly performance values here. Selecting the year’s starting month aligns all calculations automatically.
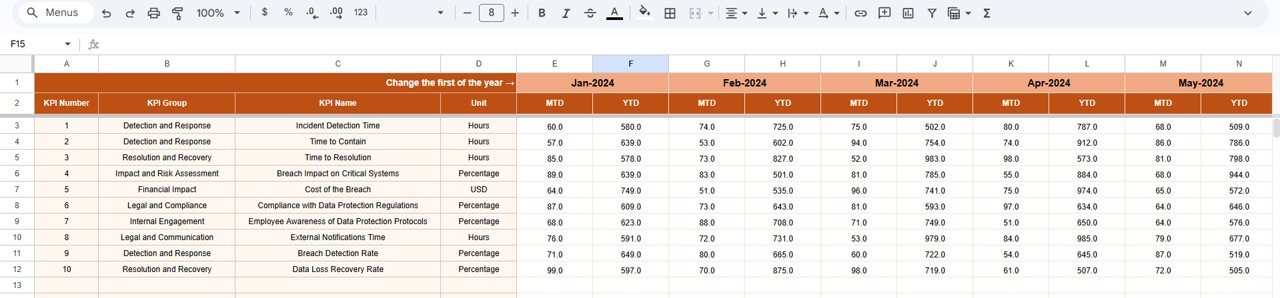
🎯 4. Target Sheet
Store MTD and YTD targets for every KPI. Useful for annual goal planning, audits, and performance reviews.
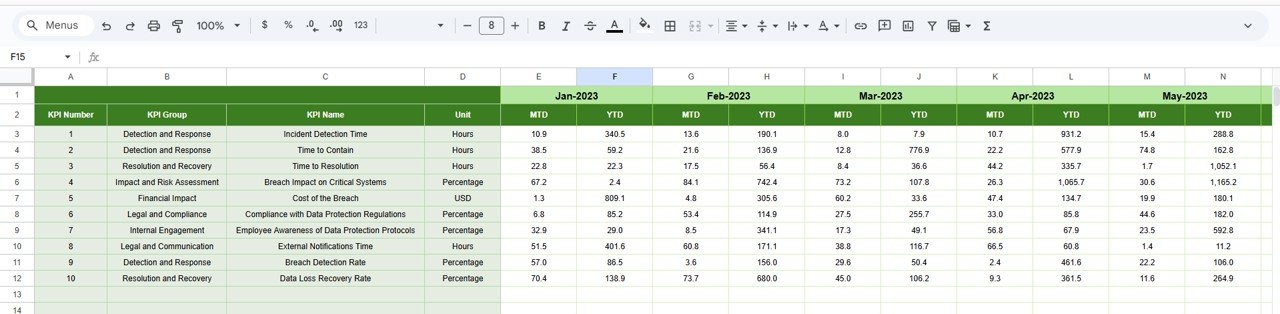
📆 5. Previous Year Number Sheet
Enter previous-year MTD and YTD data to track year-over-year performance improvements.
📑 6. KPI Definition Sheet
A complete dictionary of KPIs—ideal for new employees, internal training, and reporting consistency.
🎯 Who Can Benefit from This Data Breach Response KPI Dashboard in Google Sheets
🛡️ Cybersecurity Teams
Monitor incident response, detection speed, and containment efficiency.
💻 IT Infrastructure Teams
Track escalations, system downtime, and recovery metrics.
⚖️ Compliance & Risk Teams
Ensure breach handling meets regulatory requirements.
🏢 Business Leaders & CXOs
Get real-time visibility into breach readiness and incident trends.
🔍 Security Operations Centers (SOCs)
Identify gaps, improve processes, and reduce breach impact.
Click here to read the Detailed blog post
Watch the step-by-step video tutorial:


Reviews
There are no reviews yet.