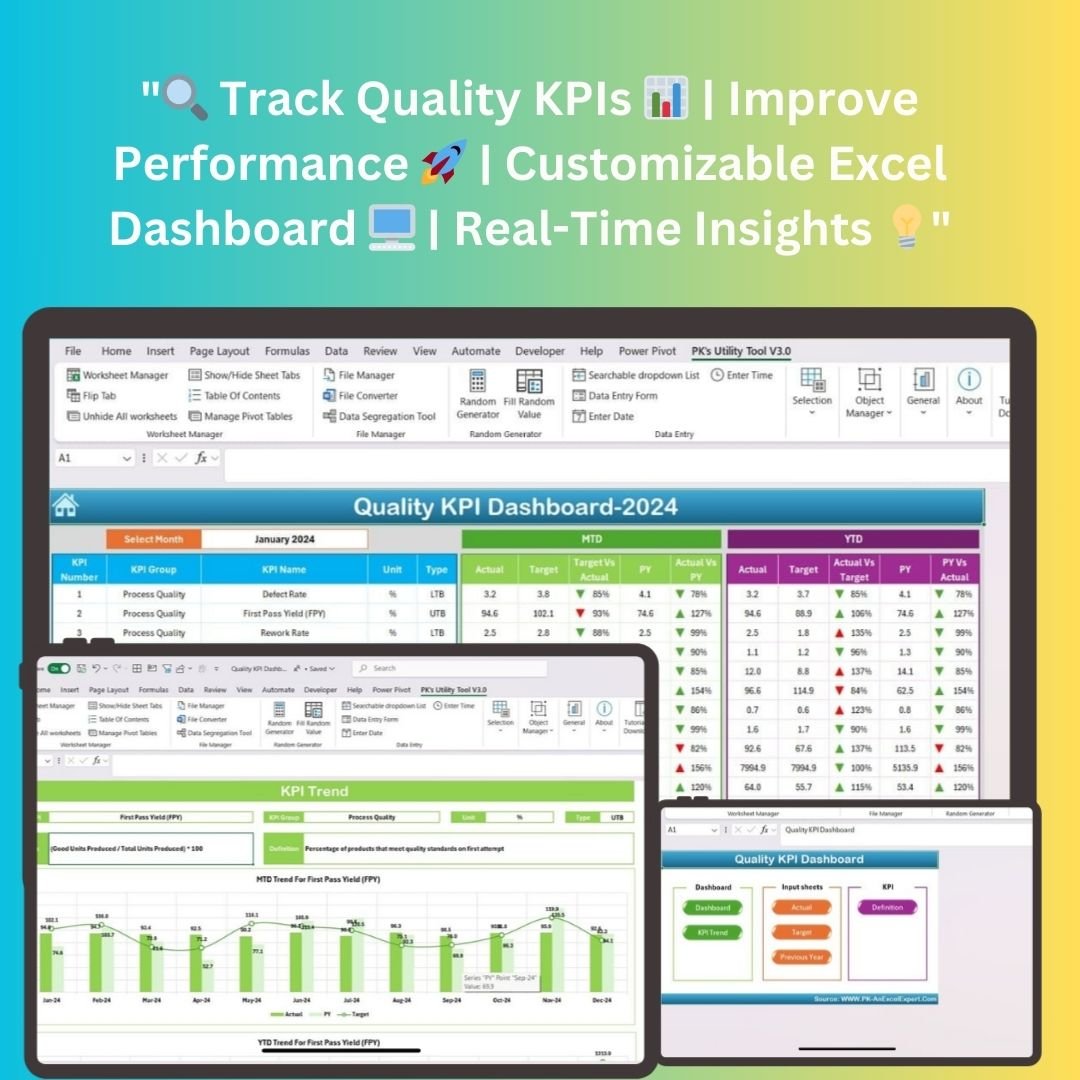
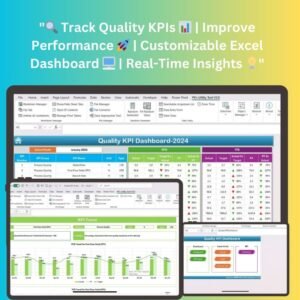
The Quality KPI Dashboard in Excel is an advanced, customizable tool designed to help businesses monitor and manage quality performance metrics effectively. This dashboard allows you to track key quality indicators, identify trends, and assess the health of your operations. With its user-friendly interface and comprehensive features, it provides actionable insights into your quality control processes, ensuring you can take immediate actions to improve efficiency and meet quality targets.

Key Features
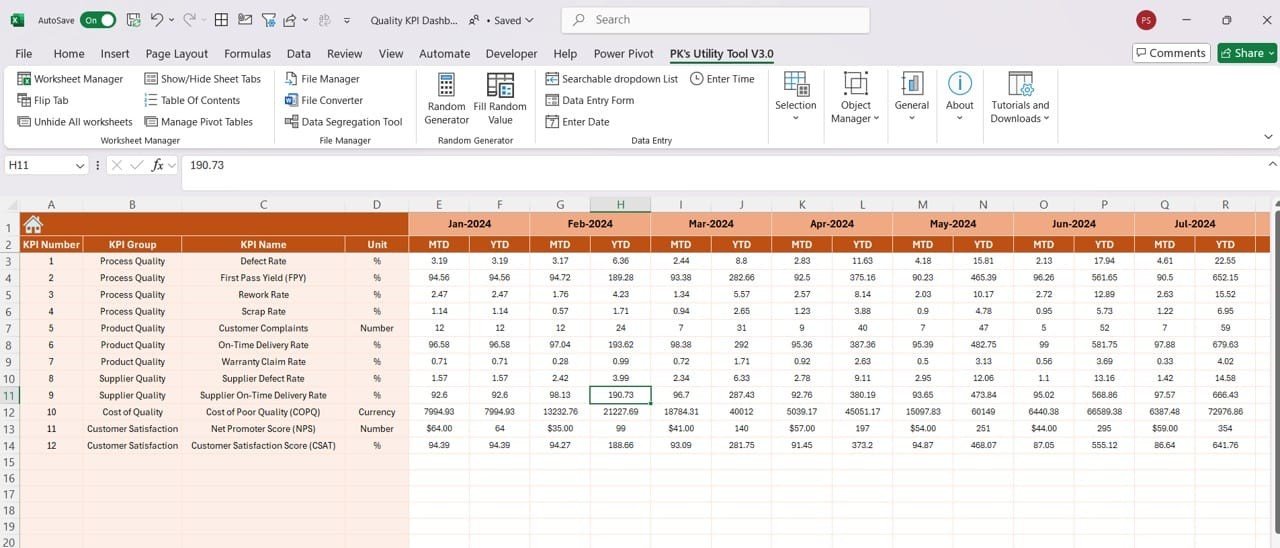
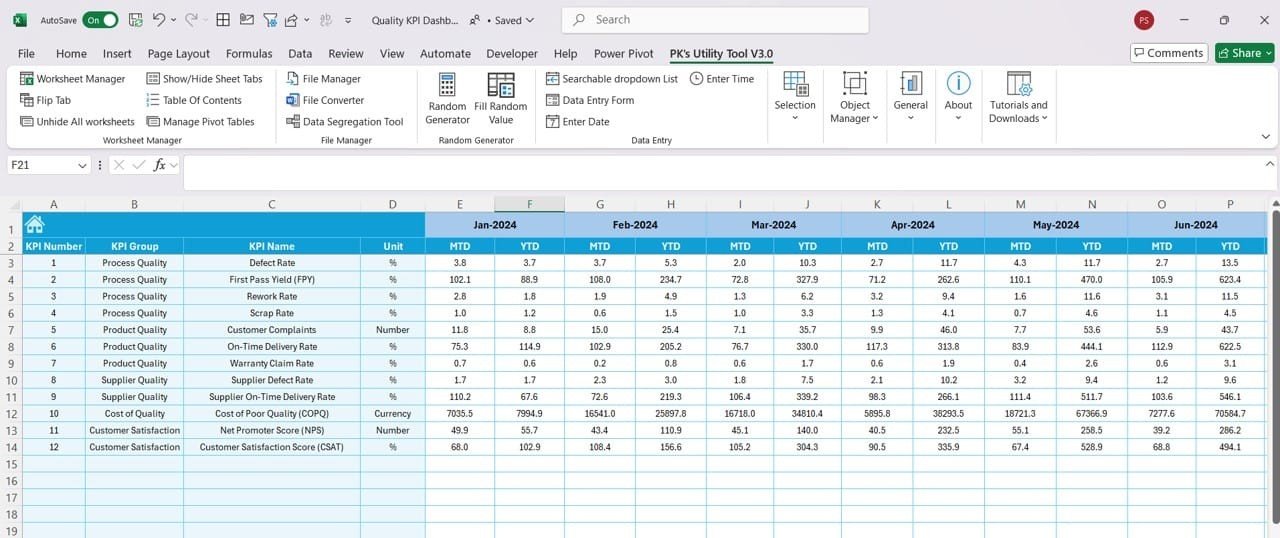
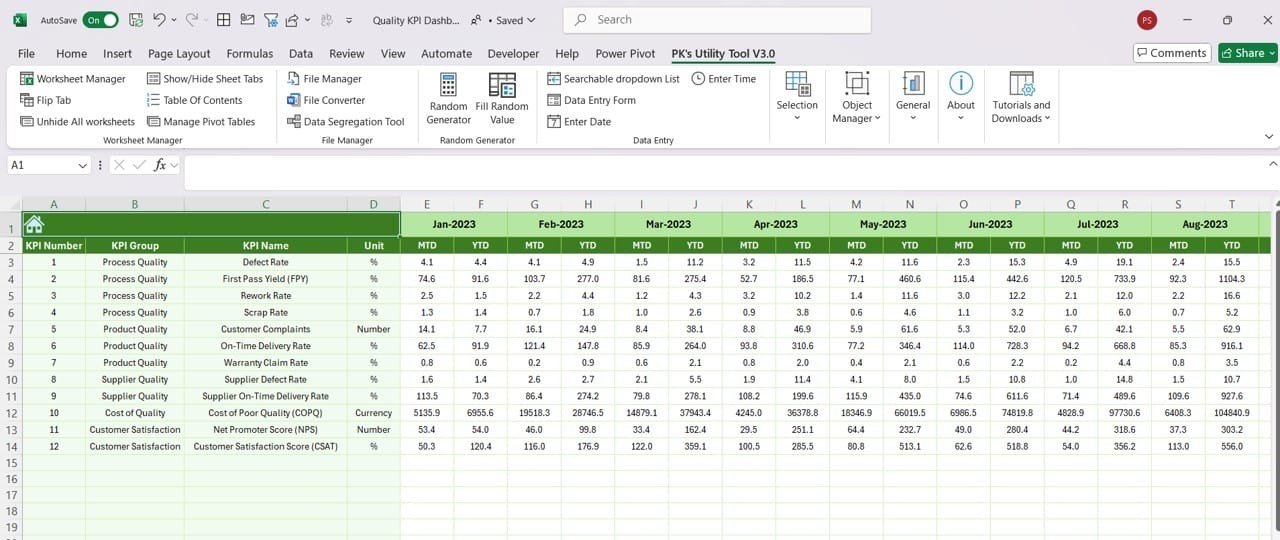
- Comprehensive KPI Tracking: Track essential quality KPIs such as Defect Rate, First Pass Yield (FPY), Rework Rate, Customer Complaints, and more. The dashboard offers clear visualizations and insights on your key performance indicators.
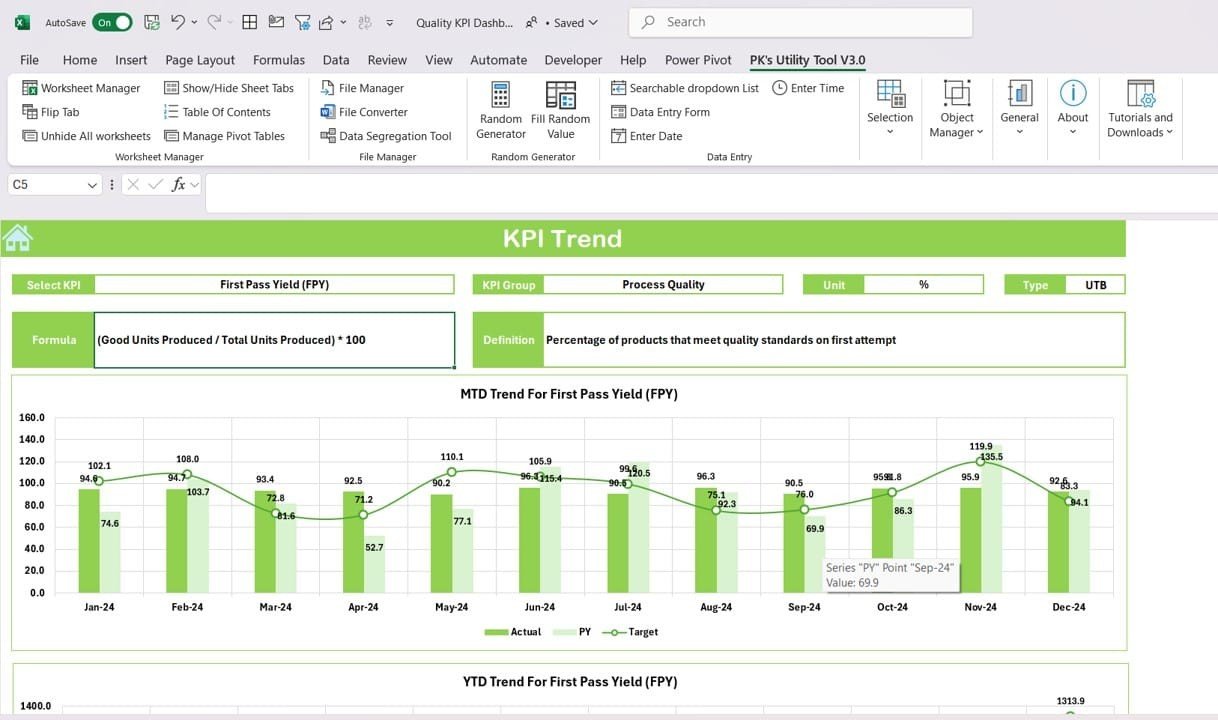
- Trend Analysis: Get a detailed view of monthly, quarterly, and yearly trends to understand your performance over time. Use this data to make proactive decisions for process improvement.
- User-Friendly Interface: Designed for ease of use, this dashboard allows you to enter and update your data quickly. The clean and simple layout makes it accessible even for users without advanced Excel skills.
- Automated Data Updates: Simply input your monthly data, and the dashboard will automatically update charts and tables for you. It offers a seamless workflow, saving time and effort.
- Multiple KPIs Visualization: Visualize KPIs like Process Quality, Supplier Quality, and Customer Satisfaction in one place. It includes various charts like line graphs, bar charts, and trend indicators.
- Customizable: Customize the dashboard based on your specific business needs. Tailor KPI categories, metrics, and thresholds for your industry.
- Monthly & YTD Tracking: Compare monthly performance with Year-to-Date (YTD) values to assess whether you’re on track to meet your annual goals.
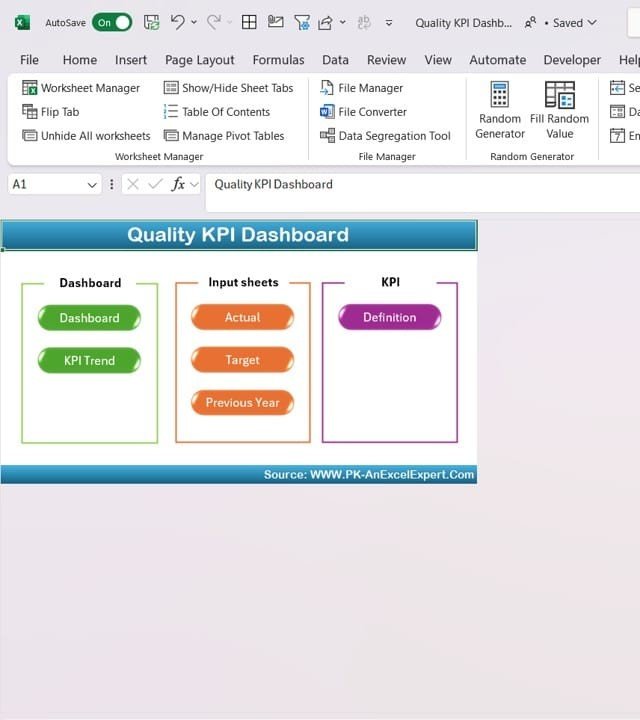
Dashboard Sections
- Dashboard Overview: This section provides a summary of the key KPIs, offering a quick glance at the overall quality performance.
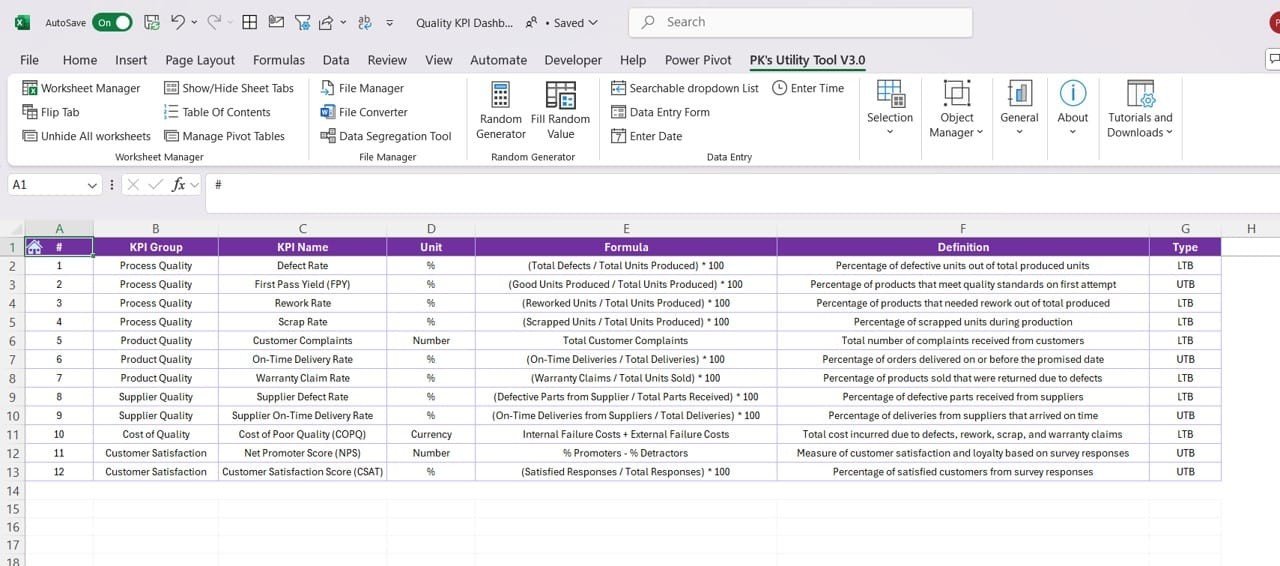
- KPI Definitions & Formulas: The dashboard includes a comprehensive list of all KPIs with their definitions and the formulas used to calculate them.
- Input Sheets: Easily update data for Actual, Target, and Previous Year’s values in dedicated input sheets. These sheets are seamlessly linked to the main dashboard for real-time updates.
- Trend Analysis: Visualize the trends for each KPI using both MTD (Month-to-Date) and YTD (Year-to-Date) views.
Benefits
- Improved Decision Making: With clear data representation, decision-makers can easily identify areas that need attention and improvement.
- Increased Efficiency: Automating the process of tracking quality metrics helps streamline operations and save valuable time.
- Better Quality Control: By continuously monitoring KPIs and trends, you can take corrective actions faster and prevent future issues.
- Data-Driven Insights: The dashboard offers actionable insights, which help ensure that your organization is always working towards maintaining high standards of quality.
Compatibility
- Excel Version: Compatible with Excel 2016 and later versions, including Excel 365.
- Operating System: Works seamlessly on Windows and macOS.
Why Choose This Dashboard?
- This dashboard is the perfect tool for businesses in manufacturing, production, customer service, or any industry where quality control is crucial. Whether you’re a small team or part of a large organization, this Excel dashboard can help you keep track of your most important quality metrics and improve operational performance.
Get Your Quality KPI Dashboard in Excel Today!
- Instant Download: Get immediate access to the file after purchase.
- Easy to Use: No complex installation process.
- Customizable for Your Needs: Adjust KPIs, input data, and more to suit your business.
Click here to read the detailed blog post
Visit our YouTube channel to learn step-by-step video tutorials


Reviews
There are no reviews yet.