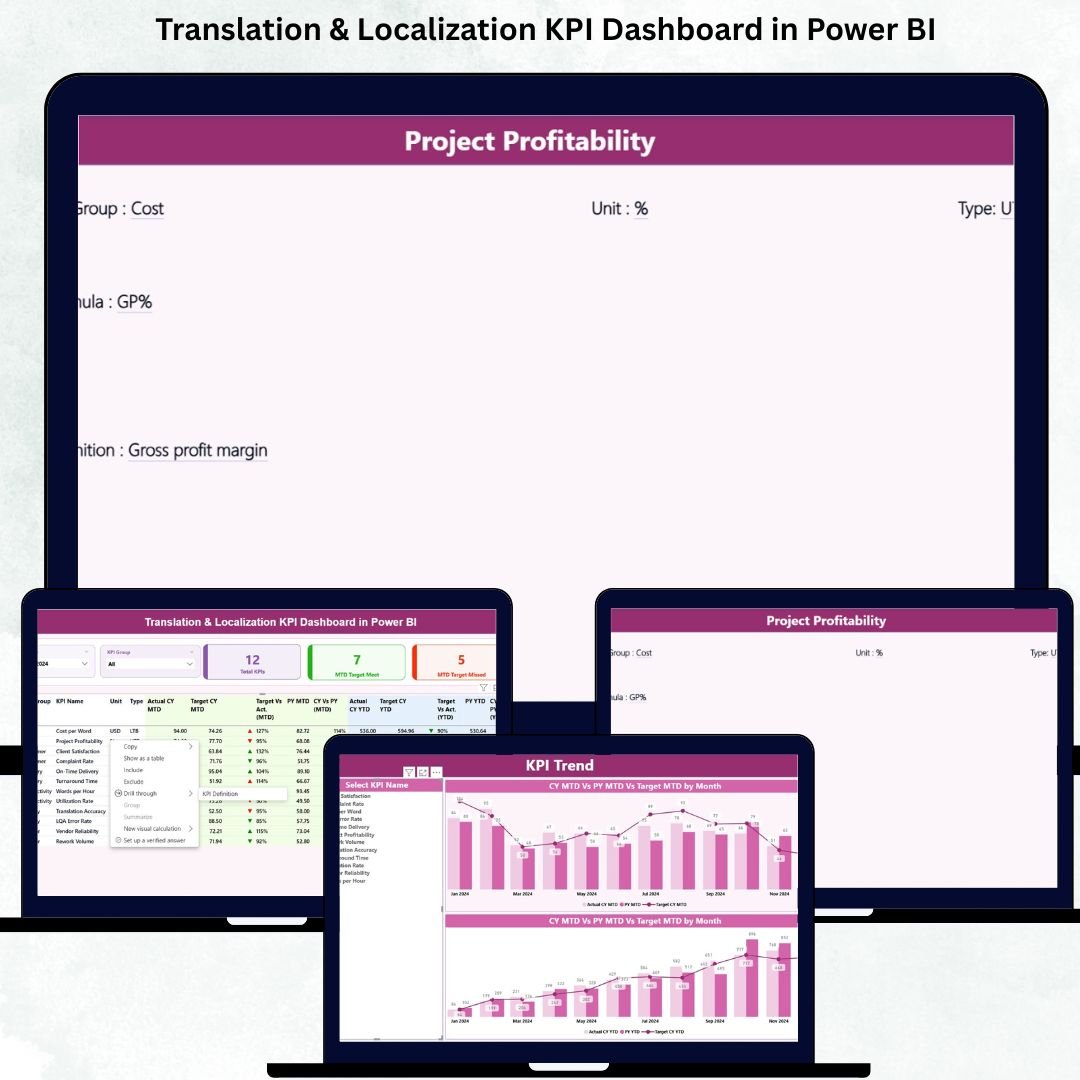
Managing translation and localization projects across multiple languages, deadlines, and quality standards is challenging. Teams often struggle with scattered data, manual reports, delayed updates, and unclear performance visibility. The Translation & Localization KPI Dashboard in Power BI changes everything by giving you an organized, real-time, and fully interactive performance monitoring system—right inside Power BI.
This professionally designed Power BI dashboard brings all critical KPIs together so teams can track progress instantly, identify issues early, and deliver high-quality translations faster than ever. Whether you manage internal localization teams, work with freelancers, or lead enterprise-level translation workflows, this dashboard helps you run operations with confidence, clarity, and control.Translation & Localization KPI Dashboard in Power BI
🌟 Key Features of Translation & Localization KPI Dashboard in Power BI
This powerful dashboard is designed with practical features that help translation teams monitor performance at every level.
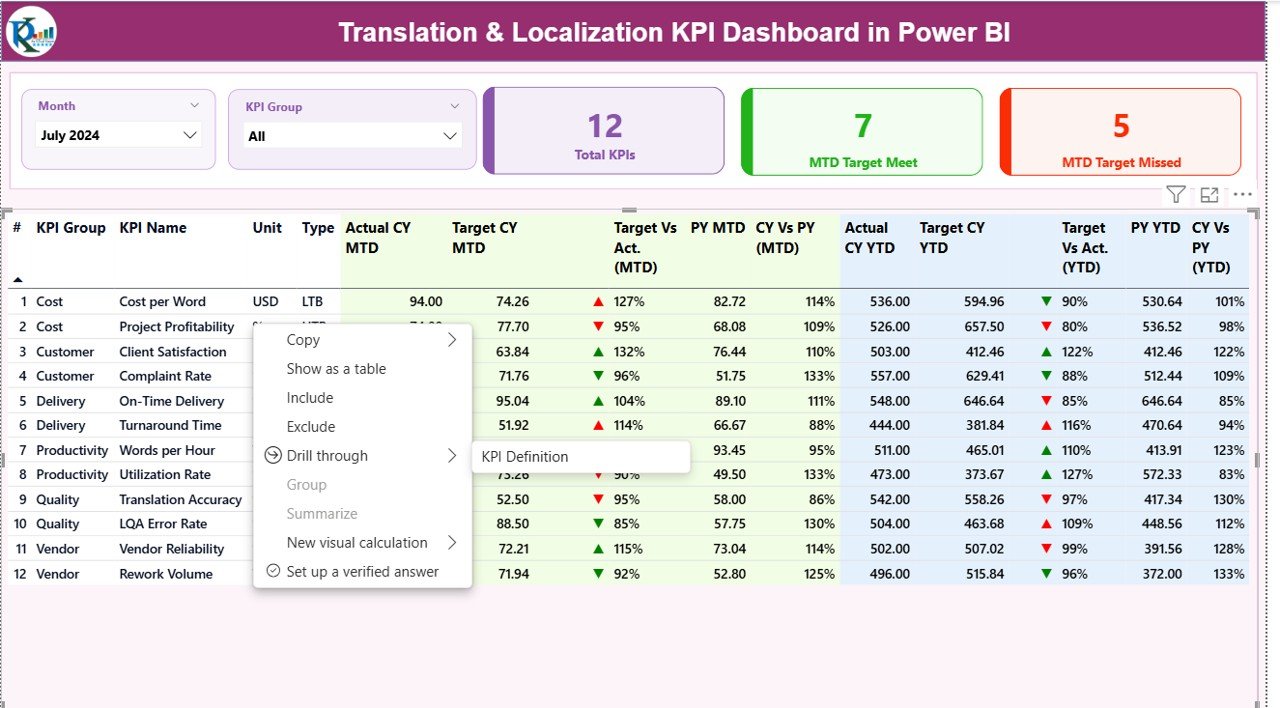
1️⃣ Summary Page – Your Master Control Panel
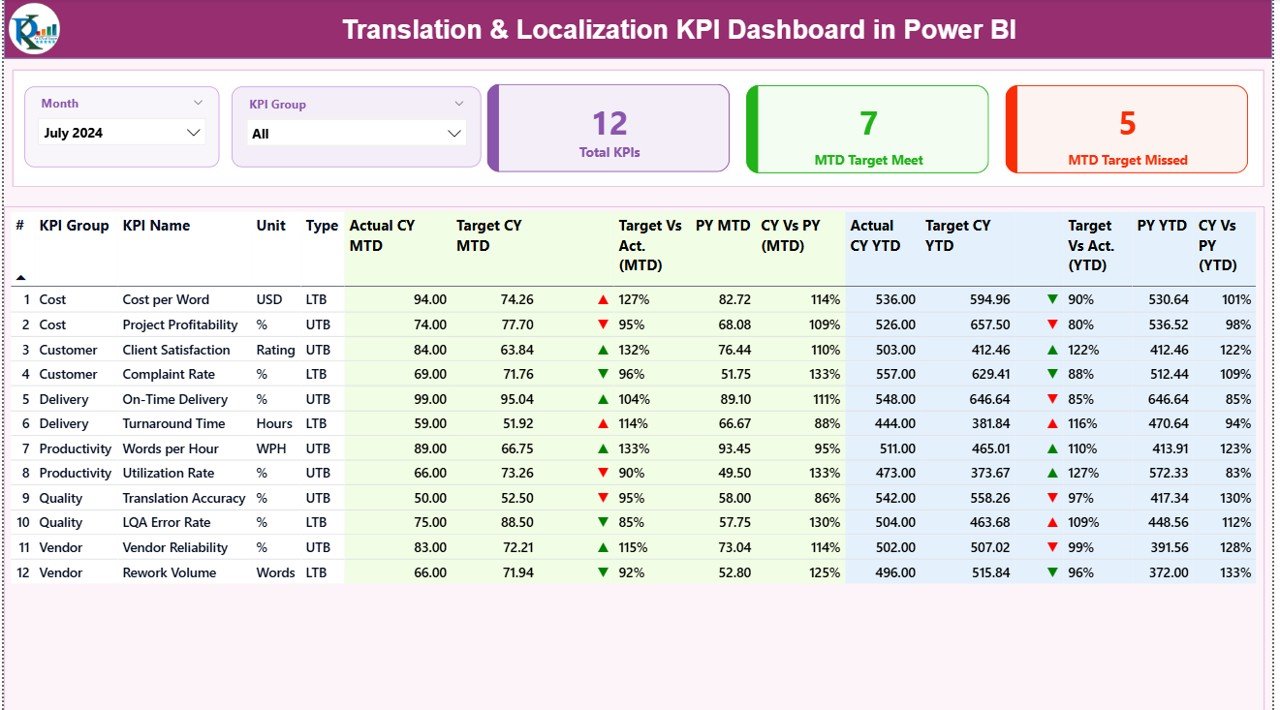
The Summary Page gives you a complete overview of performance for the selected month and KPI group. It includes:
-
Month and KPI Group slicers for targeted analysis
-
Three KPI cards showing Total KPIs, MTD Target Met, and MTD Target Missed
-
A detailed KPI table with MTD, YTD, and Year-over-Year comparisons
-
Easy-to-read up/down status icons for quick decision-making
You get clear insights on translation quality, delivery timelines, productivity trends, financial performance, and more.
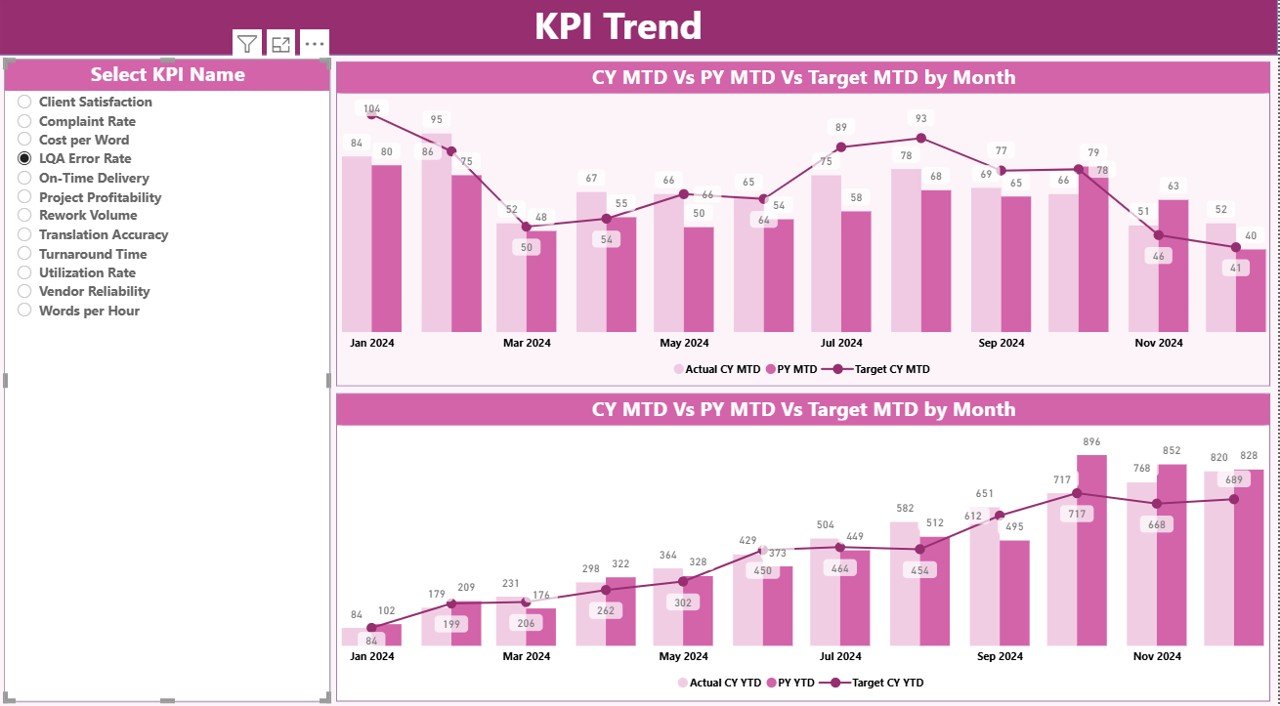
2️⃣ KPI Trend Page – Complete Trend and Comparison Analysis
Track how every KPI progresses month over month with:
-
MTD Trend Chart
-
YTD Trend Chart
-
KPI selector slicer
This helps teams quickly identify improvement patterns, productivity fluctuations, seasonal effects, and declining performance areas.
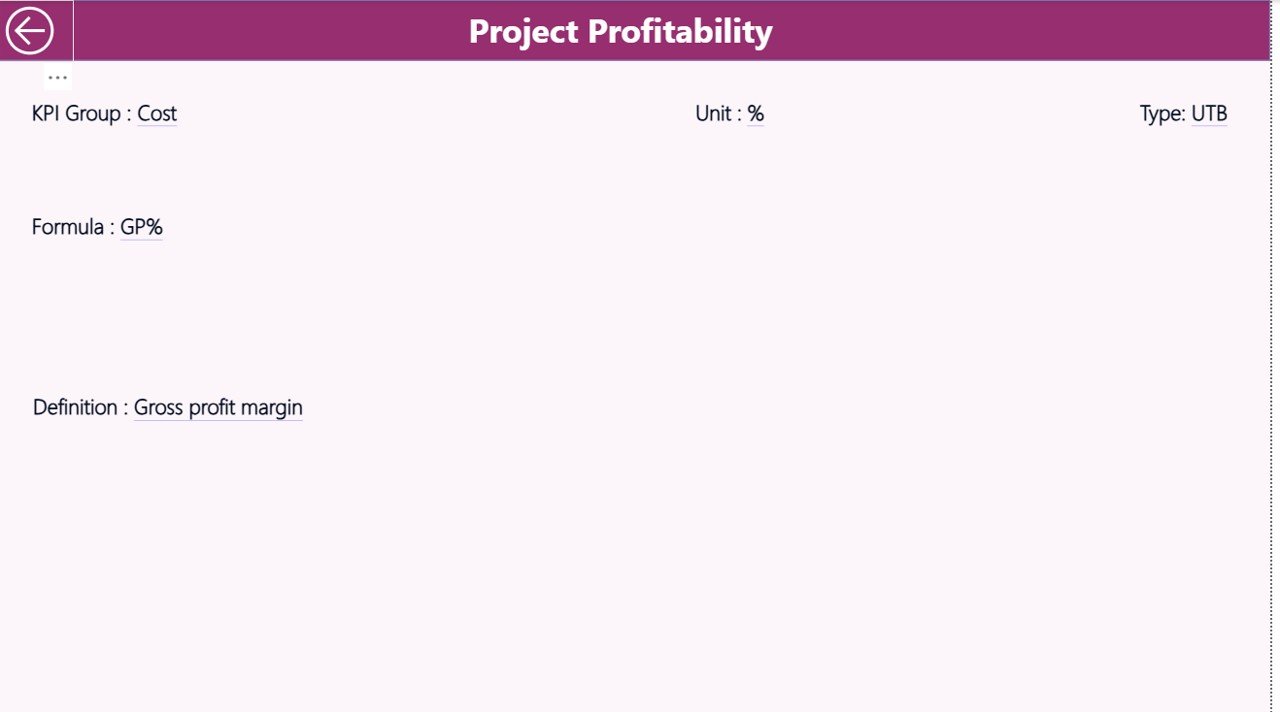
3️⃣ KPI Definition Page – Clear Documentation for Every Metric
This drill-through page shows:
-
KPI Name
-
KPI Group
-
Formula
-
Unit
-
Definition
-
KPI Type (LTB or UTB)
No more confusion about how KPIs are calculated—everyone sees the exact definition.
📦 What’s Inside the Translation & Localization KPI Dashboard in Power BI
Your Power BI file is fully structured and ready to use. You get:
✔ 3 Fully Designed Power BI Pages
-
Summary Page
-
KPI Trend Page
-
KPI Definition Page
✔ Excel Data File with 3 Key Sheets
-
Input_Actual Sheet – Enter MTD & YTD actuals
-
Input_Target Sheet – Enter MTD & YTD targetsTranslation & Localization KPI Dashboard in Power BI
-
KPI Definition Sheet – Set all KPI details
✔ Pre-Built KPIs Across Multiple Categories
-
Quality (LQI, Review Error Rate, Rework %)
-
Productivity (Words/Day, On-Time Delivery)
-
Finance (Cost per Word, Profitability per Project)
-
Delivery (Turnaround Time, Delayed Deliveries)
-
Customer (Client Satisfaction Score)
Everything is already structured—just plug in your data.
🚀 How to Use the Translation & Localization KPI Dashboard in Power BI
Follow these simple steps to start analyzing your performance instantly:
-
Prepare your list of KPIs
-
Fill KPI definitions in the Excel file
-
Enter actual data in the Input_Actual sheet
-
Add target values in the Input_Target sheet
-
Load the Excel file into Power BI
-
Click Refresh to update the visuals
That’s it—your dashboard is ready to use!
🎯 Who Can Benefit from This Translation & Localization KPI Dashboard?
This dashboard is perfect for:Translation & Localization KPI Dashboard in Power BI
👨💼 Localization Managers
Track quality, timelines, and team performance.
👩💼 Project Coordinators
Plan better, reduce delays, and manage workloads intelligently.
📝 Translators & Reviewers
Understand performance trends to improve output.
🏢 Language Service Providers (LSPs)
Offer transparent, data-driven reporting to clients.
🌍 Enterprises with Global Operations
Monitor translation efficiency across languages and regions.
Whether you’re a freelance project manager or a large multinational, this dashboard gives you everything you need to run smoother and smarter localization operations.
📘 Click here to read the Detailed blog post
Watch the step-by-step video tutorial:


Reviews
There are no reviews yet.