Managing pension funds requires precision, clarity, and consistency. From investment returns to contribution levels, every metric matters. That’s why we created the Pension Funds KPI Dashboard in Excel—a powerful, ready-to-use tool designed to simplify reporting, strengthen financial decision-making, and give pension fund teams complete visibility in one place.Pension Funds KPI Dashboard in Excel
Whether you manage large pension plans or smaller funds, this dashboard helps you track monthly and yearly KPIs with accuracy. With automated insights, trend analysis, and easy navigation,Pension Funds KPI Dashboard in Excelthis template brings structure, transparency, and efficiency to your pension management tasks.
✨ Key Features of the Pension Funds KPI Dashboard in Excel
The dashboard is packed with smart, user-friendly features that transform your reporting workflow:
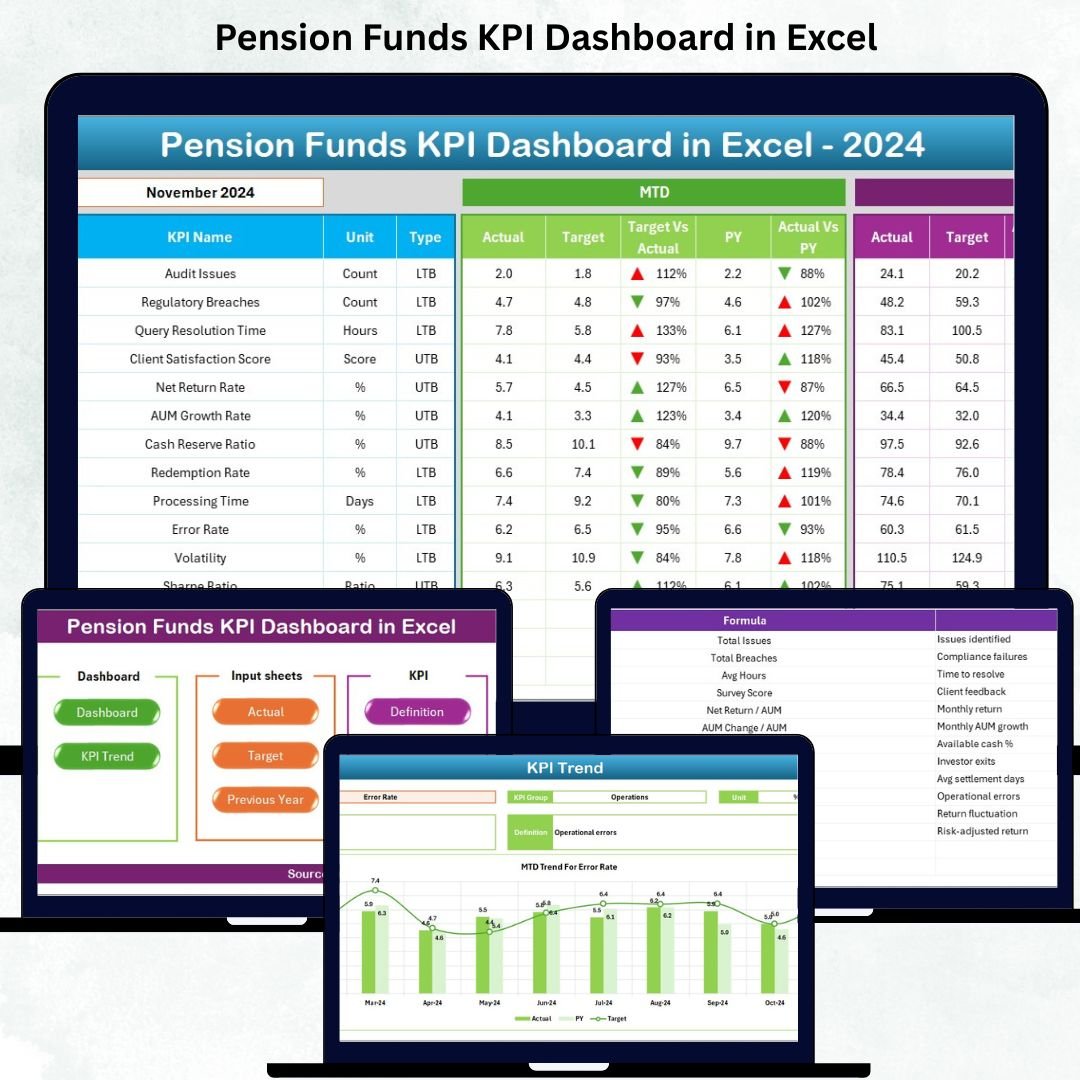
📊 7 Fully-Structured Worksheets
You get a systemized template with dedicated sheets for Summary, Dashboard View, Trend Analysis, Actual Numbers, Targets, Previous Year Data, and KPI Definitions.Pension Funds KPI Dashboard in Excel
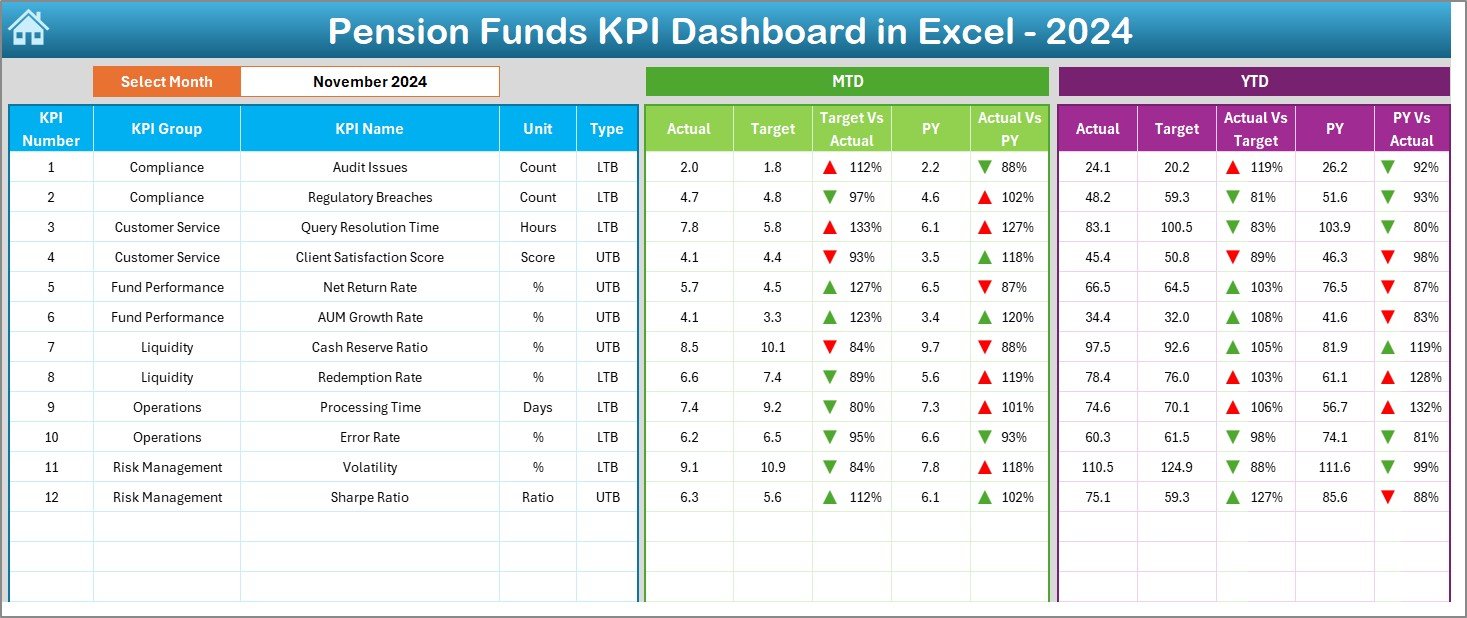
📈 Interactive Dashboard with Monthly Selection
Choose a month from a simple drop-down, and the entire dashboard updates instantly—MTD, YTD, Target, Actual, PY numbers, and performance indicators.
🎯 Target vs Actual Comparison
Monitor performance in real-time using conditional formatting arrows that highlight progress and gaps.
🔄 Year-over-Year Tracking
Track improvement by comparing current numbers with previous year data for better financial strategy and accuracy.
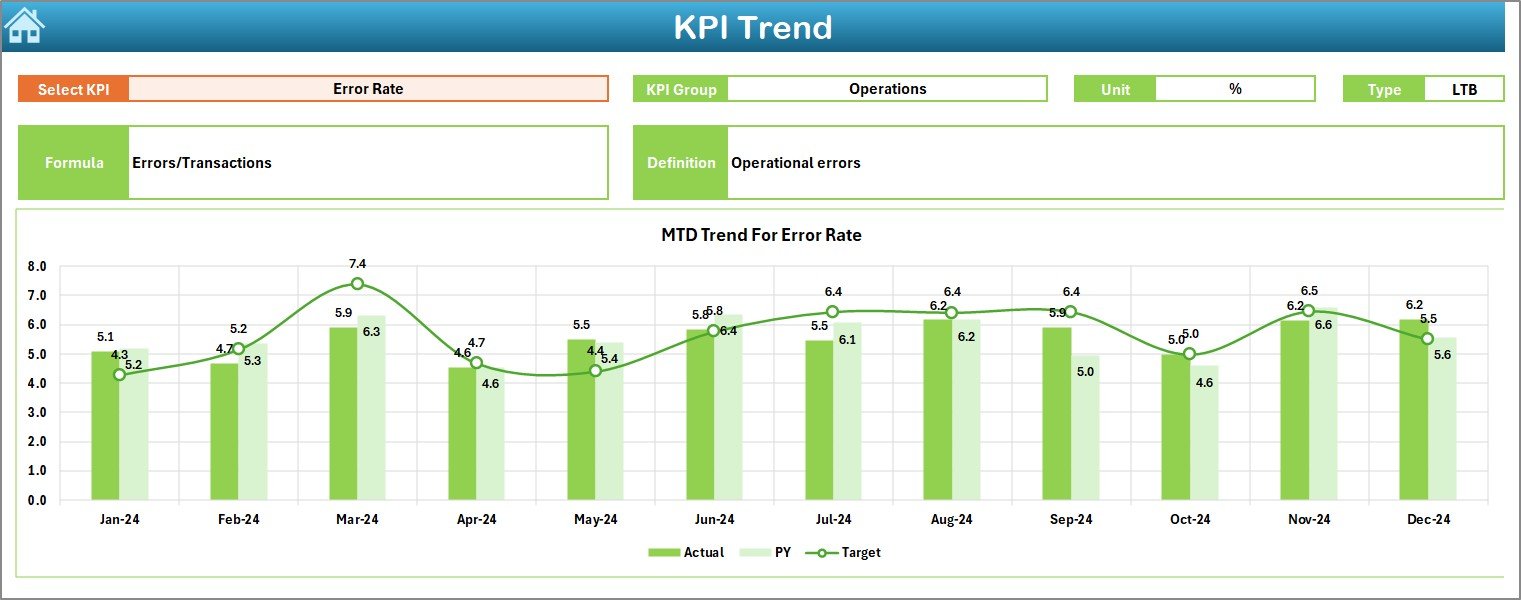
📉 Trend Analysis for All KPIs
Explore long-term patterns using MTD and YTD line charts and bar charts updated automatically.
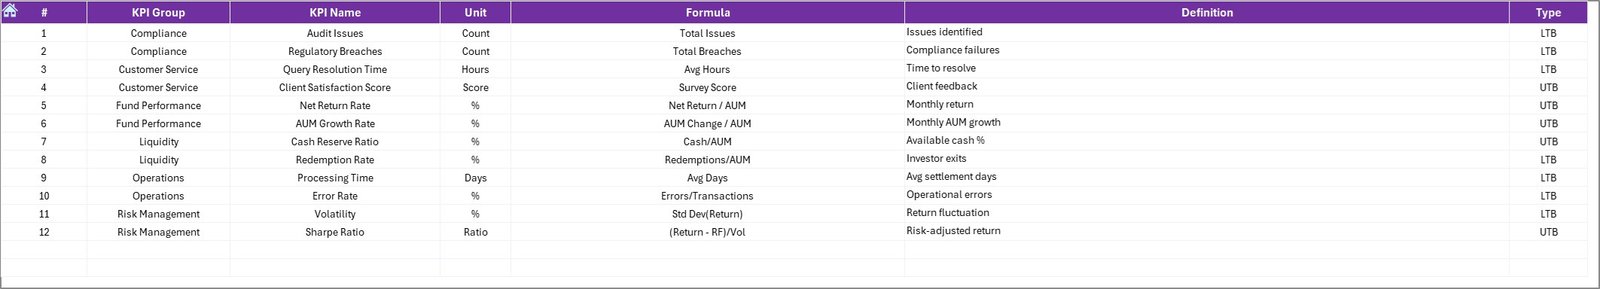
🧮 Ready-to-Use KPI Definition Sheet
Every KPI—its formula, type (LTB/UTB), and meaning—is clearly documented for team clarity and smooth collaboration.
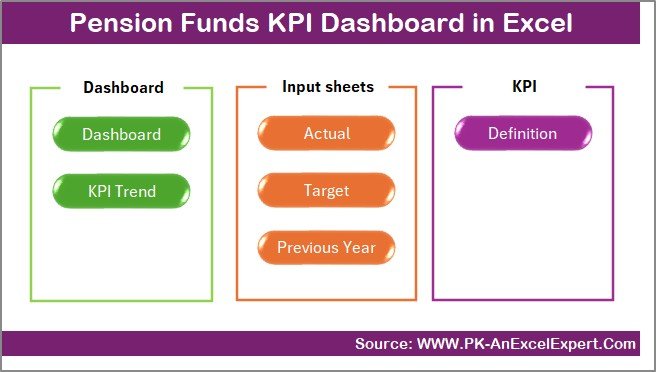
📦 What’s Inside the Pension Funds KPI Dashboard in Excel
This digital product includes all the essential elements needed for complete pension fund monitoring:
✔️ Dashboard Sheet
A clean visual interface presenting KPI cards, charts, monthly comparisons, and YTD summaries.
✔️ Trend Sheet
Select any KPI and instantly view performance trends using integrated charts.
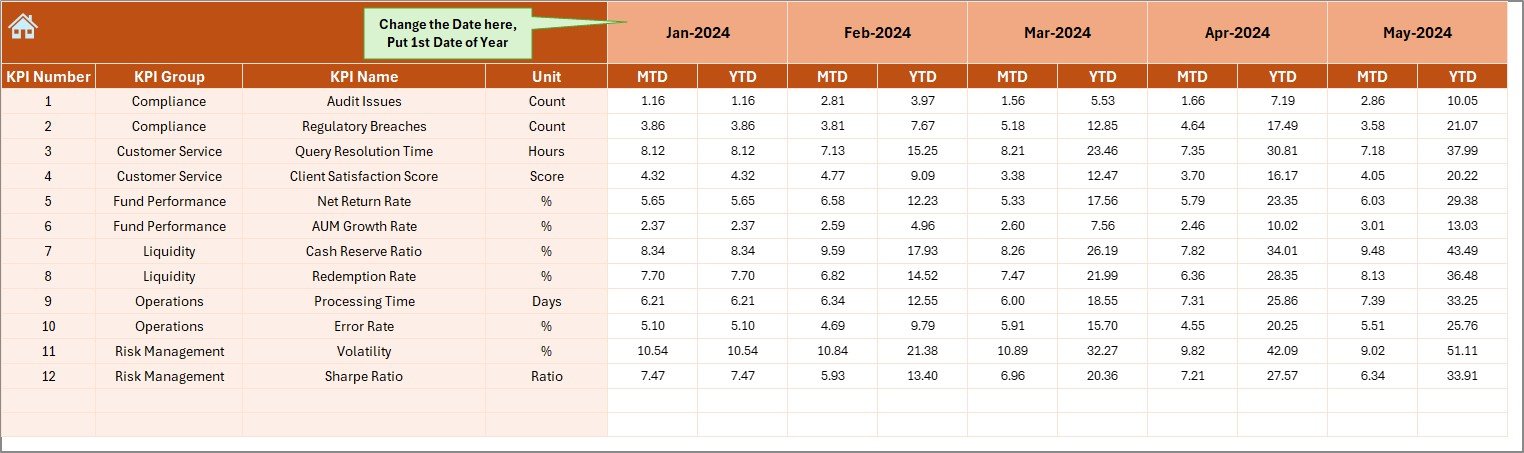
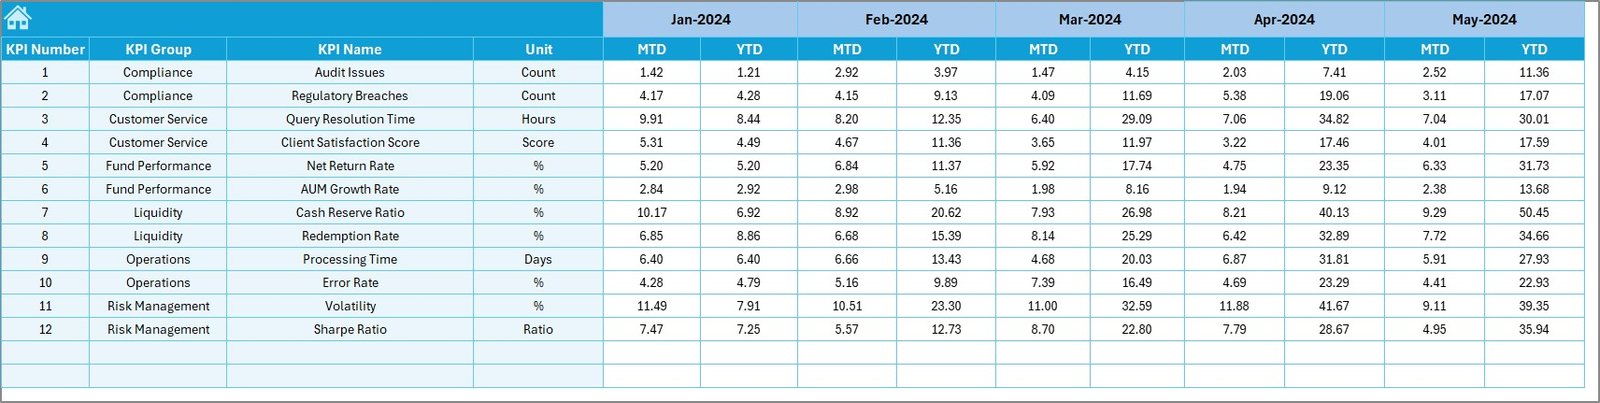
✔️ Actual Numbers Input Sheet
Simply enter monthly data—no complex formulas required. Everything is pre-built for automation.
✔️ Target Sheet
Define your MTD and YTD goals for every KPI to compare results throughout the year.
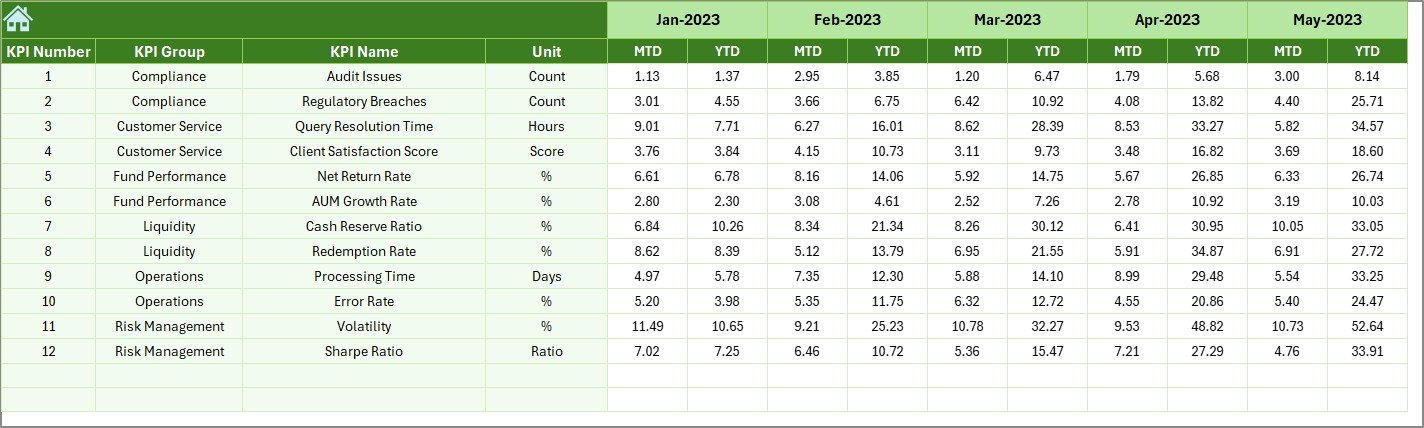
✔️ Previous Year Sheet
Store last year’s data to assess progress and fund stability accurately.
✔️ KPI Definition Sheet
Keep your KPI glossary structured and consistent across the team.
✔️ Summary Page
Jump directly to any sheet using clickable navigation buttons.
🛠️ How to Use the Pension Funds KPI Dashboard in Excel
Using this dashboard is simple—even for users with basic Excel skills.
Step-by-step workflow:
1️⃣ Enter the first month of the financial year
Update cell E1 in the Actual Data sheet.
2️⃣ Enter Actual MTD & YTD numbers
Fill in the KPI values for the selected month.
3️⃣ Enter Target numbers
Update monthly and yearly targets in the Target Sheet.
4️⃣ Add Previous Year data
Enter last year’s KPI values into the Previous Year Sheet.
5️⃣ Choose the month on the Dashboard page
Watch the charts and KPI cards update instantly.
6️⃣ Review trends
Use the Trend sheet to understand long-term performance and detect early warning signals.
🎯 Who Can Benefit from This Pension Funds KPI Dashboard in Excel
This dashboard is ideal for:
👨💼 Pension Fund Managers
Track performance, manage reporting, and highlight risks with clarity.
📊 Financial Analysts
Analyze trends, review fund health, and prepare insights for management.
🧮 Actuaries
Study long-term liabilities, funding ratios, and pension obligations.
🧑💻 Accountants & Auditors
Verify monthly and annual results easily using structured data.
🏢 Corporate Finance Teams
Track contribution levels, payouts, returns, and fund stability in a single view.
Anyone responsible for pension operations will benefit from this automated, easy-to-use, and highly visual Excel dashboard.
### Click here to read the Detailed Blog Post
Watch the step-by-step video tutorial:


Reviews
There are no reviews yet.