Event planning is a high-pressure workflow where multiple actions happen at the same time—budgeting, scheduling, vendor coordination, venue setup, marketing, reporting, and client communication. When teams try to manage all this in different spreadsheets, they waste time and lose clarity. The Event Production Dashboard in Excel solves this problem completely.
This ready-to-use Excel solution brings together all event performance metrics into one organized and interactive file. It helps you track profit margins, budgets, revenue, client insights, venue performance, and monthly event trends with just a few clicks. Because the dashboard uses Excel, anyone—event organizers, agencies, freelancers, or marketing teams—can use it without learning new tools.
Whether you manage weddings, conferences, exhibitions, concerts, corporate events, or promotional activities, this dashboard gives you real-time visibility and helps you make smarter decisions for every event.
📦 What’s Inside the Event Production Dashboard in Excel
This dashboard contains five analytical pages and one support sheet, all connected through a Page Navigator. Each page focuses on a different area of event management, helping you study your operations with complete clarity.
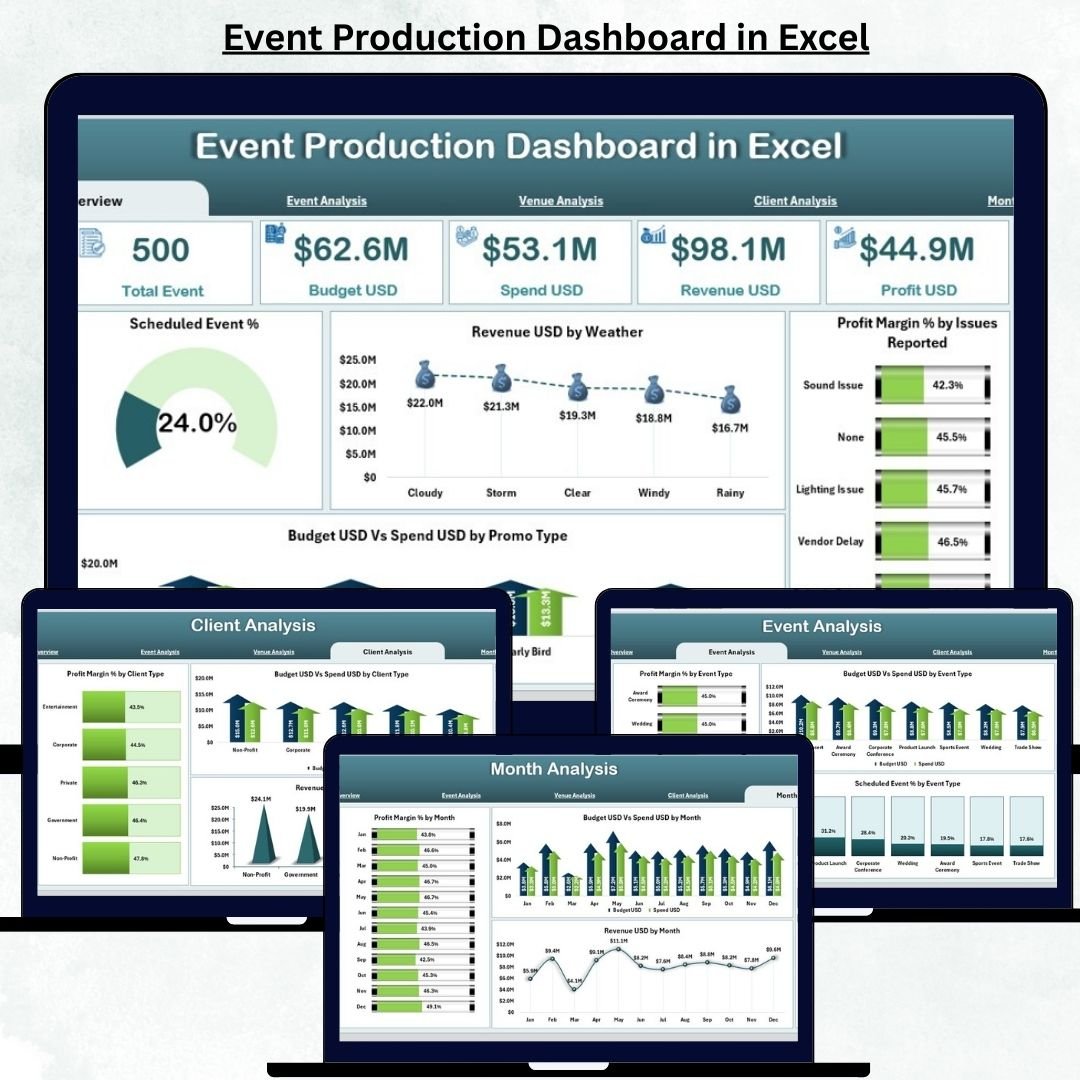
⭐ 1. Overview Page – Your Complete Event Snapshot
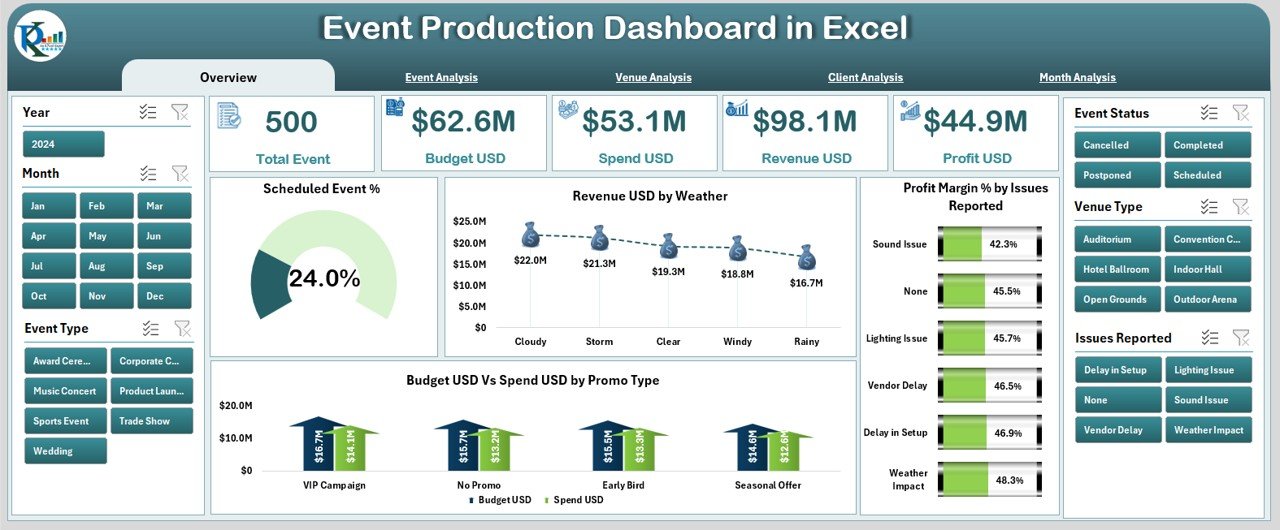
The Overview Page acts as the command center of the dashboard. It shows the key metrics needed to evaluate event success.
This page includes:
-
Right-side slicer for filtering
-
5 summary cards to show top KPIs
-
4 detailed charts to analyze event performance
Charts Displayed:
-
Scheduled Event %
-
Revenue (USD) by Weather
-
Profit Margin % by Issues Reported
-
Budget USD vs Spend USD vs Promo Type
This page helps you quickly understand how well your events are performing, which issues are impacting profit, and how marketing spend influences revenue.
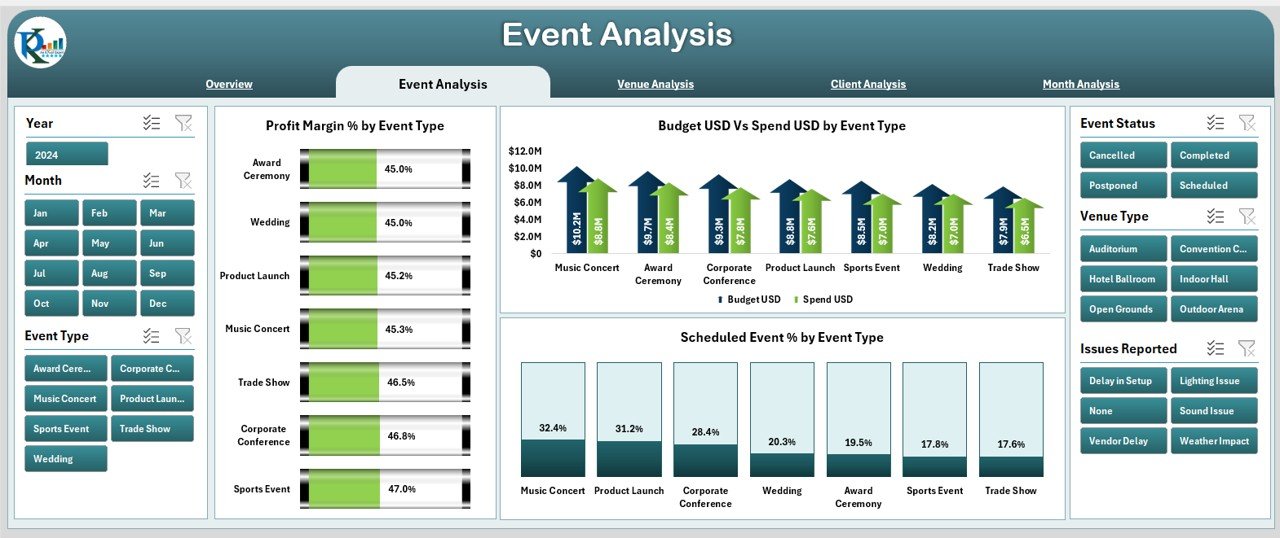
⭐ 2. Event Analysis Page – Compare Event Types Easily
This page provides deep insights into event-type performance, helping you identify strengths and improvement areas.
Charts on this page include:
-
Profit Margin % by Event Type
-
Budget vs Spend by Event Type
-
Scheduled Event % by Event Type
With this information, you can understand which events deliver high profit, where overspending happens, and which categories need better planning.
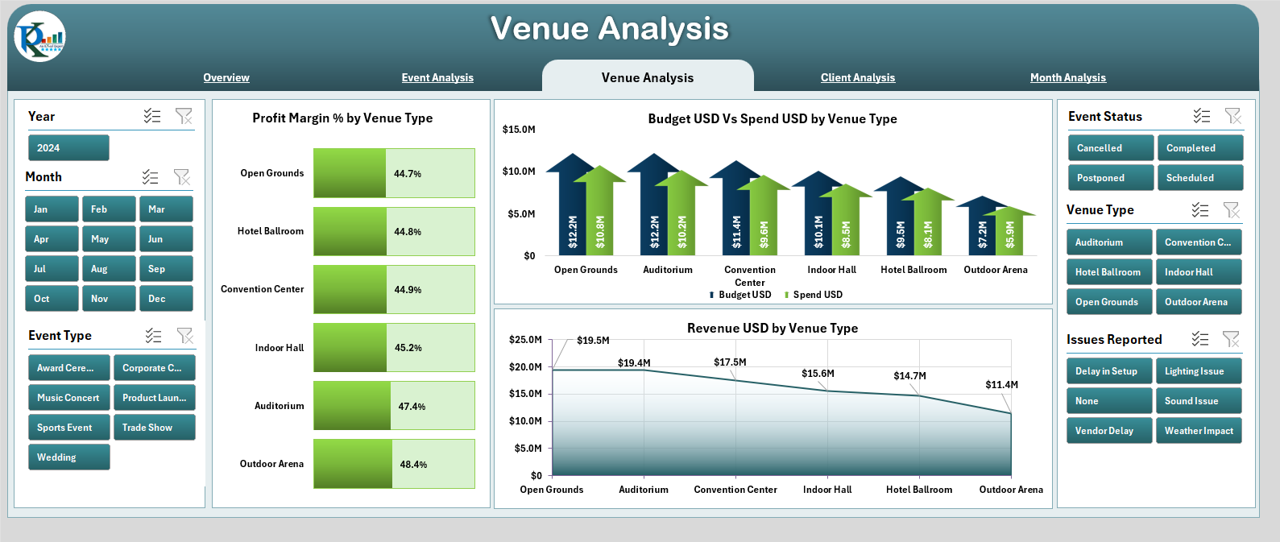
⭐ 3. Venue Analysis Page – Evaluate Venue Performance
Venues play a major role in event cost, revenue, and customer experience. This page compares the performance of different venue types.
It includes:
-
Profit Margin % by Venue Type
-
Budget vs Spend by Venue Type
-
Revenue (USD) by Venue Type
This helps you choose top-performing venues, negotiate strategically, and avoid costly or low-performing locations.
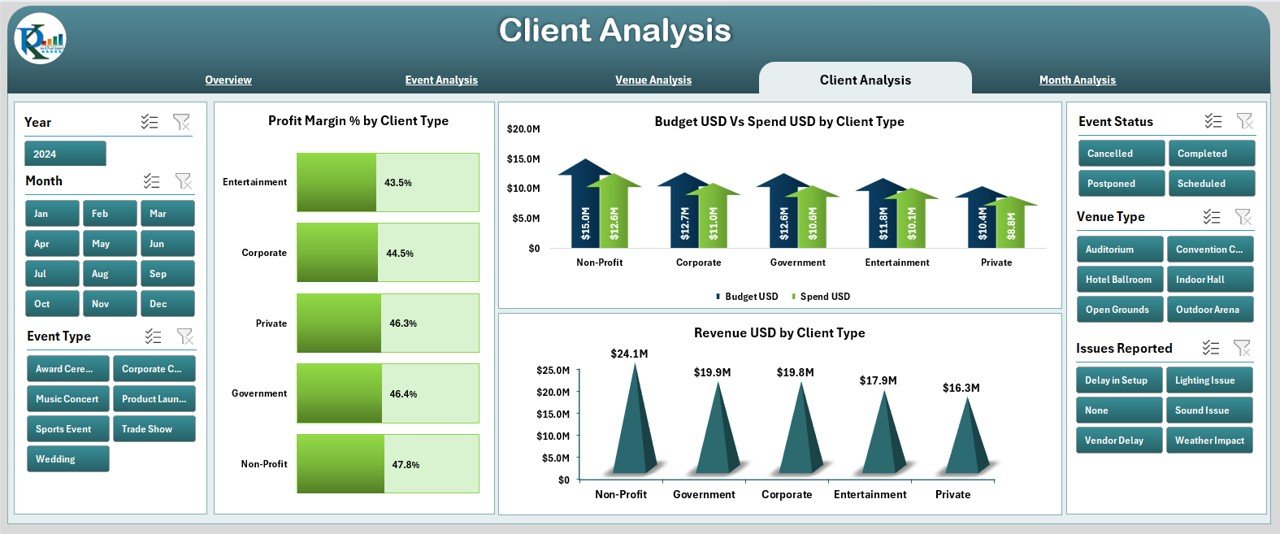
⭐ 4. Client Analysis Page – Understand Client Segments
Client behavior affects budget, profitability, and event success. The Client Analysis Page provides clear insights for client-level decision-making.
Charts include:
-
Profit Margin % by Client Type
-
Budget vs Spend by Client Type
-
Revenue (USD) by Client Type
This page helps you prioritize high-value clients, offer better services, and customize your event strategy based on client segments.
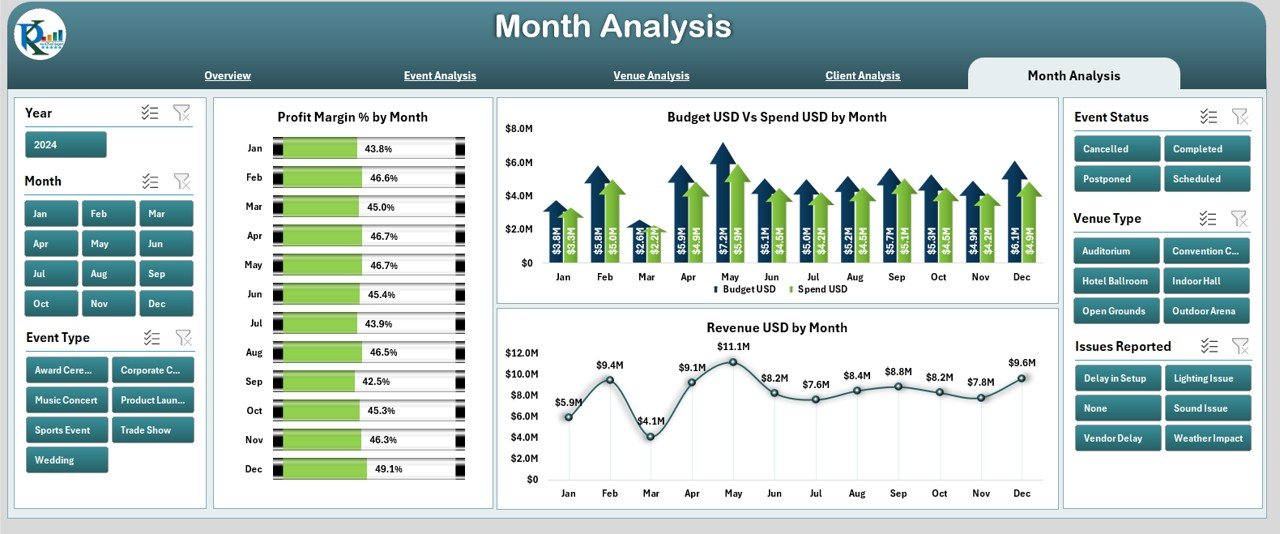
⭐ 5. Month Analysis Page – Track Monthly Event Trends
Events are often seasonal, and your monthly performance plays a key role in planning resources, budgets, and marketing.
This page shows:
-
Profit Margin % by Month
-
Budget vs Spend by Month
-
Revenue (USD) by Month
These insights help you identify peak months, predict low-performing seasons, and allocate resources more efficiently.
🛠️ How to Use the Event Production Dashboard in Excel
This dashboard is fully Excel-powered and easy to manage.
You only need to:
1️⃣ Update the Data Sheet with new event information
2️⃣ Review charts across pages
3️⃣ Use filters for deep analysis
4️⃣ Customize KPIs or charts if needed
The dashboard automatically updates visuals, cards, and charts after every data refresh.
👥 Who Can Benefit from This Event Production Dashboard
This dashboard is perfect for:
-
🎤 Event Production Companies
-
🎪 Event Management Agencies
-
🧑💼 Corporate Event Teams
-
🎬 Media & Marketing Teams
-
💼 Freelance Event Planners
-
🎓 University or Community Event Committees
-
💡 Creative Agencies
If you plan or manage events, this dashboard will simplify your work and increase your profit.
### 📘 Click here to read the Detailed Blog Post
### 📺 Visit our YouTube channel to learn step-by-step video tutorials:
👉 Youtube.com/@PKAnExcelExpert


Reviews
There are no reviews yet.