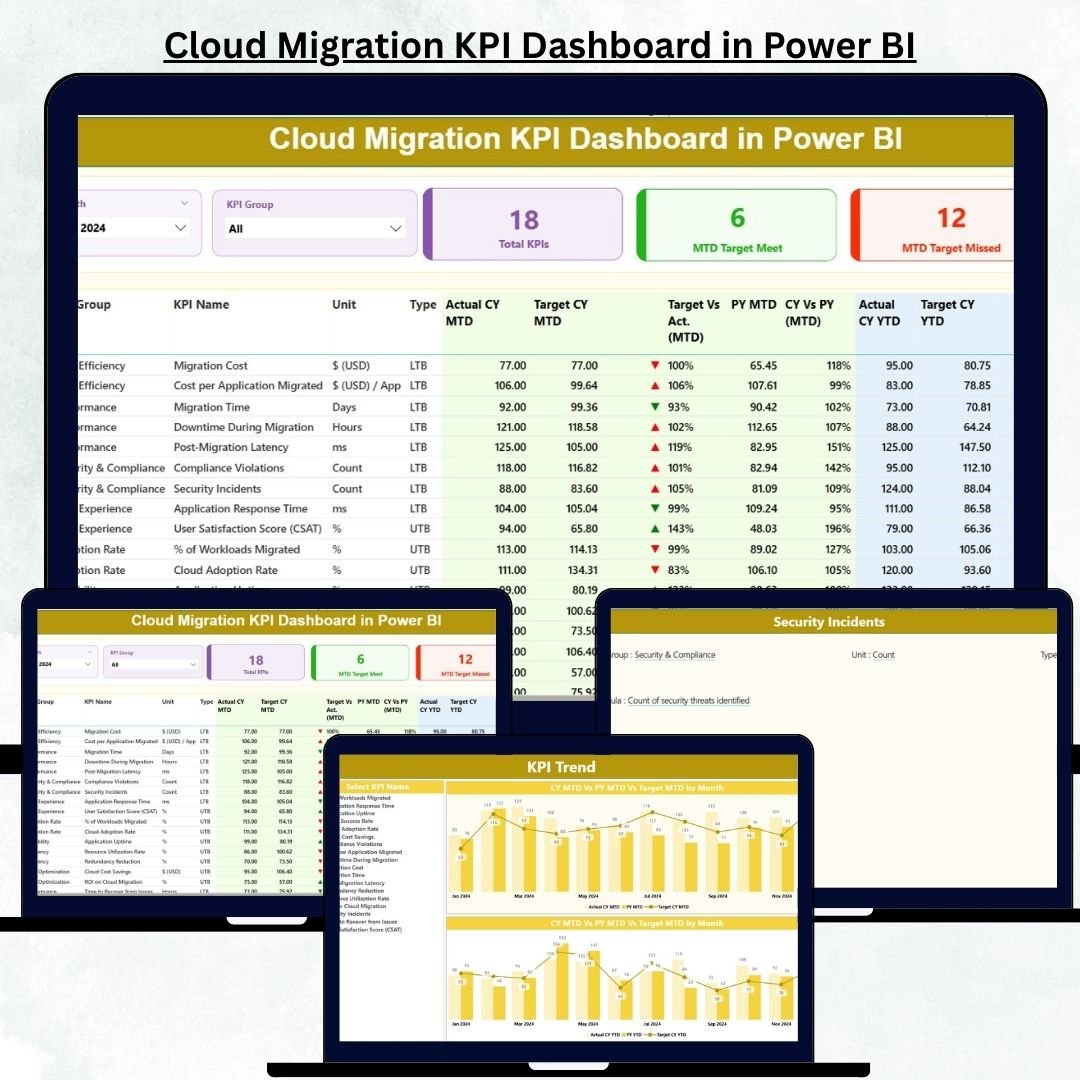
Cloud migration is one of the fastest-growing transformations in the IT industry. Companies move applications, data, and infrastructure to the cloud to boost speed, scalability, agility, and cost efficiency. But while the migration journey is exciting, tracking progress becomes extremely difficult. Teams struggle with scattered spreadsheets, manual reports, unclear metrics, and inconsistent data. That’s where the Cloud Migration KPI Dashboard in Power BI becomes essential.
This dashboard gives companies a complete, real-time view of their migration performance. It tracks migration progress, application readiness, cost savings, downtime, risk levels, user adoption, compliance scores, and more—everything in one powerful, interactive dashboard. With MTD vs YTD comparisons, current year vs previous year analytics, and clean visualizations, teams make better, faster, and smarter decisions.
Whether you’re migrating workloads to AWS, Azure, Google Cloud, or a hybrid platform, this dashboard provides complete clarity across your cloud transformation journey.
📦 What’s Inside the Cloud Migration KPI Dashboard in Power BI
This dashboard includes three powerful analytical pages, each designed to give deep visibility into cloud migration progress and performance.
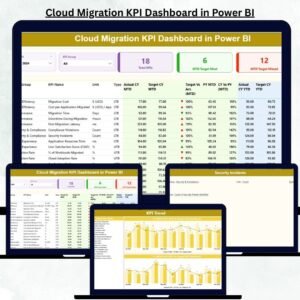
⭐ 1. Summary Page – Your Main Migration Overview
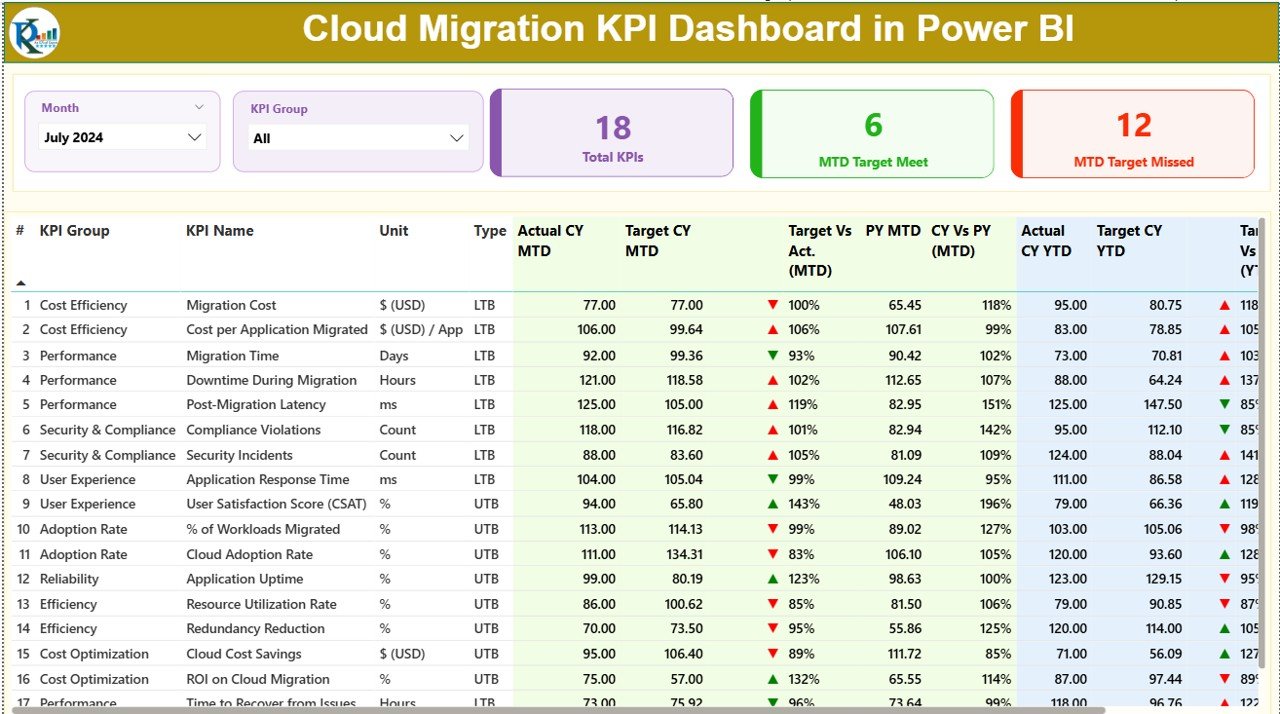
The Summary Page is the heart of the dashboard. It shows high-level KPIs that help teams instantly understand migration performance.
Top Filters:
-
Month Slicer → View migration performance for any month
-
KPI Group Slicer → Filter KPIs by Performance, Cost, Readiness, Security, Quality, Risk, etc.
KPI Cards Displayed:
-
Total KPIs Count
-
MTD Target Met Count
-
MTD Target Missed Count
These cards show how well your migration aligns with target goals.
Detailed KPI Table Includes:
-
KPI Number
-
KPI Group
-
KPI Name
-
Unit
-
KPI Type (UTB / LTB)
-
Actual CY MTD vs Target CY MTD
-
Previous Year Comparison
-
Actual CY YTD vs Target CY YTD
-
Icons showing Green/Red performance indicators
This page provides a complete picture of how migration KPIs perform across months and years.
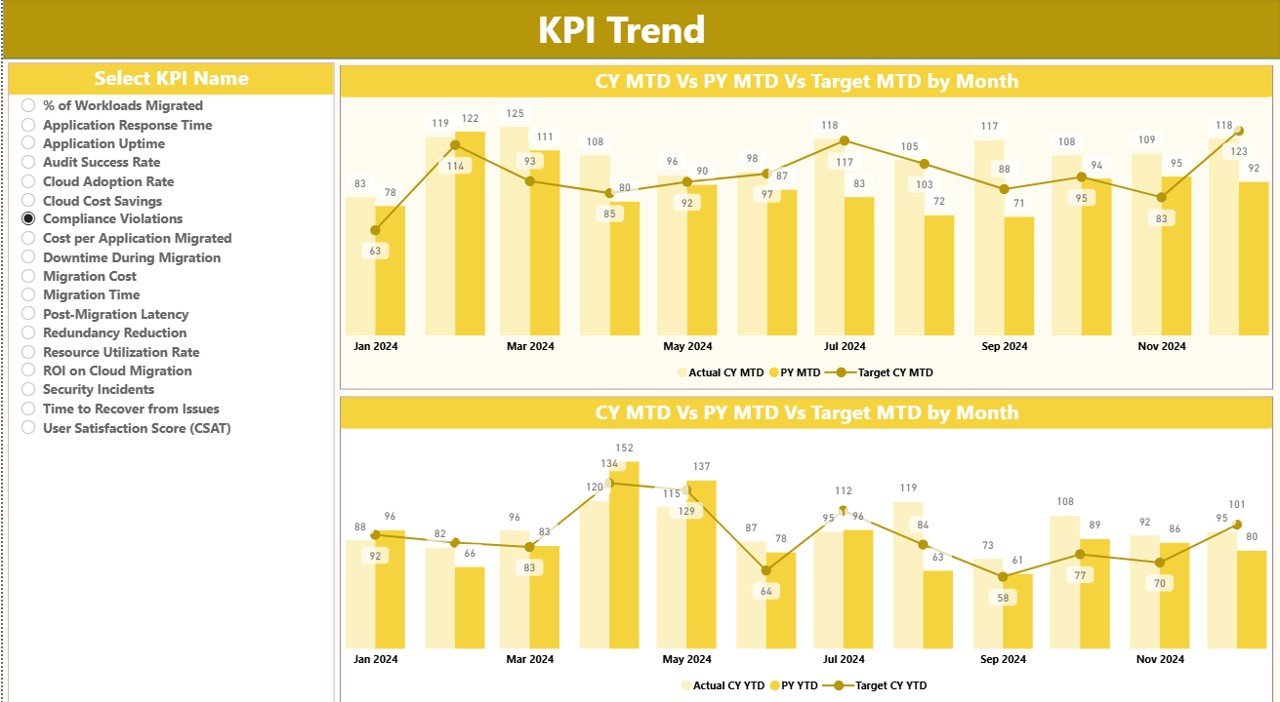
⭐ 2. KPI Trend Page – Compare Performance Over Time
The KPI Trend Page helps you track month-by-month KPI performance for deep insights.
This page includes:
-
MTD Trend combo chart
-
YTD Trend combo chart
-
Current Year Actual
-
Previous Year Actual
-
Target Values
-
Slicer to select any KPI
Once you choose a KPI, both charts update instantly. This helps you understand long-term patterns, performance gaps, and improvement areas.
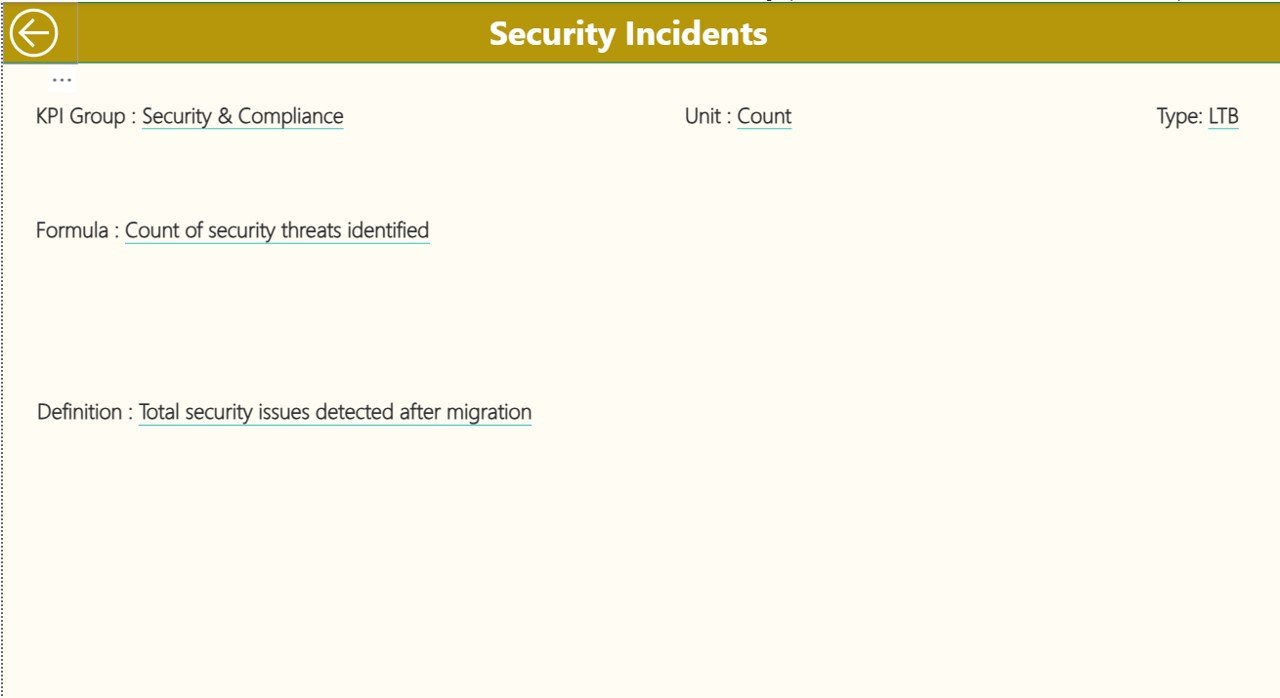
⭐ 3. KPI Definition Page – Understand Every KPI Clearly
This is a hidden drill-through page designed for clarity and transparency.
It displays:
-
KPI Number
-
KPI Name
-
KPI Group
-
Unit
-
Formula
-
Definition
-
KPI Type (UTB or LTB)
This page is extremely helpful for managers, auditors, and teams who need a detailed explanation of KPI logic.
🛠️ How to Use the Cloud Migration KPI Dashboard in Power BI
This dashboard is powered by an Excel data source with three structured sheets.
1. Input_Actual Sheet:
Enter:
➡️ KPI Name
➡️ Month
➡️ MTD Values
➡️ YTD Values
2. Input_Target Sheet:
Add:
➡️ KPI Name
➡️ Monthly Target Values (MTD & YTD)
3. KPI Definition Sheet:
Fill:
➡️ KPI Number
➡️ KPI Group
➡️ KPI Name
➡️ Unit
➡️ Formula
➡️ Definition
➡️ KPI Type
Once you update these sheets, Power BI refreshes automatically with one click.
👥 Who Can Benefit from This Cloud Migration KPI Dashboard in Power BI
☁️ Cloud Migration Teams
Monitor readiness, completion, data transfer speed, and improvement areas.
🛡️ Security Teams
Track compliance, risks, and security incidents.
💰 Finance Teams
Review cost savings, cloud spend variance, and ROI.
🏗️ IT Infrastructure Teams
Monitor downtime, system quality, and performance post-migration.
📅 Project Managers & Directors
Use real-time KPIs for planning, reporting, and stakeholder updates.
📊 Leadership Teams
Get a complete, simplified view of cloud transformation performance.
This dashboard is suitable for startups, enterprise companies, IT consultancies, and organisations managing large-scale cloud transitions.
### 📘 Click here to read the Detailed Blog Post
### 📺 Visit our YouTube channel to learn step-by-step video tutorials:
👉 Youtube.com/@PKAnExcelExpert


Reviews
There are no reviews yet.