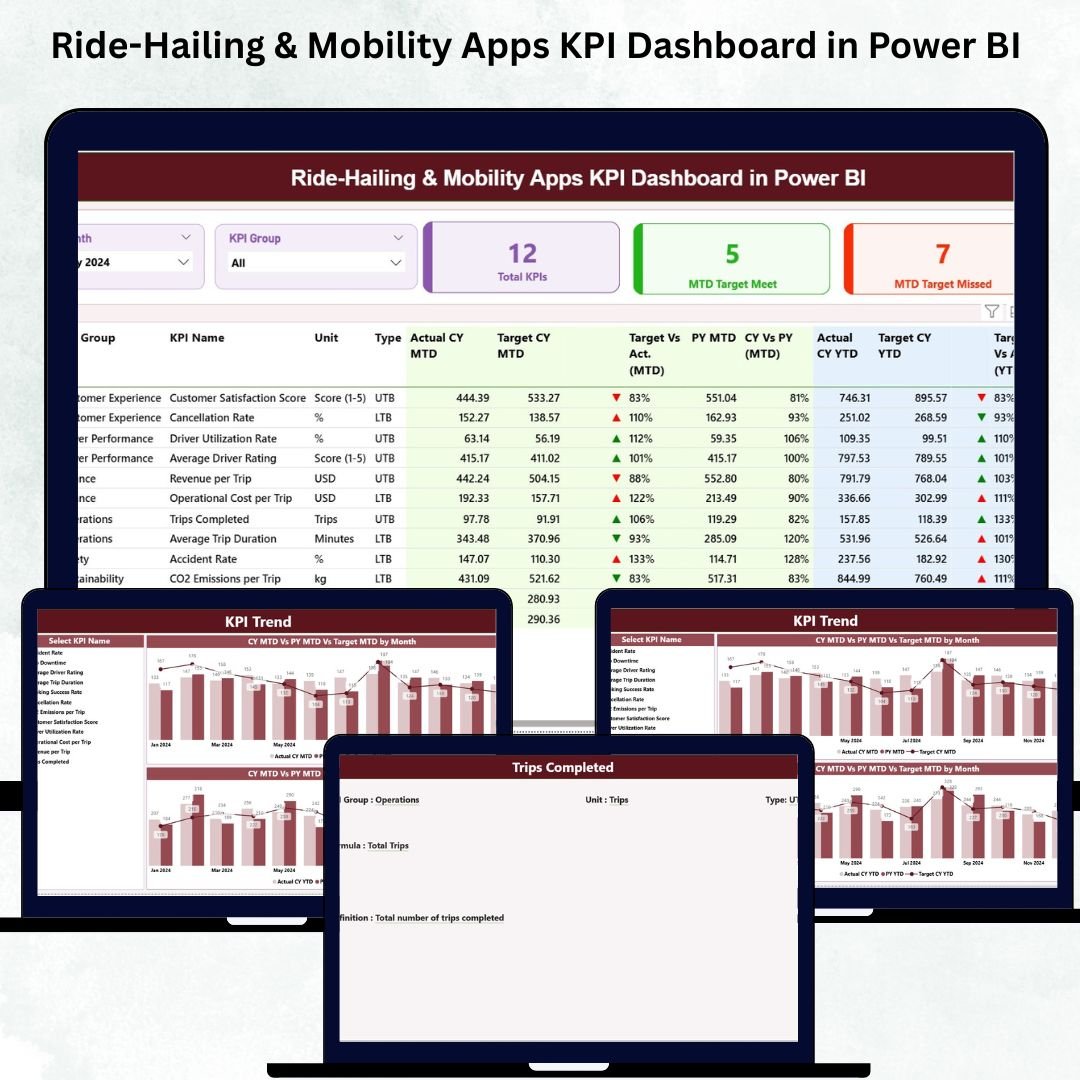
The ride-hailing and mobility services industry is growing at a rapid pace. With millions of daily trips, dynamic pricing, customer ratings, and vehicle performance metrics, businesses must track every detail to stay competitive. However, most teams still rely on scattered spreadsheets, manual reports, or outdated dashboards—which slows decisions and hides critical insights. That’s why the Ride-Hailing & Mobility Apps KPI Dashboard in Power BI is a game-changing solution for fast-moving mobility companies.
This ready-to-use dashboard brings clarity, speed, and accuracy to your performance tracking. It converts Excel data into interactive Power BI visuals so you can monitor operations in real time. Whether you handle taxis, autos, bikes, shared rides, or mobility super apps—this dashboard gives you a complete 360-degree view of your business performance.
🚀 Key Features of the Ride-Hailing & Mobility Apps KPI Dashboard in Power BI
This dashboard includes everything mobility businesses need to measure performance with precision:
📊 ✔ Real-Time Operational Insights
Track MTD, YTD, PY, and Target values instantly to understand business progress.
🎯 ✔ Smart KPI Cards
View Total KPIs, MTD Target Met, and MTD Target Missed at a glance—perfect for daily monitoring.
🔍 ✔ Detailed KPI Table
Analyze everything from trip count to customer ratings with clean fields like KPI number, unit, type (UTB/LTB), actual values, targets, trends, and status icons (▲▼).
📅 ✔ Powerful Slicers
Use the Month and KPI Group slicers to filter insights instantly—Revenue KPIs, Trip KPIs, Customer KPIs, Vehicle KPIs, and more.
📈 ✔ Trend Analytics Page
Visualize MTD and YTD trends with combo charts showing Current Year, Previous Year, and Target values.
📝 ✔ Drill-Through KPI Definitions
Right-click any KPI to view its formula, definition, type, and meaning—ideal for analysts and new team members.
⚡ ✔ Auto-Refresh from Excel
Just update the Excel sheets and the entire dashboard refreshes automatically.
📦 What’s Inside the Ride-Hailing & Mobility Apps KPI Dashboard
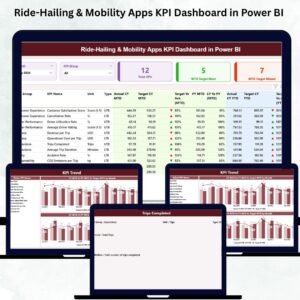
Your download includes a complete dashboard file designed with three powerful pages:
⭐ 1. Summary Page
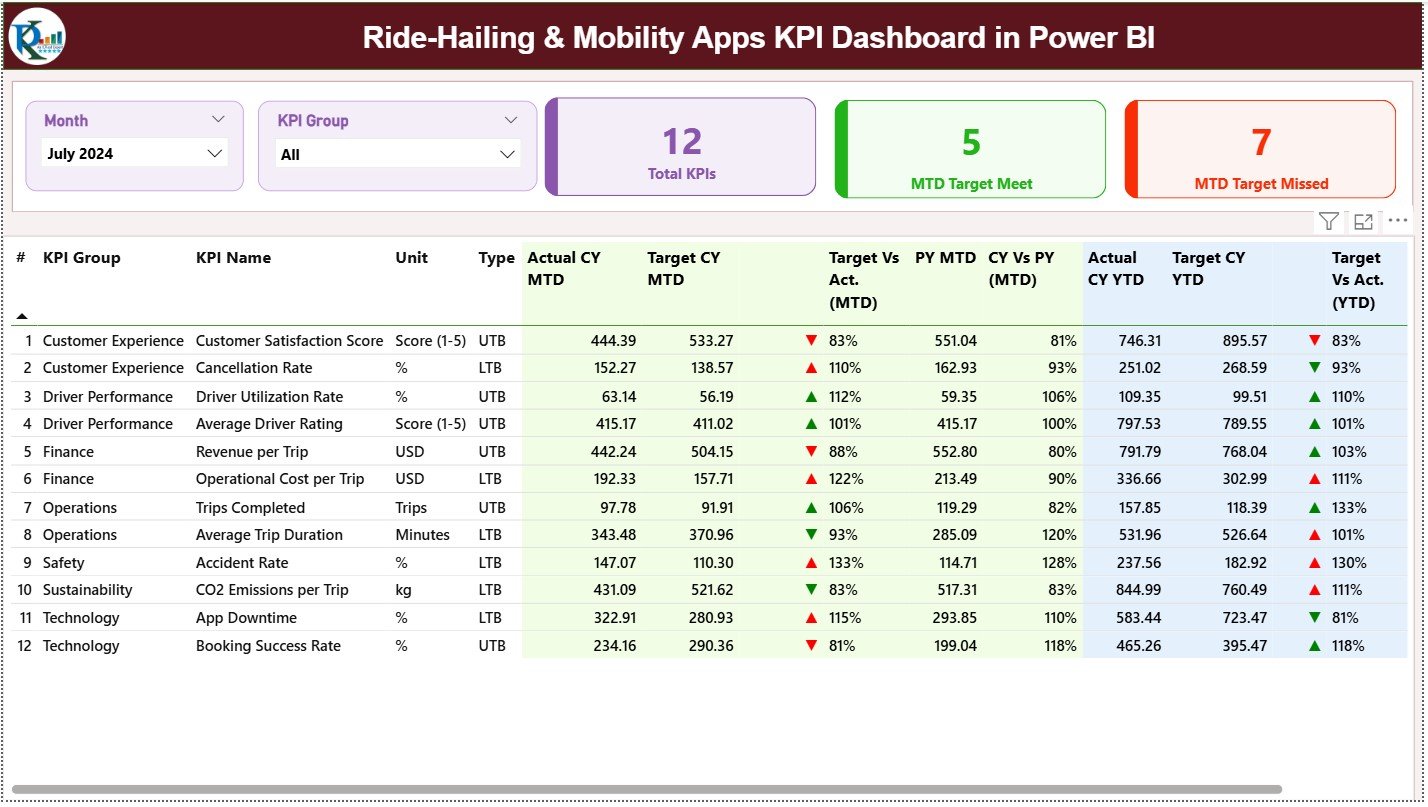
✔ Month & KPI Group slicers
✔ KPI cards for instant performance overview
✔ Detailed KPI table with CY, PY, and Target comparisons
✔ MTD & YTD status icons for immediate insights
✔ Growth comparisons through CY vs PY metrics
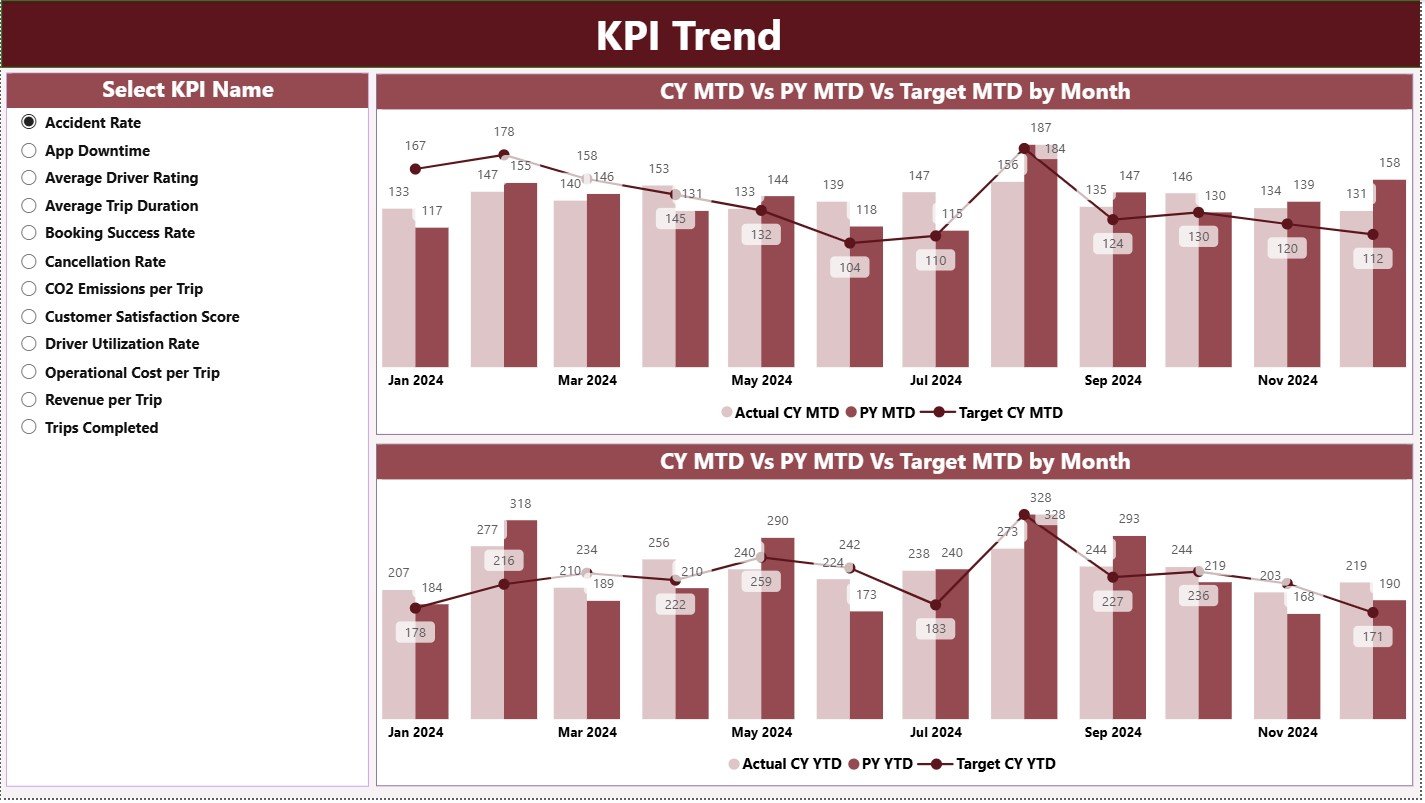
⭐ 2. KPI Trend Page
✔ Select any KPI from the slicer
✔ View month-wise performance
✔ Combo charts for CY, PY, and Target lines
✔ Both MTD and YTD trend visuals
This page helps identify patterns like rising cancellations, decreasing fares, or trip fluctuations.
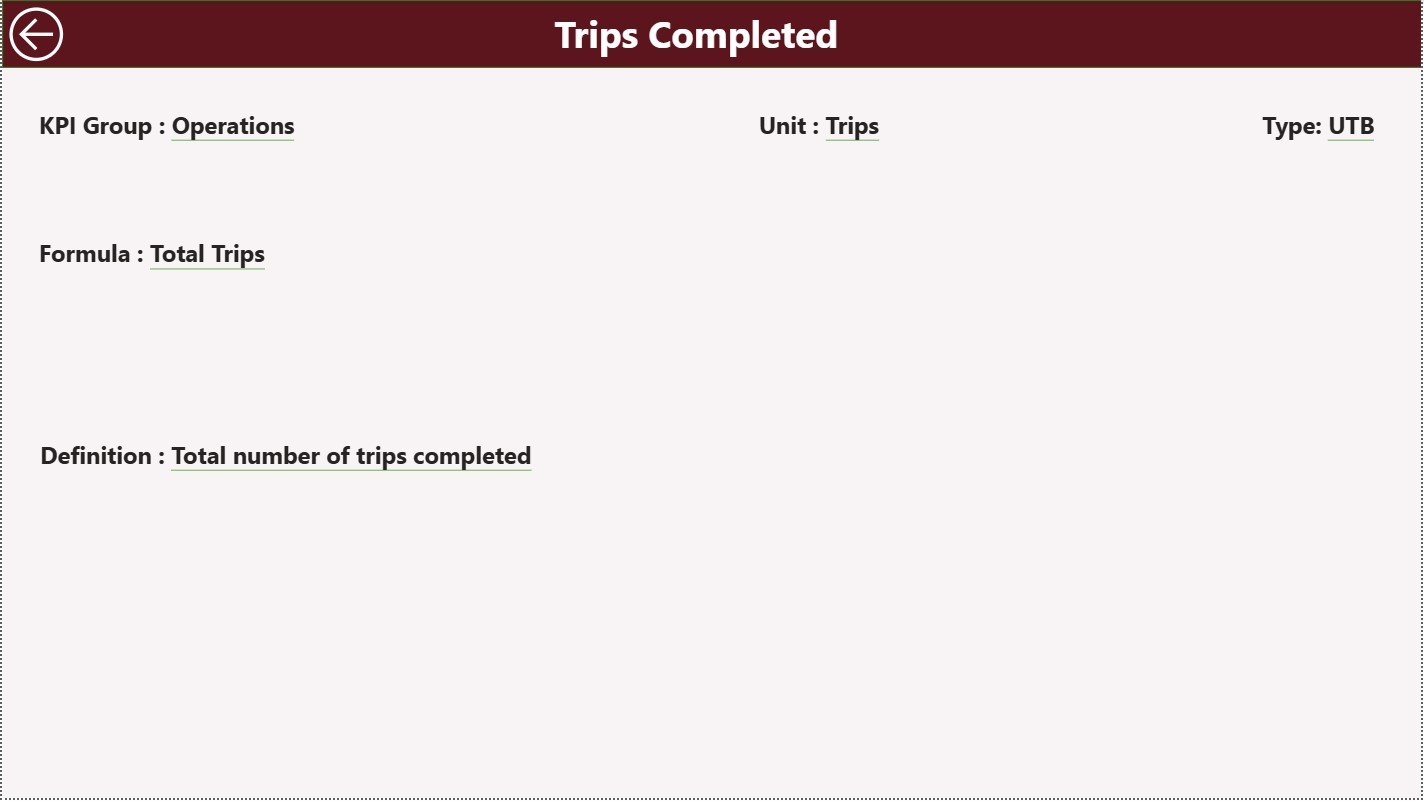
⭐ 3. KPI Definition Page (Drill-through)
✔ KPI name, number, group, unit
✔ Formula and short definition
✔ KPI type (UTB / LTB)
✔ Back button to return to Summary Page
This page ensures clarity for reporting teams.
⭐ Excel Data Templates Included
You will receive three structured Excel sheets:
✔ Input Actual
✔ Input Target
✔ KPI Definition
Simply enter your data → click refresh → dashboard updates instantly.
🧭 How to Use the Ride-Hailing KPI Dashboard
Using this dashboard is extremely simple and effective:
🔹 Step 1: Fill Excel Data
Enter trip, fare, rating, promo, or operational KPIs.
🔹 Step 2: Open Power BI & Refresh
The dashboard loads your MTD, YTD, and PY performance automatically.
🔹 Step 3: Use Slicers for Insights
Filter month, KPI group, customer type, or revenue type instantly.
🔹 Step 4: Analyze Trends
Use combo charts to track growth, decline, or stability.
🔹 Step 5: Drill Through for Definitions
Understand KPI meaning and formulas instantly.
🔹 Step 6: Take Action
Improve cancellations, pricing strategies, trip efficiency, and customer experience.
👥 Who Can Benefit from This Dashboard
This dashboard is ideal for any mobility platform, including:
🚗 Ride-Hailing Companies
Track trip volume, cancellations, on-time pickup, and fare insights.
🛵 Two-Wheeler Taxi Businesses
Monitor per-trip earnings, trip duration, and driver behavior.
🚕 Taxi Operators & Aggregators
Analyze revenue, surge trips, customer ratings, and promo usage.
🚙 Fleet & Vehicle Management Teams
Track fleet productivity, utilization, and operational KPIs.
📊 Business Leaders & Analysts
Receive a clear daily, weekly, and monthly performance view for strategic decisions.
This dashboard simplifies reporting, boosts productivity, and ensures data-driven improvement across your mobility operations.


Reviews
There are no reviews yet.