



Running a call center requires speed, accuracy, and complete visibility. Your team handles hundreds or thousands of calls every day—managing customer queries, solving issues, closing sales, and maintaining service quality. But when you rely on manual reports, scattered files, or outdated spreadsheets, it becomes almost impossible to track performance in real time. That’s exactly why we created the Call Center Operations KPI Dashboard in Excel—a powerful, ready-to-use dashboard designed to transform the way call centers measure and improve performance.
This dashboard brings all essential KPIs into one automated, interactive, and visually engaging Excel interface. With dynamic drop-downs, smart formulas, and real-time visual updates, managers can make faster decisions, analyze trends, and improve agent accountability without spending hours in manual reporting.
Whether you’re tracking customer satisfaction, call volumes, response times, or agent efficiency, this dashboard gives you everything you need in one place. It’s simple, easy to customize, and requires zero coding skills—perfect for teams of all sizes.Call Center Operations KPI Dashboard in Excel.
🟦 Key Features of the Call Center Operations KPI Dashboard in Excel
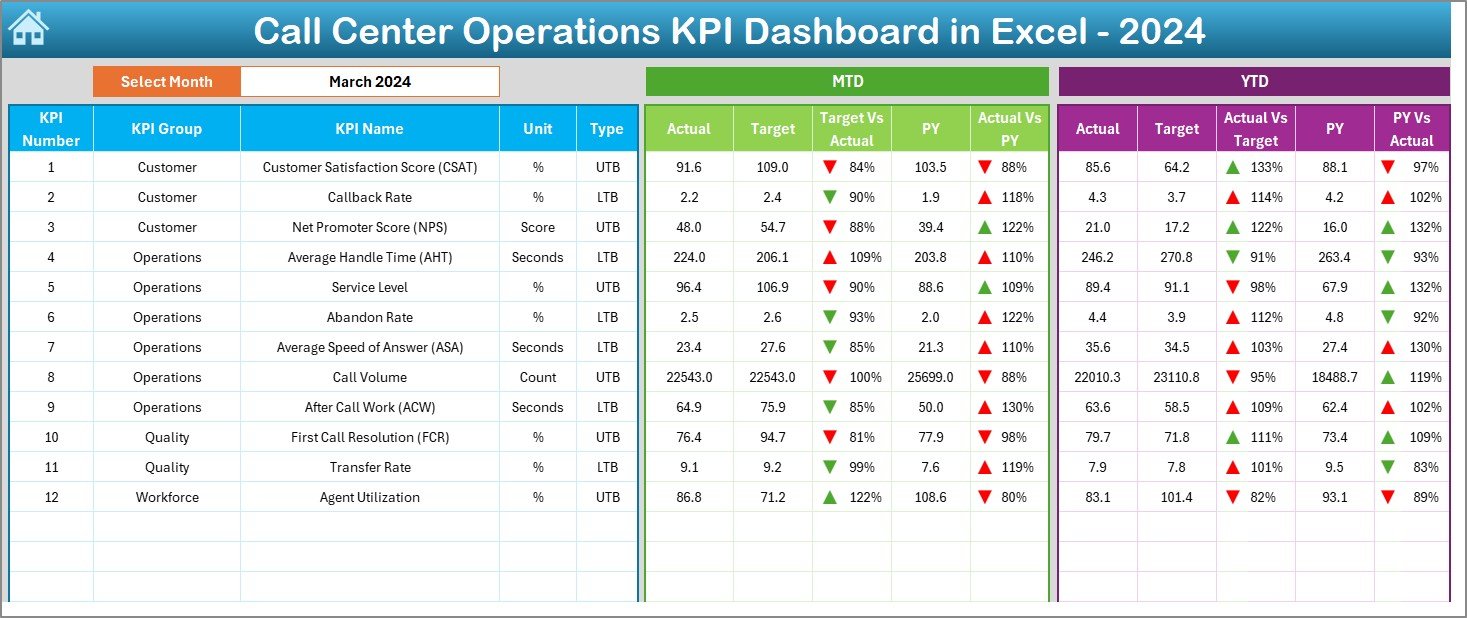
✨ Dynamic Month Selector – Choose any month from the drop-down menu and instantly see updated MTD & YTD performance.
📊 Complete KPI Overview – Track AHT, FCR, CSAT, SLA %, Call Volume, Abandon Rate, and more in one view.
📈 MTD & YTD Trend Charts – Compare actual, target, and previous-year performance for deeper insights.
🔽🔼 Conditional Formatting Arrows – Instantly identify performance improvements and drop-offs.
📁 Seven Organized Worksheets – Smooth navigation and well-structured reporting for leadership use.
⚙️ Automated Calculations – No formulas to edit; simply update input sheets and the dashboard refreshes.
📚 Built-in KPI Dictionary – Understand KPI definitions, groups, and formulas clearly.
📦 What’s Inside the Call Center Operations KPI Dashboard in Excel
This professionally designed dashboard includes 7 key sheets:
1️⃣ Summary Page – Navigation hub with buttons to quickly jump between sheets.
2️⃣ Dashboard Page – Main KPI dashboard with MTD/YTD insights and target comparisons.
3️⃣ Trend Analysis Page – Select a KPI and view detailed historical trends.
4️⃣ Actual Numbers Input Sheet – Enter monthly actual performance.
5️⃣ Target Sheet – Input MTD & YTD targets for every KPI.
6️⃣ Previous Year Sheet – Add PY data for long-term comparison.
7️⃣ KPI Definition Sheet – Complete glossary of all KPIs used in the dashboard.
Each sheet is built with intelligence and simplicity, ensuring even beginner-level Excel users can operate it easily.
🛠️ How to Use the Call Center Operations KPI Dashboard in Excel
Using this dashboard is extremely simple:
📝 Step 1: Enter actual monthly numbers in the Actual Numbers sheet.
🎯 Step 2: Update targets in the Target Sheet.
📅 Step 3: Add previous year numbers once.
📉 Step 4: Go to the Dashboard page and select a month from the drop-down.
📊 Step 5: View auto-generated charts, KPI comparisons, and arrows.
📈 Step 6: Use the Trend Page to study performance over time.
With these steps, you can instantly generate reports for leadership meetings, weekly reviews, or monthly performance audits.Call Center Operations KPI Dashboard in Excel
👥 Who Can Benefit from This Call Center Operations KPI Dashboard in Excel
This dashboard is perfectly designed for:
👨💼 Call Center Managers – Monitor performance and improve SLAs.
👩💼 Team Leaders – Track agent productivity and spot training needs.
🎧 Customer Support Supervisors – Improve response times and resolution rates.
📞 BPO & Outsourcing Companies – Manage multiple teams effortlessly.
📊 Operations & Quality Teams – Analyze trends and refine processes.
🏢 Small, Medium & Large Call Centers – Suitable for all business sizes.
Anyone handling customer calls, support functions, or tele-operations can benefit from this ready-to-use KPI dashboard.
### Click here to read the Detailed blog post
Which call center dashboard is right for you?
We have two different call center dashboards in Excel. They answer different questions, so pick the one that matches the data you have:
| Call Center Operations KPI Dashboard | Call Center Operations Dashboard | |
|---|---|---|
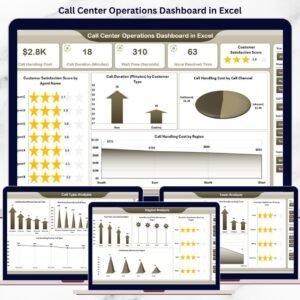
| Best for | The monthly KPI review against targets and last year (AHT, FCR, CSAT, SLA %, call volume, abandon rate and more) | Digging into your call log by agent, team, call type, region and month |
| Data you enter | Monthly totals per KPI: actuals, targets and previous-year figures | One row per call: agent, team, customer type, channel, call type, region, duration, wait time, handling cost, resolution time and satisfaction score |
| Pages | 7 sheets: Summary, Dashboard, Trend Analysis, Actual Numbers, Target, Previous Year and KPI Definitions | 5 analysis pages (Overview, Team, Call Type, Region, Month) plus the Data sheet |
| How you filter | A month drop-down with MTD and YTD views, and up/down arrows against target and previous year | Slicers for agent, team, call type, region and month |
| Targets and previous year | Yes | No – it analyses actual call data |
Many call centers use both: the Operations Dashboard to analyse the call log and the KPI Dashboard for the monthly management review. Also available as the KPI Dashboard in Power BI, the Operations Dashboard in Power BI and the Operations Dashboard in Google Sheets.
Watch the step-by-step video tutorial:
Visit our YouTube channel for tutorials: Youtube.com/@PKAnExcelExpert
Compatibility and Requirements
- Works in Microsoft Excel desktop (Excel 2016 or later, or Microsoft 365).
- The month selector is a dropdown list. Microsoft explains dropdowns in Create a drop-down list.
Frequently Asked Questions
Which KPIs does the dashboard track?
AHT, FCR, CSAT, SLA %, call volume, abandon rate and more.
How do I change the month?
Pick a month from the dropdown on the Dashboard page. The MTD and YTD figures and charts update.
Where do I enter my numbers?
Enter actuals in the Actual Numbers sheet, targets in the Target sheet and last year’s figures in the Previous Year sheet.
How does it show good or bad results?
Conditional formatting arrows show gains and drops against target and previous year.
Where are the KPI definitions?
The KPI Definition sheet lists each KPI with its group, formula and definition.
More Call Center and Support Templates
- Call Center KPI Dashboard in Google Sheets: call center KPIs in Google Sheets
- Call Center KPI Scorecard in Google Sheets: a scorecard view in Google Sheets
- Customer Support SLA KPI Dashboard in Excel: tracks support SLAs
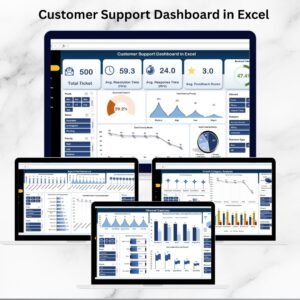
- Customer Support Dashboard in Excel: a support ticket dashboard
- KPI Dashboard Library (Excel): 15 Excel KPI dashboards in one bundle
Browse all Excel KPI dashboards or the Excel operations templates.






Reviews
There are no reviews yet.