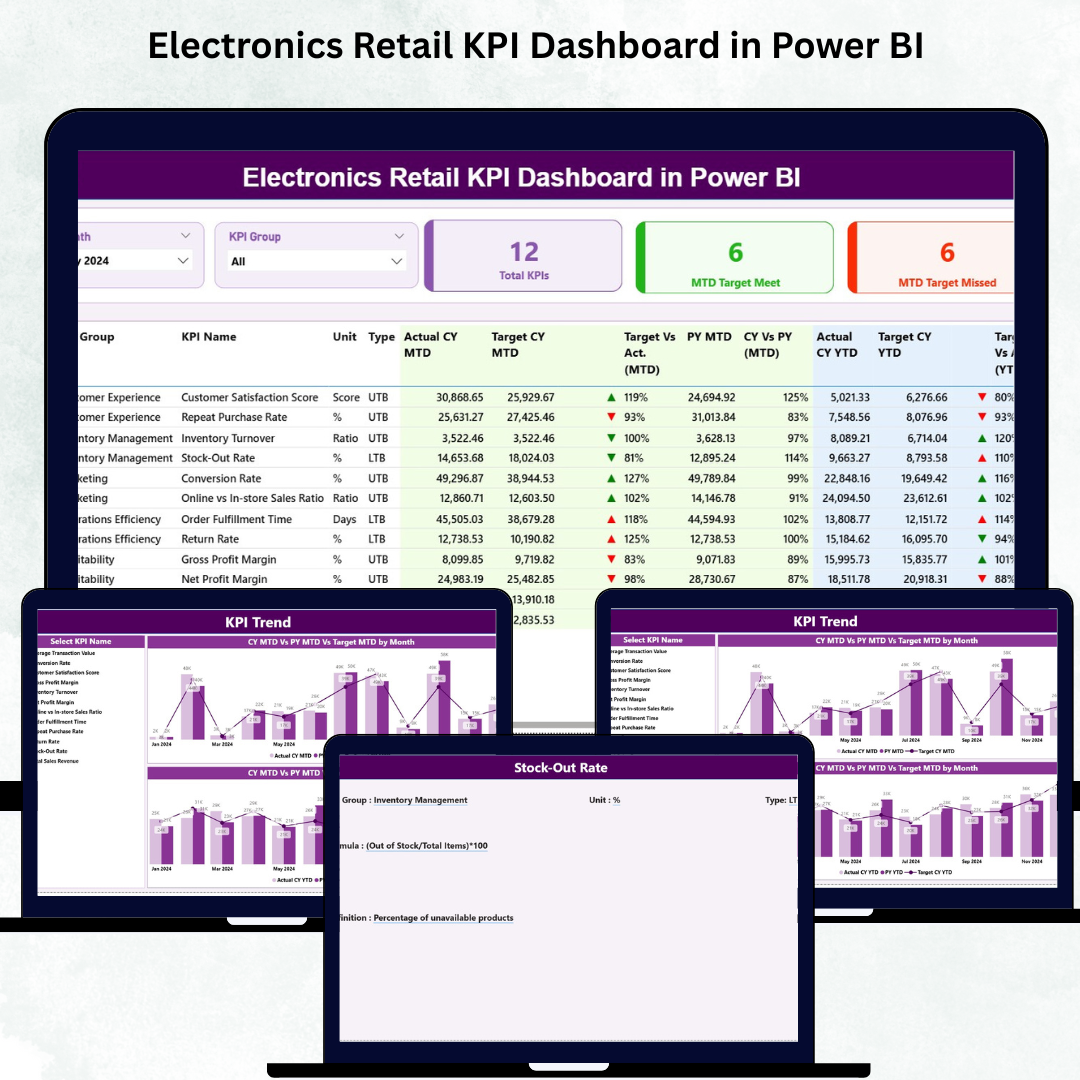
The electronics retail industry moves fast — new launches, fluctuating prices, competitor promotions, return challenges, and customer behavior shifts all happen daily. In such a dynamic environment, retailers must analyze performance quickly and take decisions confidently. That’s exactly why the Electronics Retail KPI Dashboard in Power BI was created. It gives you a complete view of sales, customer experience, store efficiency, and operational performance — all in one interactive, visual, and intelligent dashboard.
This ready-to-use dashboard transforms raw Excel data into meaningful insights. Whether you want to track category-wise sales, reduce return rates, monitor store performance, or measure customer satisfaction, this dashboard makes everything simple, clear, and fast. With slicers, charts, icons, drill-through insights, and automated calculations, your decision-making becomes stronger than ever.
⭐ Key Features of the Electronics Retail KPI Dashboard in Power BI
✨ Interactive Summary Page – View all KPIs in one place
📊 MTD & YTD Analysis – Track current month & yearly progress
📈 Trend Charts – Compare CY, PY & Target values
🎯 Target vs Actual Insights – Identify KPIs met & KPIs missed
🔍 KPI Drill-Through Page – Understand KPI formula, logic & definition
⚡ Auto Refresh with Excel – Update data → Refresh → Dashboard updated
🏬 Category, Store & Customer Insights – Make smarter retail decisions
✔️ Beginner-Friendly Structure – No coding, no complex setup
This dashboard is ideal for any retailer who wants accuracy, speed, and clarity in performance reporting.
📦 What’s Inside the Electronics Retail KPI Dashboard in Power BI
This dashboard includes three professionally designed analytical pages, each serving a unique purpose.
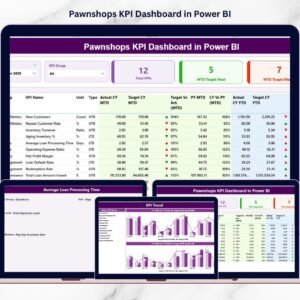
🔹 1. Summary Page – Your Main Control Center
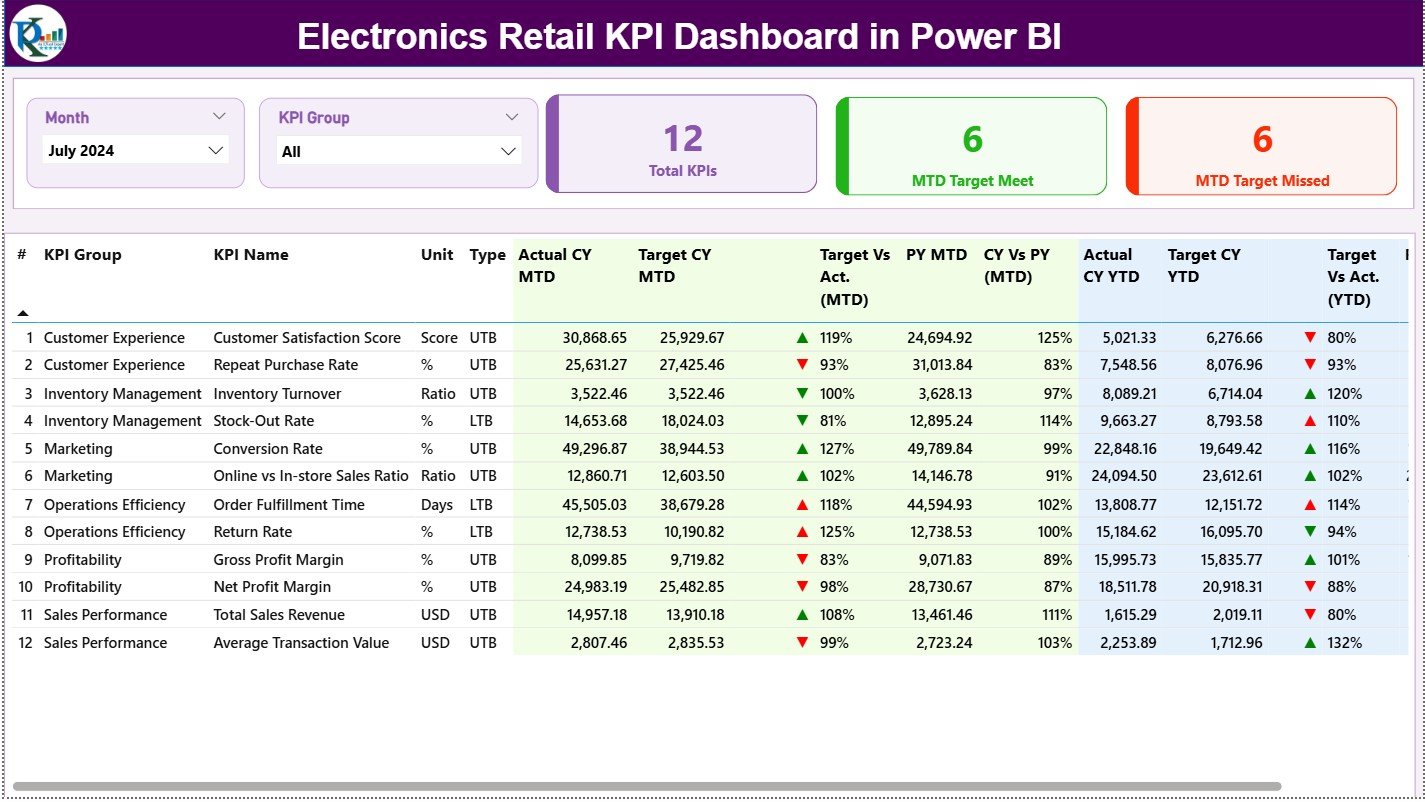
The Summary Page is the heart of the dashboard. It gives you a complete snapshot of your electronics retail performance.
At the top, two slicers allow instant filtering:
-
Month Slicer
-
KPI Group Slicer
Switch between groups like Sales KPIs, Customer KPIs, Service KPIs, Store KPIs, and Operations KPIs.
Below these slicers, three smart KPI cards display:
-
Total KPIs Count
-
MTD Target Met
-
MTD Target Missed
This instantly shows whether the business is moving in the right direction.
The detailed KPI performance table gives everything you need:
-
KPI Number, Group, Name
-
Unit of measurement
-
Type: UTB or LTB
-
Actual CY MTD, Target CY MTD, MTD Icons
-
Target vs Actual (MTD) %
-
PY MTD & CY vs PY (MTD) %
-
Actual CY YTD, Target CY YTD
-
YTD Icons, YTD Achievement %
-
PY YTD & CY vs PY (YTD) %
This page becomes your daily performance dashboard for decision-making.
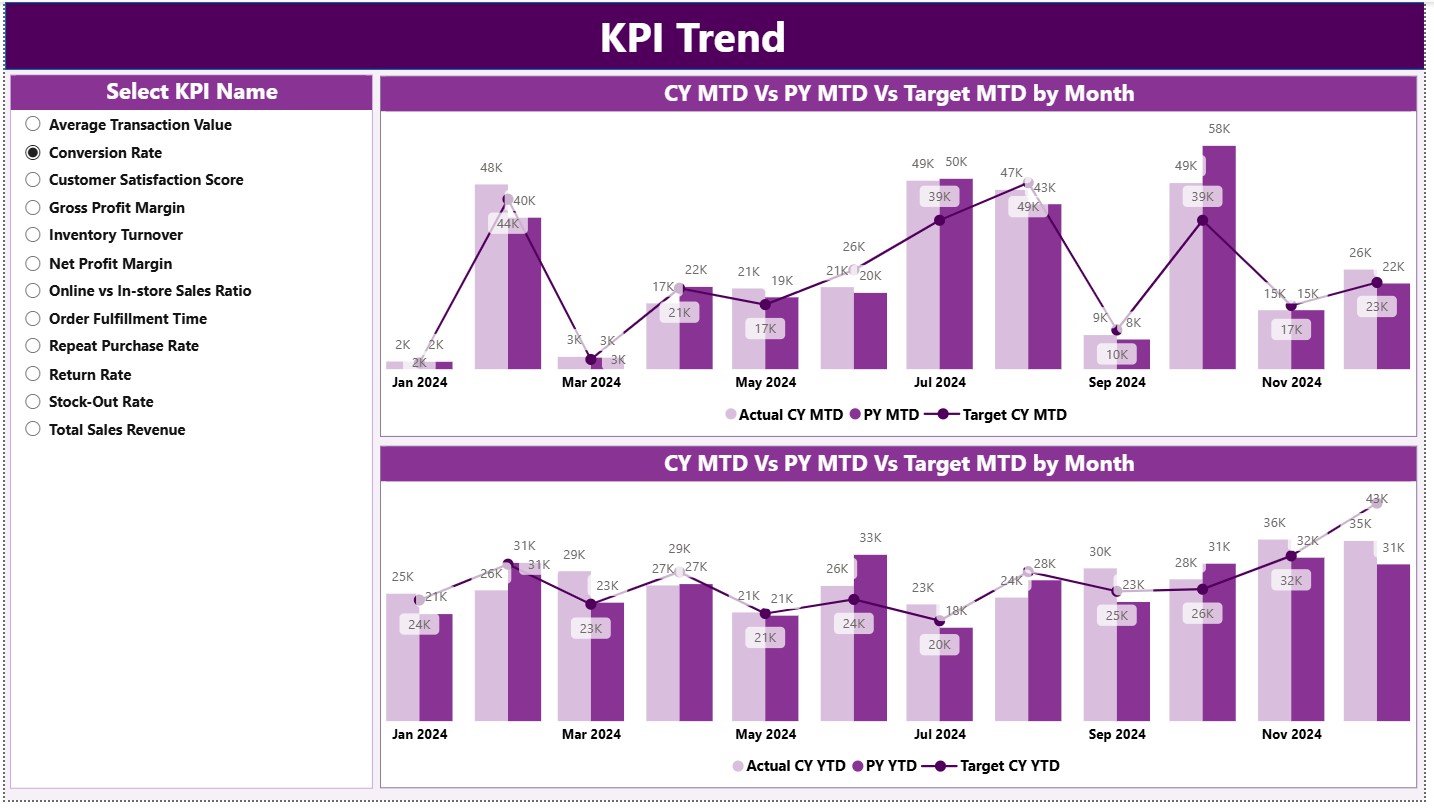
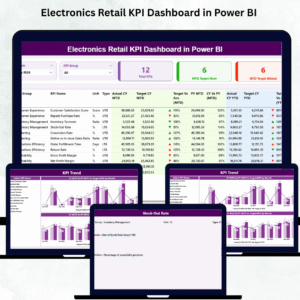
🔹 2. KPI Trend Page – Deep Performance Insights
The KPI Trend Page allows you to study performance patterns clearly.
Select any KPI using the slicer on the left and instantly view:
📈 MTD Trend Chart
– CY MTD
– PY MTD
– Target MTD
📉 YTD Trend Chart
– CY YTD
– PY YTD
– Target YTD
Use this page to understand seasonal behavior, forecast future sales, analyze customer trends, and plan inventory better.
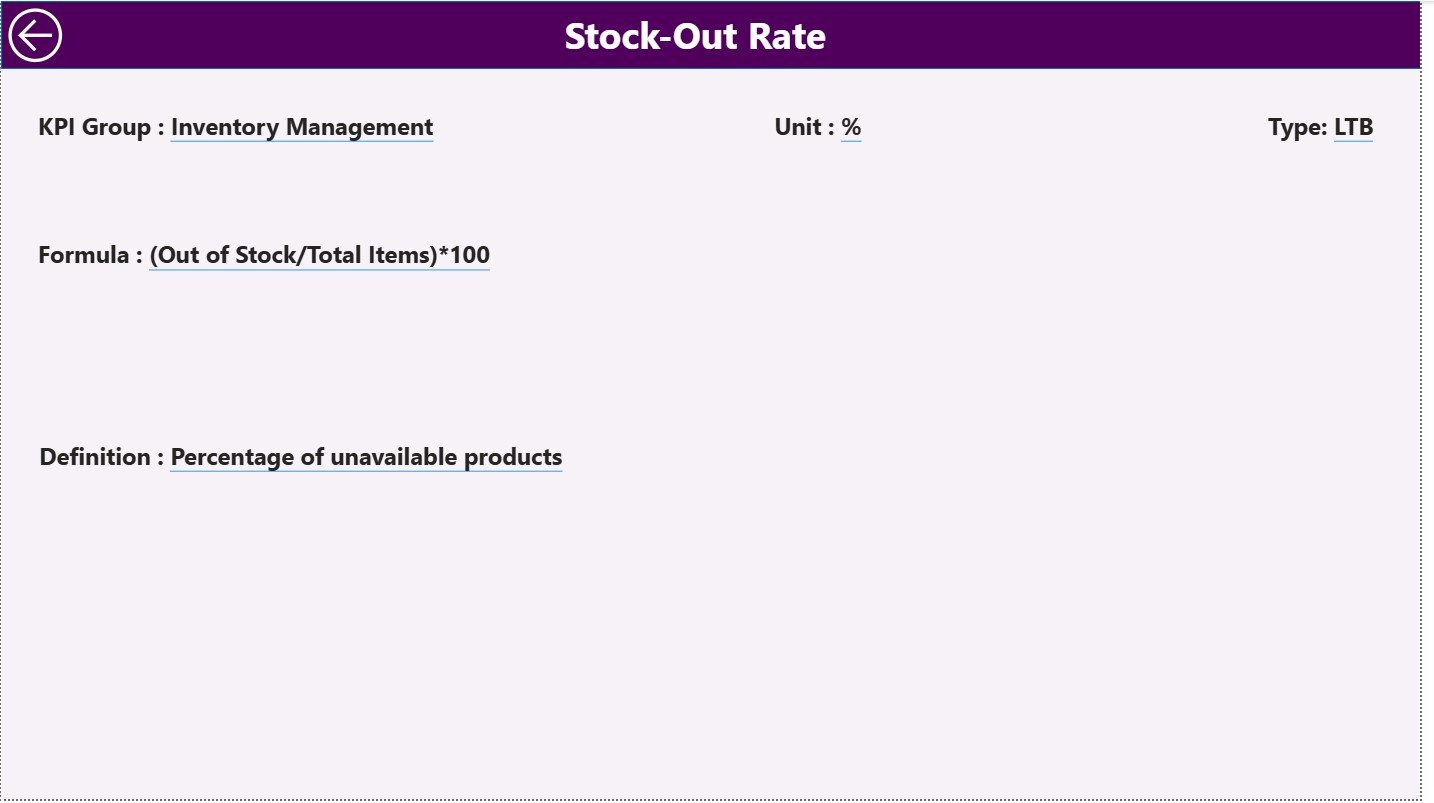
🔹 3. KPI Definition Page – Complete KPI Documentation
This drill-through page helps users understand KPI logic.
It contains:
-
KPI Number
-
KPI Group
-
KPI Name
-
Unit
-
Formula
-
KPI Definition
-
KPI Type (UTB/LTB)
Ideal for reporting, presentations, audits, and team training.
Click the “Back” button to return to the main page.
🛠️ How to Use the Electronics Retail KPI Dashboard
The dashboard runs entirely on Excel + Power BI. Just follow these steps:
-
Update the Input_Actual Sheet (MTD & YTD values).
-
Update the Input_Target Sheet (MTD & YTD targets).
-
Update the KPI Definition Sheet when adding new KPIs.
-
Open Power BI Desktop.
-
Click Refresh.
-
View updated insights instantly.
-
Use slicers to analyze by month or KPI group.
-
Drill through a KPI to view its definition.
No coding, no heavy BI setup — simple and fast.
👥 Who Can Benefit from This Dashboard?
🛒 Electronics Retail Chains – Multi-store, multi-category analysis
🏬 Store Managers – Daily dashboard for improvements
📊 Retail Analysts – Trend, forecasting & performance insights
📦 Category Managers – Track category contribution & performance gaps
⭐ Customer Experience Teams – Monitor satisfaction & return rates
💰 Business Owners – Quick visibility of performance health
🔍 Consultants – Deliver professional retail analytics to clients


Reviews
There are no reviews yet.