The chemical manufacturing industry demands accuracy, speed, safety, and flawless coordination. Even one small delay in production, quality checks, equipment operation, or material availability can impact efficiency and profitability. To stay competitive, chemical companies need a simple yet powerful tool that provides complete visibility over performance.
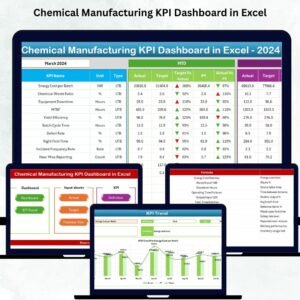
The Chemical Manufacturing KPI Dashboard in Excel is designed exactly for this purpose. This ready-to-use Excel dashboard brings all essential KPIs into one unified system, enabling teams to track production metrics, compare performance with targets, analyze trends, and improve decision-making — without any complex software or technical learning curve.
Whether you manage production, safety, equipment reliability, quality control, or supply chain operations, this dashboard gives you real-time insights that help you act faster, reduce risks, and boost operational efficiency.
⚡ Key Features of the Chemical Manufacturing KPI Dashboard in Excel
📊 Real-Time KPI Tracking
Track MTD (Month-to-Date) and YTD (Year-to-Date) performance across production, quality, safety, equipment, and supply chain KPIs.
🎯 Actual vs Target vs Previous Year Comparison
Instantly compare performance with targets and historical values using dynamic visuals and conditional formatting arrows (⬆️ improvement / ⬇️ decline).
📅 Monthly Selection for Automated Dashboard Refresh
Select any month from the dropdown in cell D3, and the entire dashboard updates instantly.
📉 Trend Analysis for Every KPI
View detailed MTD and YTD trend charts that help you discover patterns, forecast results, and identify improvement areas.
📁 Fully Structured Input Sheets
Separate sheets for Actuals, Targets, Previous Year, and KPI Definitions keep everything organized and easy to update.
🔄 Automatic Calculations
All KPIs are calculated automatically using formulas — no manual work or complex setup required.
🖱 Quick Navigation
The Summary Page provides clickable buttons to jump across sheets instantly, improving workflow speed.

📦 What’s Inside the Chemical Manufacturing KPI Dashboard in Excel
This dashboard contains 7 professionally designed worksheets, each serving a specific function:
1️⃣ Summary Page
Your quick navigation panel with clickable buttons for all sections.
2️⃣ Dashboard Sheet
The core visual dashboard showing all KPIs with Actual, Target, and Previous Year comparisons.
3️⃣ Trend Sheet
Select any KPI and explore its MTD and YTD trends with detailed charts.
4️⃣ Actual Numbers Input Sheet
Enter monthly MTD & YTD actuals in a clean, structured format.
5️⃣ Target Sheet
Add the monthly and yearly targets for every KPI.
6️⃣ Previous Year Sheet
Enter historical MTD & YTD values for year-over-year comparison.
7️⃣ KPI Definition Sheet
A complete list of KPI names, units, formulas, definitions, and type (UTB or LTB).
Everything updates automatically, making the dashboard user-friendly and fully automated.
🛠 How to Use the Chemical Manufacturing KPI Dashboard in Excel
✔ Step 1: Enter Actual Data
Go to the Actual Numbers Sheet and enter MTD & YTD values.
✔ Step 2: Update Targets
Use the Target Sheet to enter monthly & yearly goals.
✔ Step 3: Add Previous Year Data
Fill the Previous Year Sheet for accurate trend and performance comparison.
✔ Step 4: Select Month
Choose the reporting month from the dropdown in D3 on the Dashboard Sheet.
✔ Step 5: View Performance
Instantly see updated KPIs, trends, charts, and improvement areas.
✔ Step 6: Review Trends
Open the Trend Sheet, select a KPI from the dropdown, and analyze performance visually.
Within minutes, your entire performance report becomes ready — automated, accurate, and visually engaging.
👤 Who Can Benefit from This Chemical Manufacturing KPI Dashboard in Excel
This dashboard is ideal for:
🏭 Production Managers
To monitor batch cycle time, yield %, throughput, and process efficiency.
🧪 Quality Assurance Teams
To track defect rates, rework %, and first-pass yield.
🛡 Safety Officers
To monitor incident rate, LTIR, and safety compliance KPIs.
⚙️ Maintenance & Equipment Teams
To review downtime, OEE, and maintenance cost trends.
🚛 Supply Chain & Inventory Managers
To oversee raw material cost, inventory turnover, and order cycle time.
🧑💼 Plant Directors & Operations Heads
To get instant visibility and make quick, data-driven decisions.
📈 Continuous Improvement Teams
To analyze trends, identify bottlenecks, and reduce waste.
Any chemical manufacturing organization — regardless of size — can adopt this dashboard and transform the way they measure and manage performance.







Reviews
There are no reviews yet.