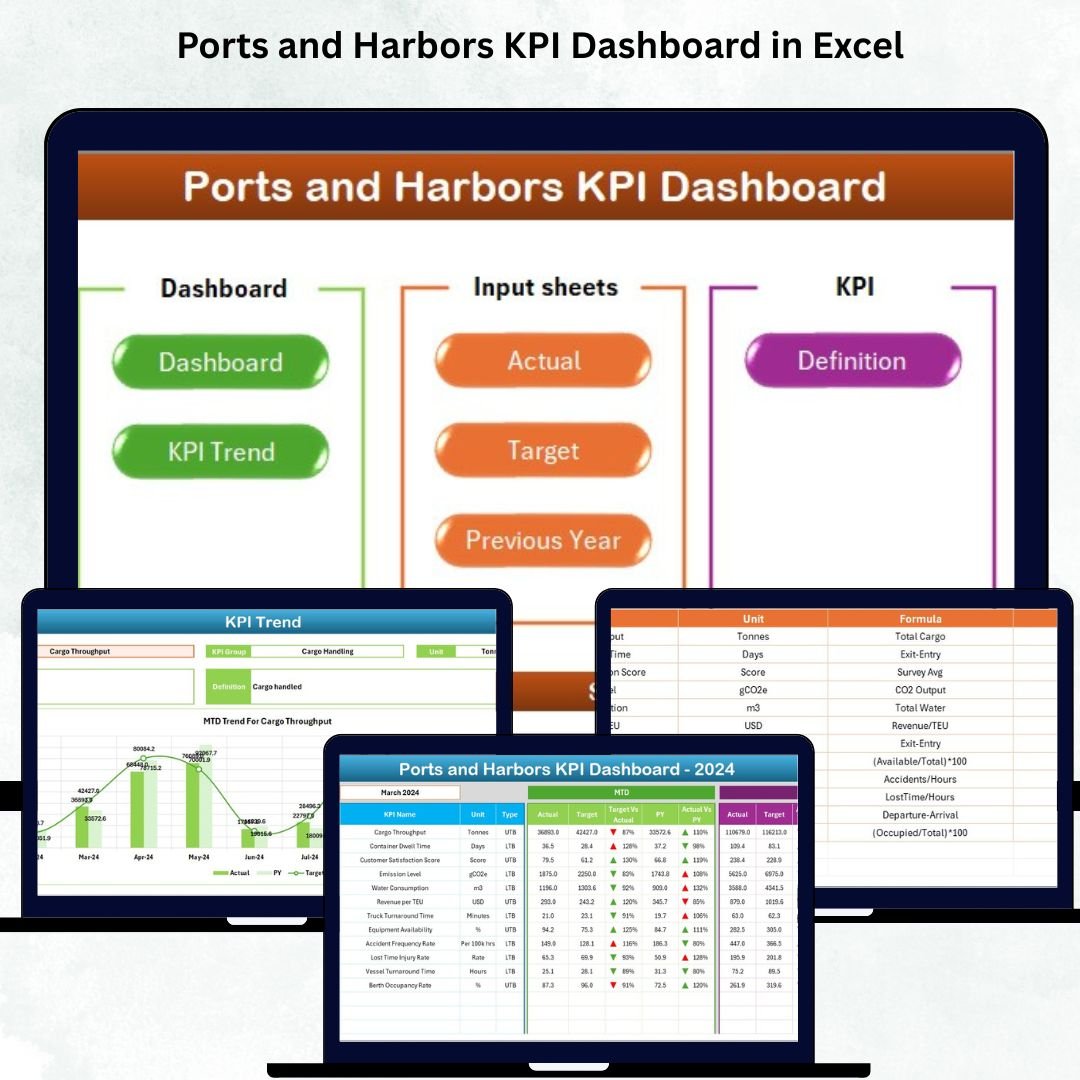
Ports and harbors operate in one of the most dynamic and demanding environments in the world. Vessel arrivals, cargo movements, berth operations, safety checks, inspections, and workforce activities shift by the hour — leaving no room for slow or unclear reporting. When teams rely on manual spreadsheets or scattered reports, delays increase, decisions slow down, and operational risks rise. That’s why the Ports and Harbors KPI Dashboard in Excel is the perfect solution for modern maritime performance management.
This ready-to-use Excel dashboard helps port authorities, harbor managers, logistics teams, terminal operators, and administrators monitor performance instantly. With structured data sheets, dropdown selectors, trend charts, KPIs, conditional icons, and a user-friendly dashboard layout, teams can analyze MTD, YTD, and PY performance in seconds. Whether you handle cargo handling, vessel scheduling, berth planning, safety operations, or compliance activities — this dashboard gives you complete visibility and faster decision-making power every day.
⭐ Key Features of the Ports and Harbors KPI Dashboard in Excel
✨ 7 Professionally Designed Worksheets
Each sheet plays a specific role — from navigation to KPI trends, data input, targeting, and definition management.
📊 Dynamic Dashboard with Automatic Updates
Select any month from a dropdown, and all KPI visuals refresh instantly.
📈 MTD & YTD Tracking with Clear Icons
Green ▲ icons signal good performance, while red ▼ icons highlight urgent issues.
🧭 Home Navigation Panel
Navigate effortlessly between dashboard pages with clean, clickable buttons.
📘 KPI Definition Sheet for Clarity
Every KPI includes group, unit, formula, definition, and type (UTB/LTB) to ensure clear understanding across teams.
📁 Excel-Based Data Entry
Enter Actuals, Targets, and Previous Year numbers directly in Excel tables — no coding, no formulas needed.
📉 Detailed Trend Charts
View both MTD and YTD historical patterns to identify delays, improvements, or operational gaps.
⚙️ Completely Customizable
Add KPIs, change formulas, update visuals — tailor the dashboard to your port’s exact needs.
⭐ What’s Inside the Ports and Harbors KPI Dashboard in Excel
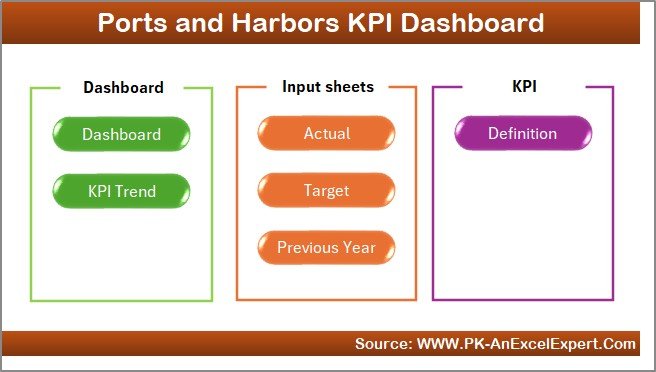
This dashboard includes seven powerful sheets, each designed to simplify reporting and analysis.
📌 1. Home Sheet – Your Navigation Hub
This sheet acts as the index page with navigation buttons linking to all other pages.
It helps beginners and advanced users move between sheets easily, improving user experience.
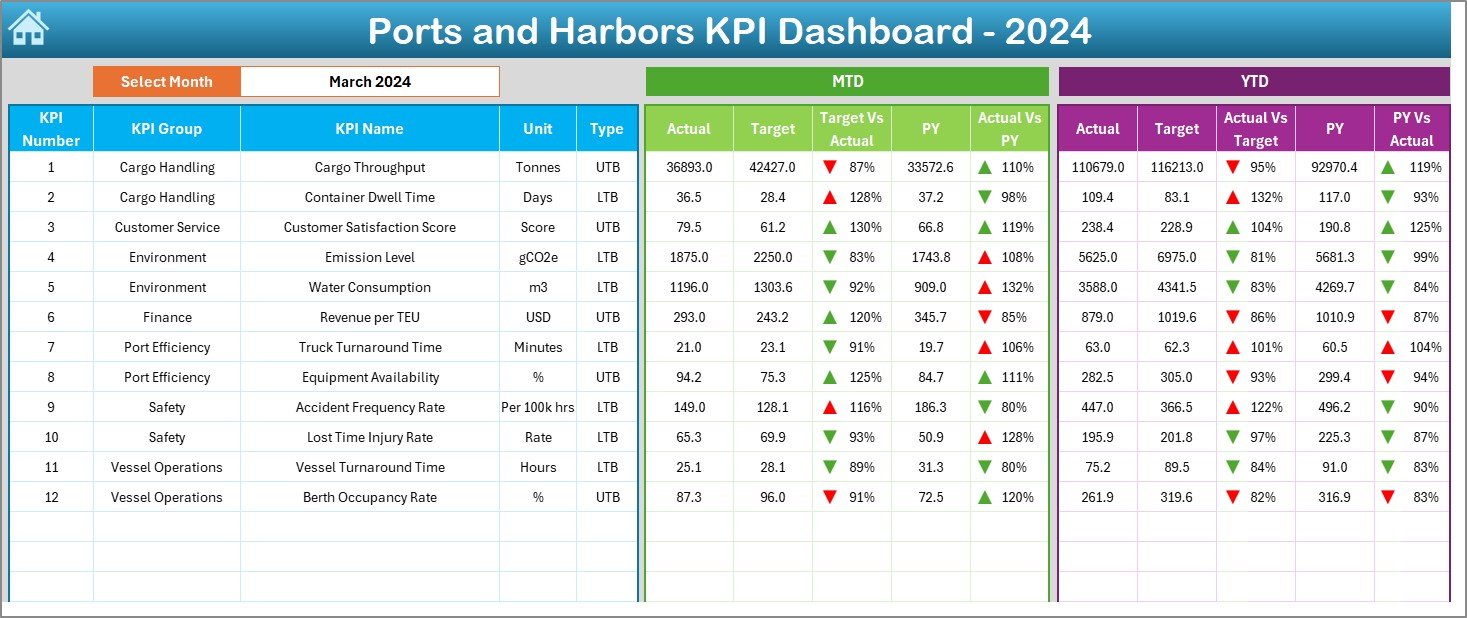
📌 2. Dashboard Sheet – Real-Time Performance Snapshot
The Dashboard sheet is the center of all analysis. Select the Month (cell D3) from the dropdown, and instantly view:
-
MTD Actual / Target / Previous Year
-
MTD Target vs Actual %
-
MTD Previous Year vs Actual %
-
YTD Actual / Target / Previous Year
-
YTD Target vs Actual %
-
YTD Previous Year vs Actual %
With color-coded arrows and visual highlights, you can quickly identify:
-
Vessel turnaround delays
-
Cargo handling performance
-
Berth utilization issues
-
Workforce productivity concerns
-
Safety and compliance KPIs
This page is perfect for monthly review meetings, operational analysis, and performance reporting.
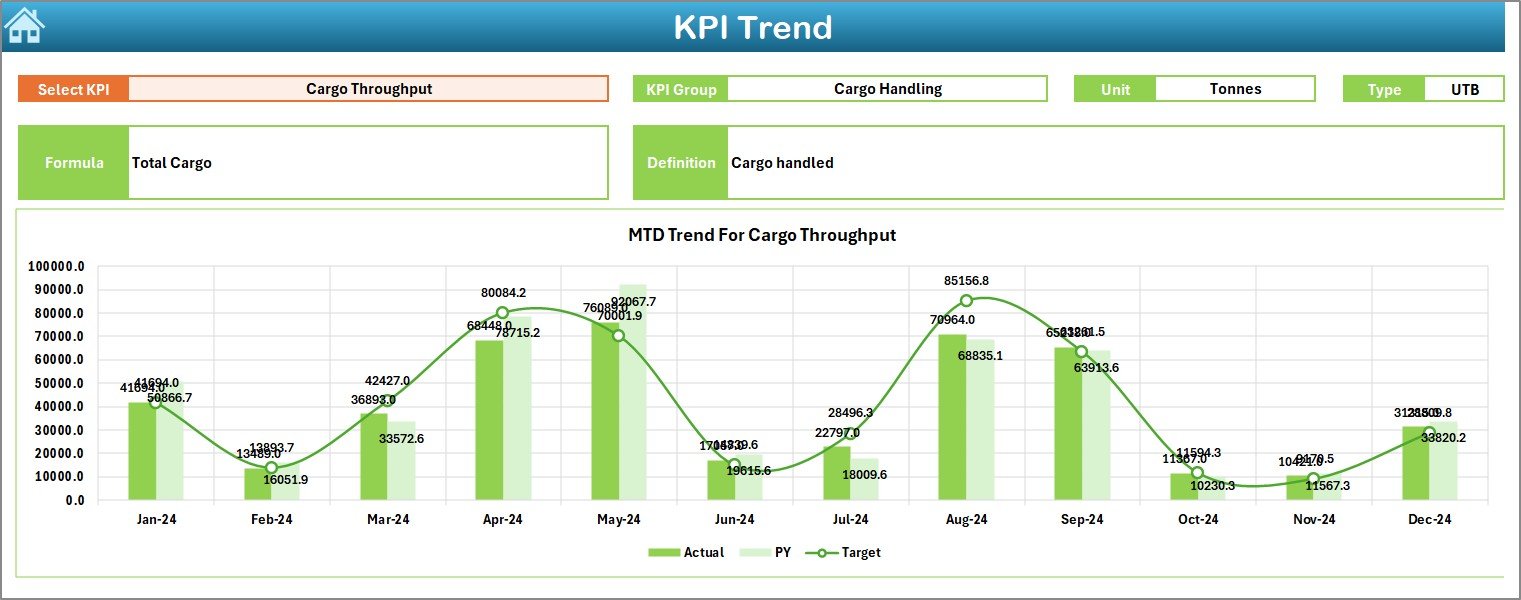
📌 3. KPI Trend Sheet – Track Performance Over Time
Use the dropdown (C3) to select any KPI and instantly view:
-
KPI Group
-
KPI Unit
-
KPI Type (LTB or UTB)
-
KPI Formula
-
KPI Definition
Below this section, two trend charts display:
📈 MTD Trend Chart
📉 YTD Trend Chart
Both charts show Actual, Target, and Previous Year progression, making it easy to detect patterns, seasonal shifts, or performance gaps.
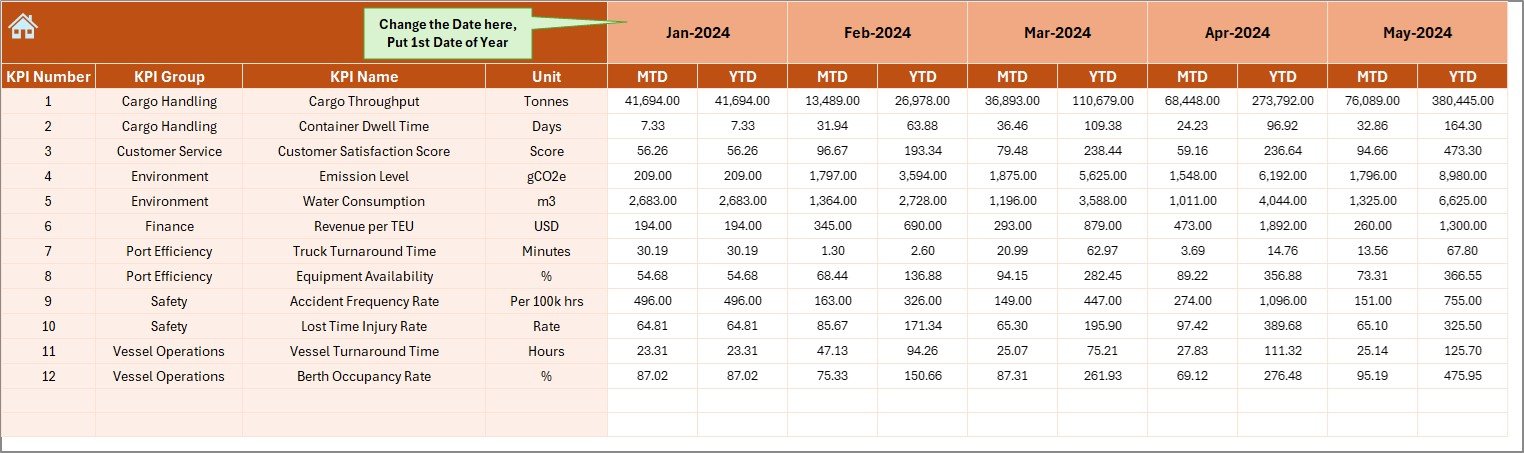
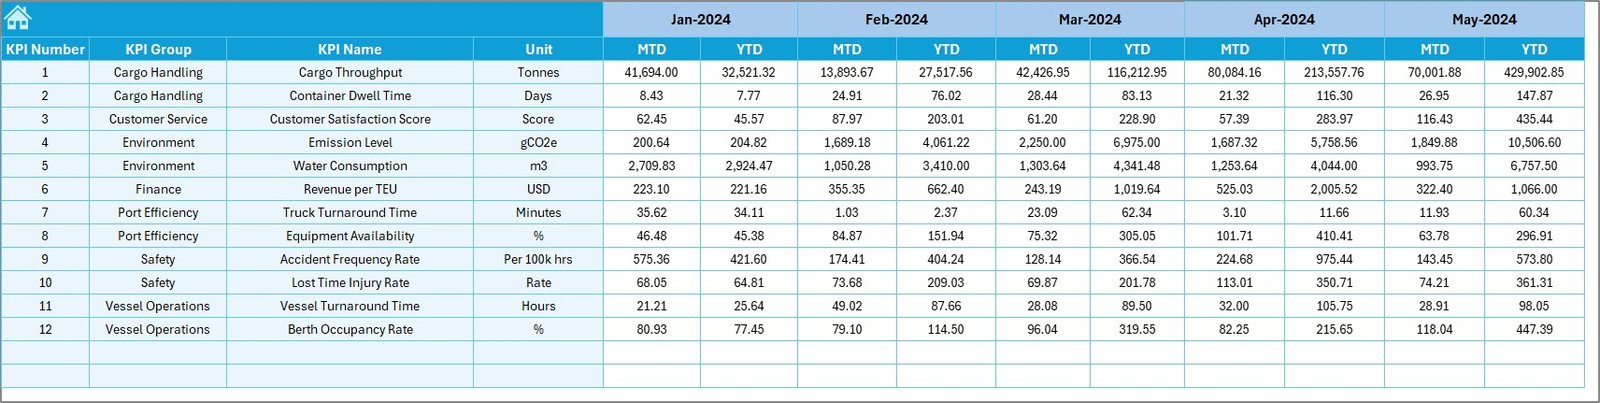
📌 4. Actual Numbers Input Sheet – Monthly Data Collection
Enter:
-
KPI Name
-
Month
-
MTD Actual
-
YTD Actual
Input the first month of the financial year in cell E1, and Excel automatically structures the periods correctly. This sheet ensures that dashboard visuals pull consistent and accurate data every month.
📌 5. Target Sheet – Set Performance Benchmarks
Enter monthly MTD and YTD target values.
These targets help port authorities measure progress, identify shortfalls, and align teams with operational goals.
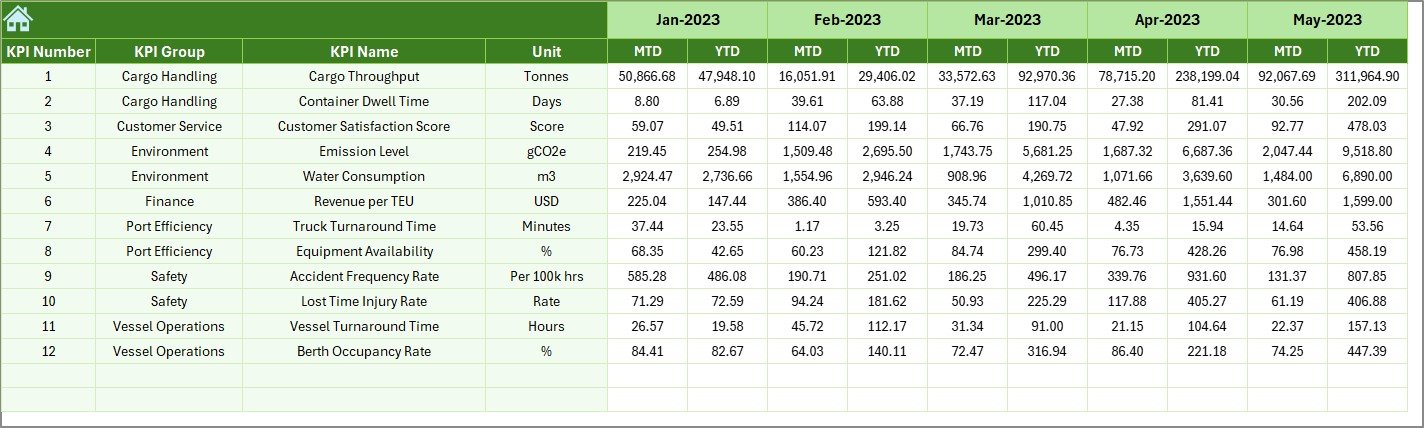
📌 6. Previous Year Sheet – Compare Historical Performance
Track:
-
CY vs PY (MTD)
-
CY vs PY (YTD)
Port operations often respond to weather conditions, trade cycles, and seasonal demand. This sheet ensures meaningful performance comparisons.
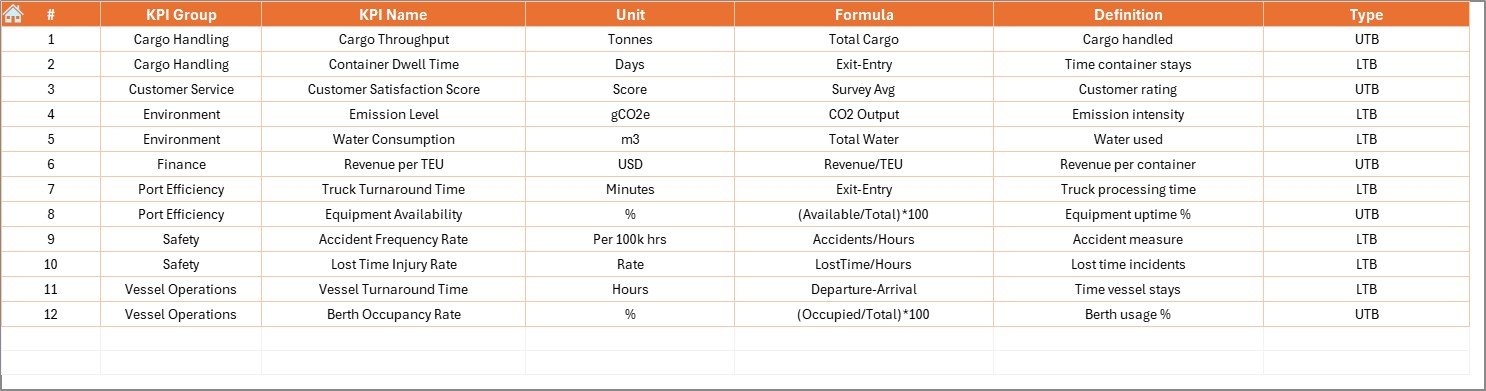
📌 7. KPI Definition Sheet – Standardize All KPIs
Stores:
-
KPI Group
-
KPI Name
-
Unit
-
Formula
-
Type
-
Definition
This ensures consistent interpretation during audits, reviews, and team communication.
⭐ How to Use the Ports and Harbors KPI Dashboard in Excel
🟦 Step 1: Update KPI Definitions
🟦 Step 2: Enter monthly targets
🟦 Step 3: Enter previous-year data
🟦 Step 4: Add monthly MTD & YTD actuals
🟦 Step 5: Select the desired month in the Dashboard sheet
🟦 Step 6: Analyze KPIs, arrows, and percentages
🟦 Step 7: Review trend charts for deeper insights
The workflow is simple, efficient, and perfect for daily or monthly monitoring.
⭐ Who Can Benefit from This Dashboard
⚓ Port Authorities – Track performance across cargo, vessels, and berthing.
🚢 Harbor Managers – Monitor turnaround time, workload, and delays.
📦 Terminal Operators – Analyze cargo movement and dock efficiency.
📊 Logistics & Supply Chain Teams – Track unloading, storage, and flow patterns.
🛡 Safety & Compliance Teams – Monitor inspections and safety checks.
💼 Maritime Consultants – Present clean and structured performance reports.


Reviews
There are no reviews yet.