Managing multiple projects, deadlines, risks, and resources is one of the toughest responsibilities for any Project Management Office (PMO). Without a structured system, teams struggle with scattered reports, inconsistent data, delayed visibility, and slow decision-making. That is why we created the Project Management Office (PMO) KPI Dashboard in Excel—a ready-to-use, professionally designed KPI tracking system that transforms the way PMO teams monitor performance.
This dashboard brings together all key metrics—MTD, YTD, targets, previous year comparison, and trends—into one powerful view. Whether you’re handling project timelines, budget variance, resource allocation, or governance KPIs, this dashboard helps you stay on top of everything with clarity and confidence.
✨ Key Features of the PMO KPI Dashboard in Excel
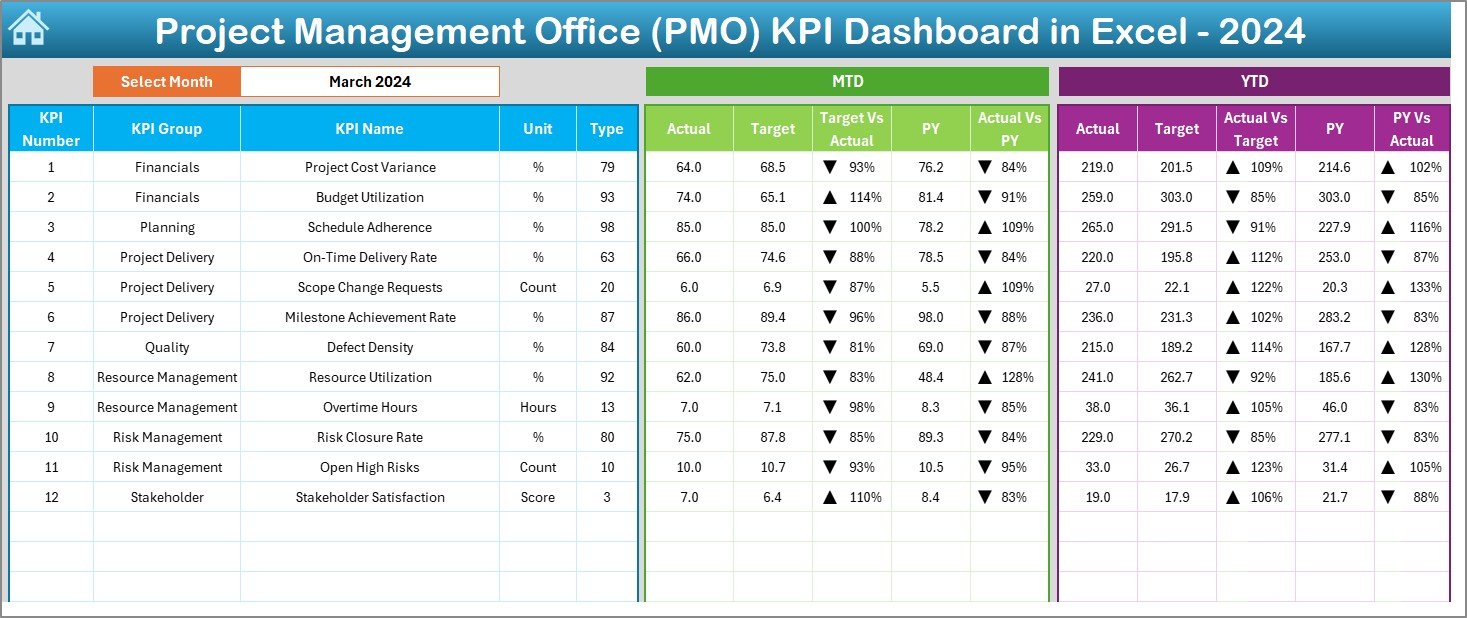
📊 Real-Time KPI Monitoring
Track all PMO KPIs in one place—including cost variance, schedule variance, resource utilization, project progress, on-time delivery, and more.
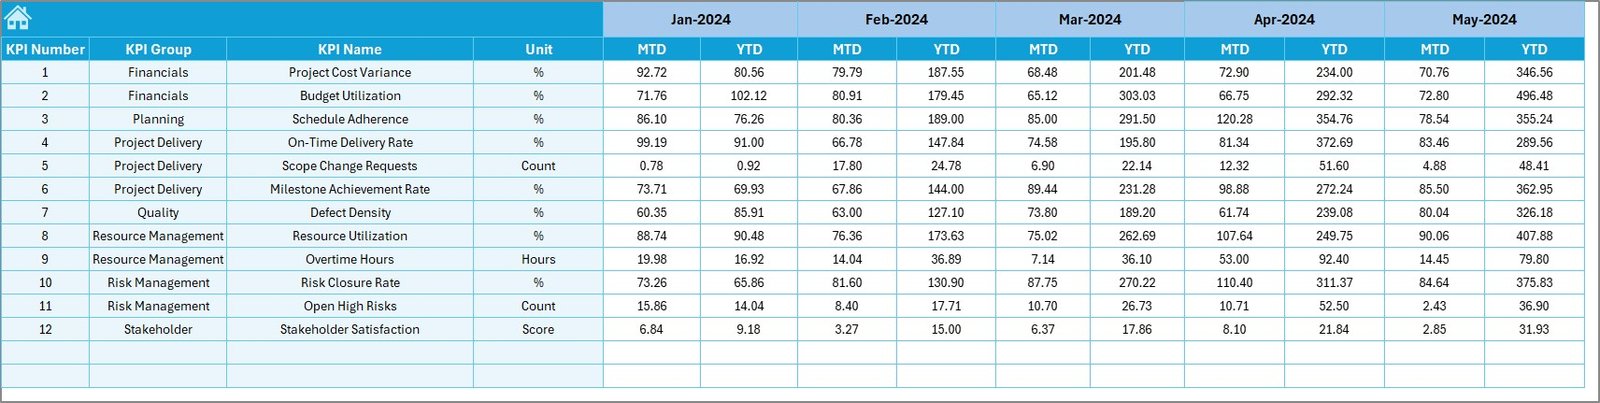
🗓️ Monthly & Yearly Insights
Easily compare MTD, YTD, Targets, and Previous Year numbers to measure growth and performance gaps instantly.
🎯 Target vs Actual Comparison
Conditional formatting highlights whether performance is improving or needs attention—using intuitive up/down arrows.
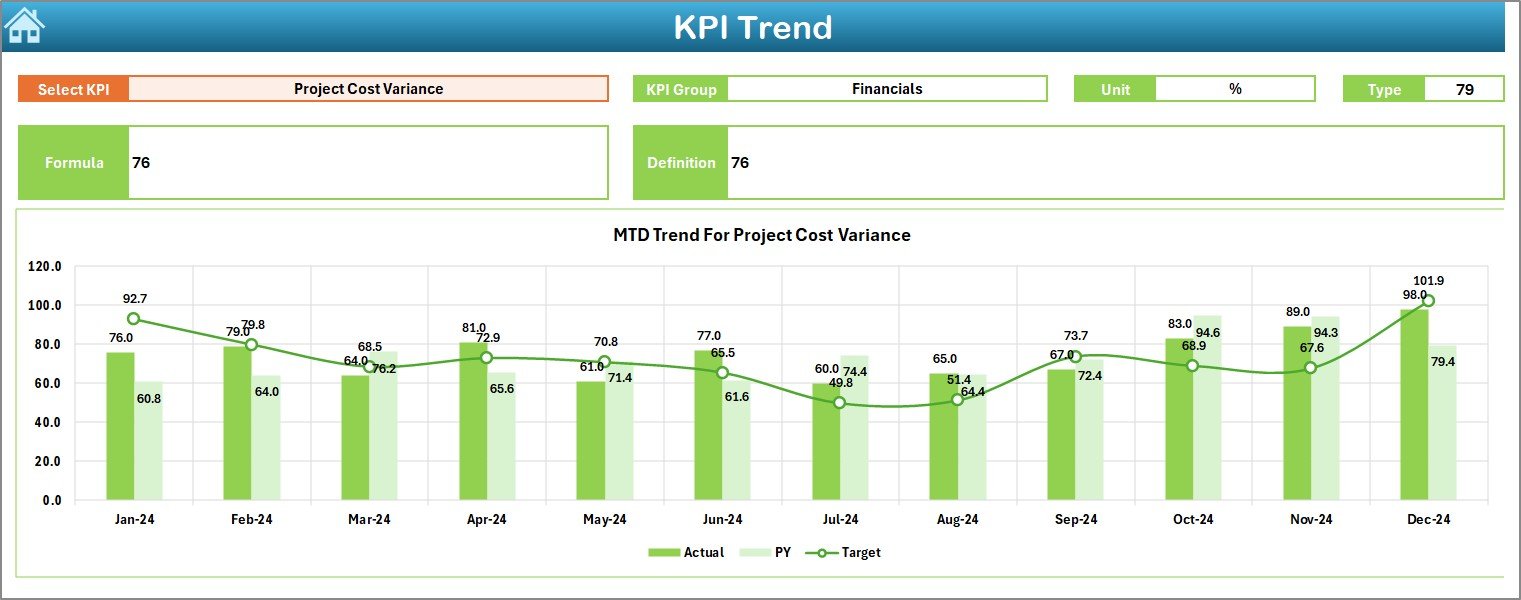
📈 Trend Analysis
The built-in Trend Sheet allows you to visualize KPI movement over months with dynamic charts for Actual, Target, and Previous Year.
🔄 Automatic Dashboard Updates
When you update the input sheets, all visualizations refresh instantly—no manual work, no recalculations.
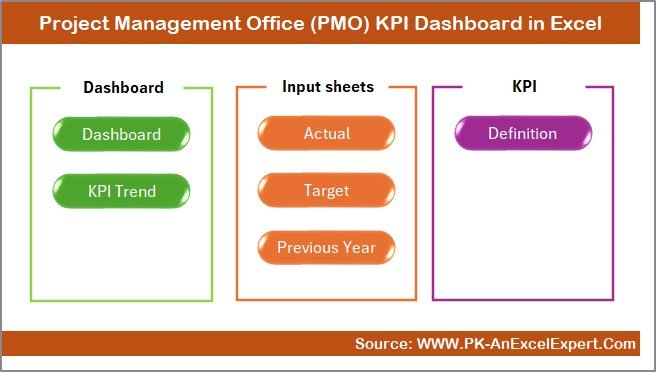
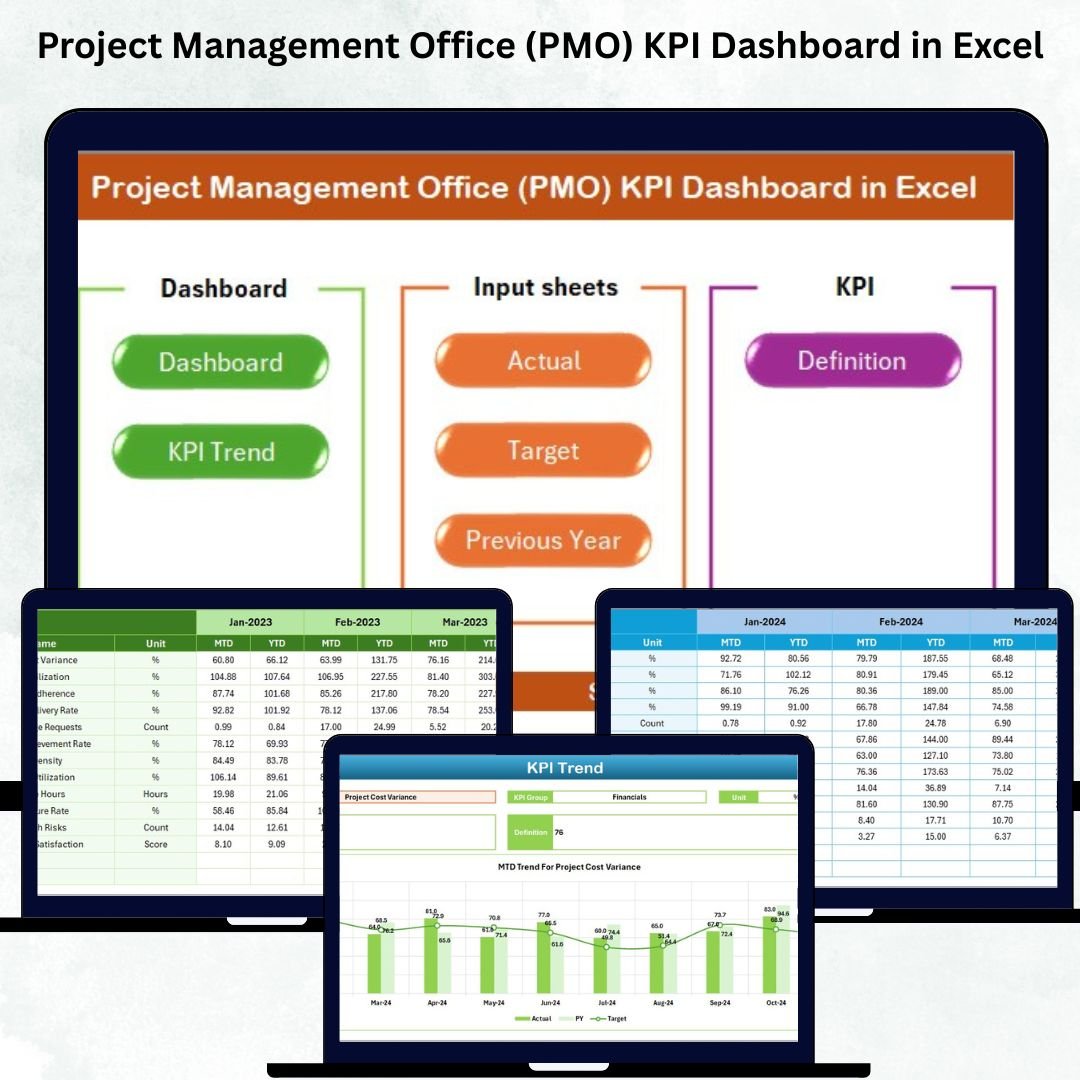
📦 What’s Inside the PMO KPI Dashboard in Excel
This dashboard contains 7 professionally designed worksheets, each built for clarity, accuracy, and smooth navigation:
🏠 1. Summary Page
A clean home screen with navigation buttons to access all major pages of the dashboard.
📊 2. Dashboard Page
The main visual KPI dashboard with color-coded metrics, dynamic slicers, and instant month-to-month performance updates.
📈 3. KPI Trend Sheet
Select any KPI and view detailed monthly trends for better decision-making.
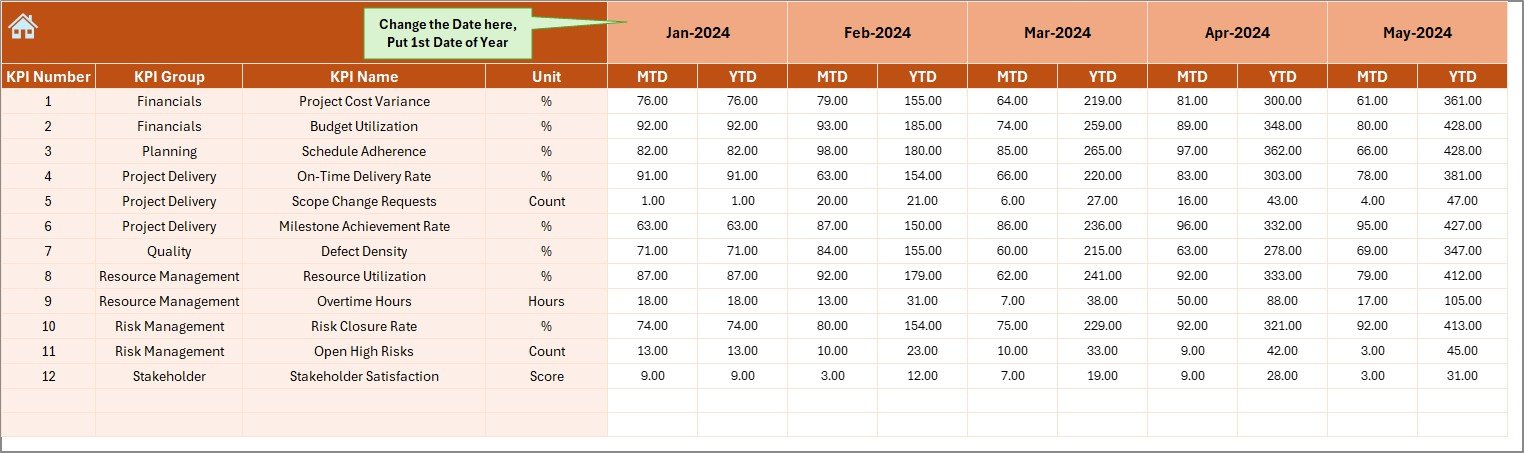
✍️ 4. Actual Numbers Input Sheet
Enter actual values for each month and watch dashboards update automatically.
🎯 5. Target Sheet
Set clear MTD and YTD targets for every KPI.
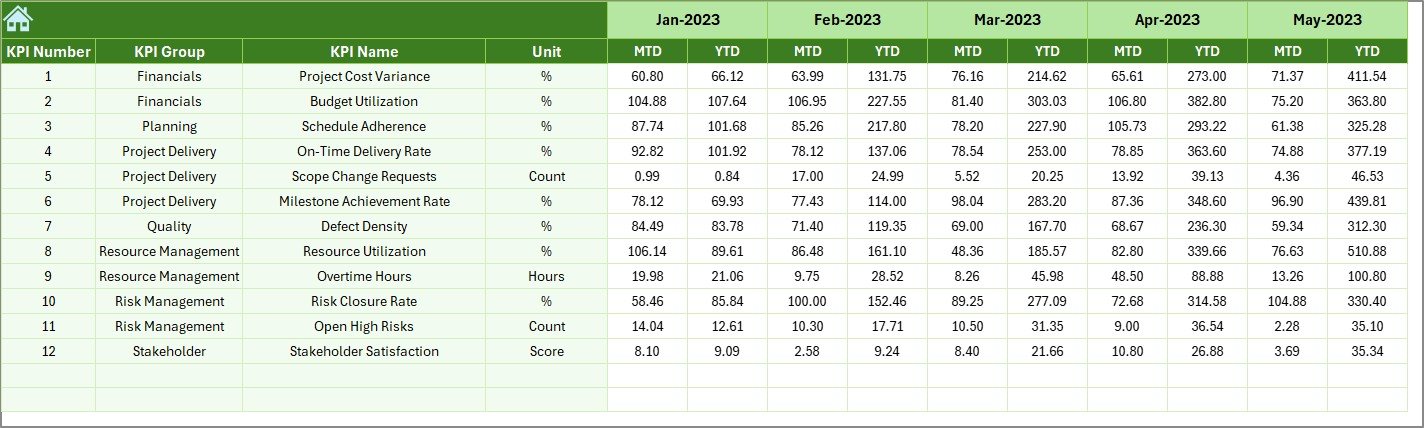
📆 6. Previous Year Input Sheet
Input last year’s numbers for strong year-over-year analytics.
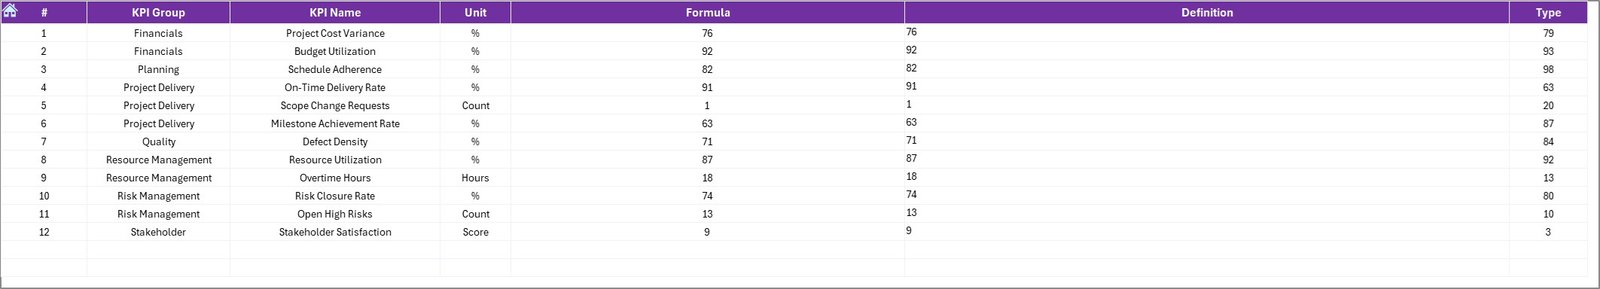
📘 7. KPI Definition Sheet
A complete reference to KPI names, formulas, units, types (UTB/LTB), and definitions.
🚀 How to Use the PMO KPI Dashboard in Excel
Using this dashboard is easy, even for beginners:
🔹 Step 1: Enter Actual Values
Update the MTD and YTD numbers in the Actual Input Sheet.
🔹 Step 2: Enter Target Values
Fill in the target sheet to track goal achievement.
🔹 Step 3: Add Previous Year Numbers
This helps produce YoY comparison charts automatically.
🔹 Step 4: Select the Month on the Dashboard
Choose a month from the drop-down to refresh all KPIs instantly.
🔹 Step 5: Review Insights
Analyze KPIs, compare performance, review trends, and identify risks.
👥 Who Can Benefit from This Dashboard?
✔️ PMO Teams
Monitor project health, risks, and resource performance with clarity.
✔️ Project Managers
Track schedule, cost, and resource KPIs for multiple projects.
✔️ Senior Leadership
Get an instant snapshot of performance without reading long reports.
✔️ Consultants & Analysts
Use the dashboard for reporting, presentations, client reviews, and audits.
✔️ Startups & Enterprises
Any team handling multiple projects can use this dashboard to streamline their reporting.
Click here to read the Detailed blog post


Reviews
There are no reviews yet.