
Managing performance in a credit union requires speed, clarity, and complete visibility across departments like lending, deposits, operations, member services, finance, and compliance. But when data is scattered across multiple spreadsheets, manual reports, and slow calculations, decision-making becomes difficult. That’s exactly why we created the Credit Unions KPI Dashboard in Power BI — a ready-to-use, fully interactive performance monitoring solution that turns complex numbers into crystal-clear insights.
This dashboard gives your team the power to track MTD & YTD performance, Target vs Actual comparison, previous-year trends, KPI definitions, and category-wise metrics — all on one screen. Whether you are a branch manager, finance executive, auditor, or operations leader, this dashboard helps you take faster, smarter, and more accurate decisions.
⭐ Key Features of the Credit Unions KPI Dashboard in Power BI
This dashboard is built to make performance monitoring effortless and impactful.
✨ Real-Time MTD & YTD Tracking – See exactly how your KPIs are performing this month and year compared to your targets.
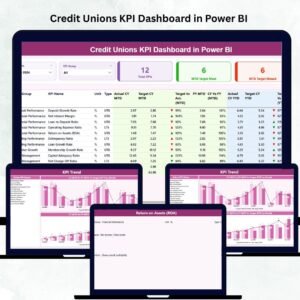
📊 3 Insightful Pages – Summary Page, KPI Trend Page, and KPI Definition Page—each offering a unique view of your credit union’s performance.
🎯 Target Achievement View – View KPIs Met vs Missed instantly through clear visual cards.
🔍 Interactive Slicers – Filter by Month and KPI Group to instantly reshape your analysis.
📈 MTD & YTD Trend Charts – Understand performance movements over time with combo charts for CY, PY, and Targets.
📘 Drill-Through KPI Definitions – Access formulas, logic, descriptions, and units for complete KPI transparency.
📁 Excel-Based Data Source – Update your Excel sheets and refresh Power BI—your entire dashboard updates instantly.
⭐ What’s Inside the Credit Unions KPI Dashboard
Here’s what you get inside the final Power BI dashboard package:
📌 Summary Page
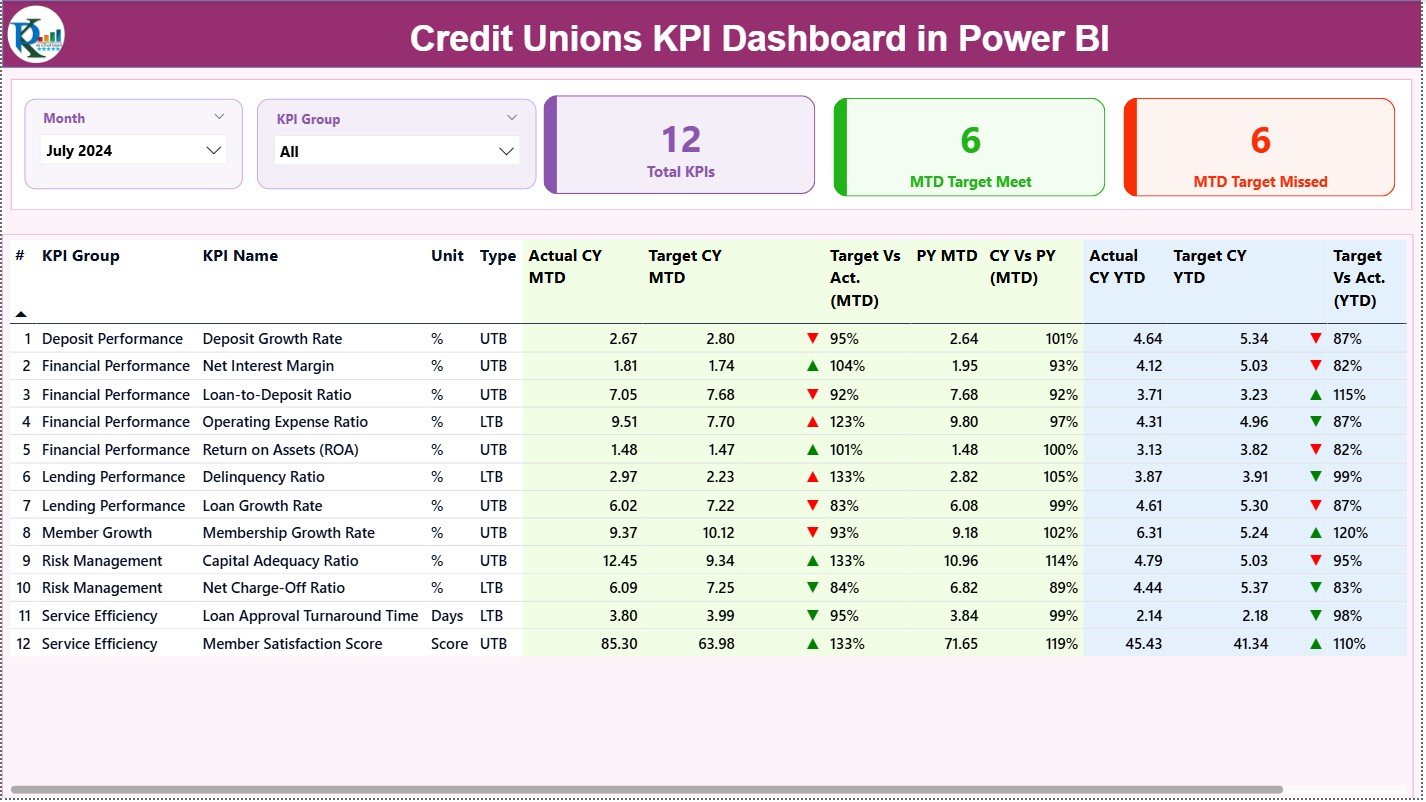
Your main dashboard where you track everything at a glance:
-
Month & KPI Group Slicers
-
Total KPI Count
-
MTD Target Met & Missed
-
Detailed KPI Table
-
Comparison of Target vs Actual, CY vs PY
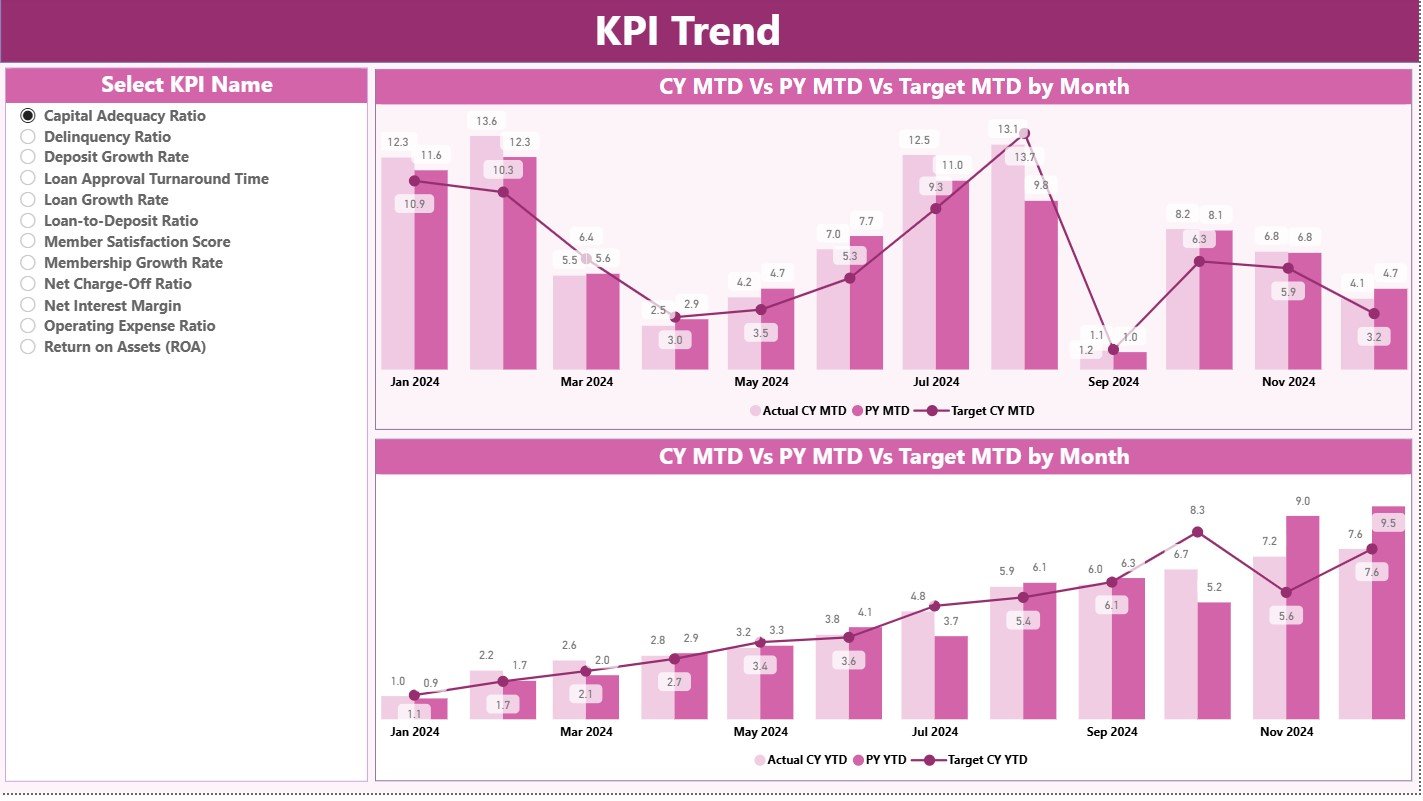
📌 KPI Trend Page
Analyze performance movement with:
-
MTD Trend Chart
-
YTD Trend Chart
-
KPI Name Slicer
Perfect for review meetings and performance presentations.
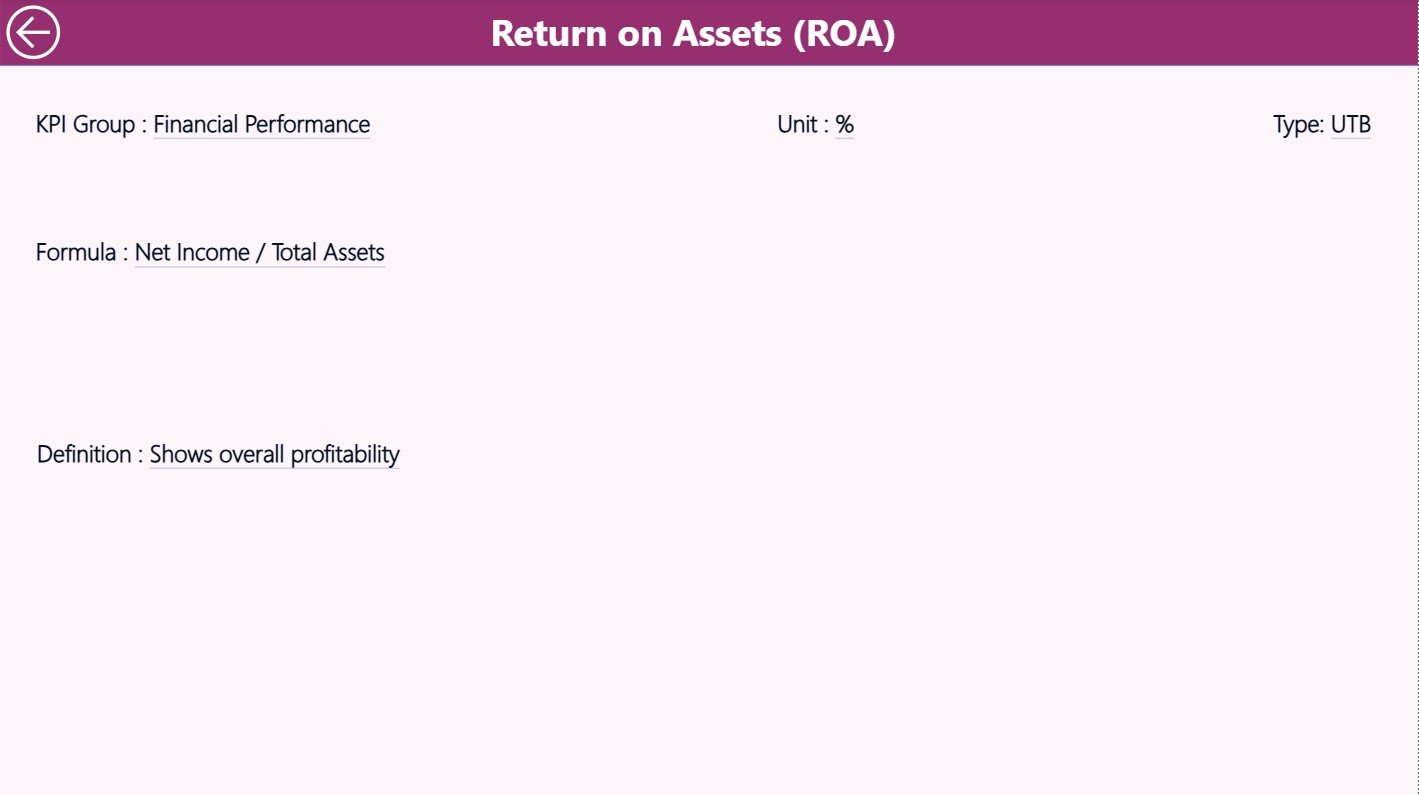
📌 KPI Definition Page (Drill-Through)
Know the formula and logic behind every KPI:
-
KPI Number
-
KPI Group
-
KPI Name
-
Unit
-
Formula
-
Type (UTB or LTB)
-
Description
Great for improving transparency and data clarity.
📌 Excel Files Included
-
Input_Actual
-
Input_Target
-
KPI_Definition
These sheets power your dashboard and make updates easy.
⭐ How to Use the Credit Unions KPI Dashboard
Using the dashboard is incredibly simple—no technical expertise required.
🟦 Step 1: Enter your monthly actual & target data in the Excel file
🟦 Step 2: Refresh your Power BI dashboard
🟦 Step 3: Use Month & KPI Group slicers to view insights
🟦 Step 4: Review KPI performance across MTD, YTD, and Previous Year
🟦 Step 5: Drill through any KPI to view its definition
🟦 Step 6: Use trend charts for forecasting & planning
🟦 Step 7: Present data easily during reviews and audits
This dashboard gives you complete control over performance tracking with minimal effort.
⭐ Who Can Benefit from This Credit Unions KPI Dashboard
🏦 Credit Union Leadership Teams
Make informed strategic decisions with clear performance insights.
📊 Finance Departments
Track financial KPIs like deposit growth, loan disbursal, delinquency ratios, and net interest margins.
🧮 Operations & Member Service Teams
Monitor service quality, request completion time, and customer satisfaction indicators.
📞 Call Center & Support Teams
Track member support KPIs and improve response performance.
🛡 Risk & Compliance Teams
Understand risk assessment scores, regulatory reporting, and audit KPIs.
📈 Branch Managers
Compare performance and ensure continuous improvement.
This dashboard is ideal for credit unions of all sizes looking to upgrade from manual spreadsheets to a fully automated, visual, and interactive reporting system.


Reviews
There are no reviews yet.