Data centers power the digital world — hosting applications, delivering cloud services, and enabling nonstop operations for global businesses. To maintain high performance, reliability, and efficiency, data center leaders must monitor essential KPIs such as uptime, PUE, cooling efficiency, asset utilization, incident trends, and service delivery.
The Data Center KPI Dashboard in Google Sheets is a ready-to-use, fully automated performance monitoring tool designed to simplify data center reporting, enhance transparency, and support data-driven operations. Built entirely inside Google Sheets, it provides MTD/YTD comparisons, trend charts, target analysis, and KPI definitions — making it ideal for IT operations leaders, facility managers, and infrastructure teams.
🔑 Key Features of Data Center KPI Dashboard in Google Sheets
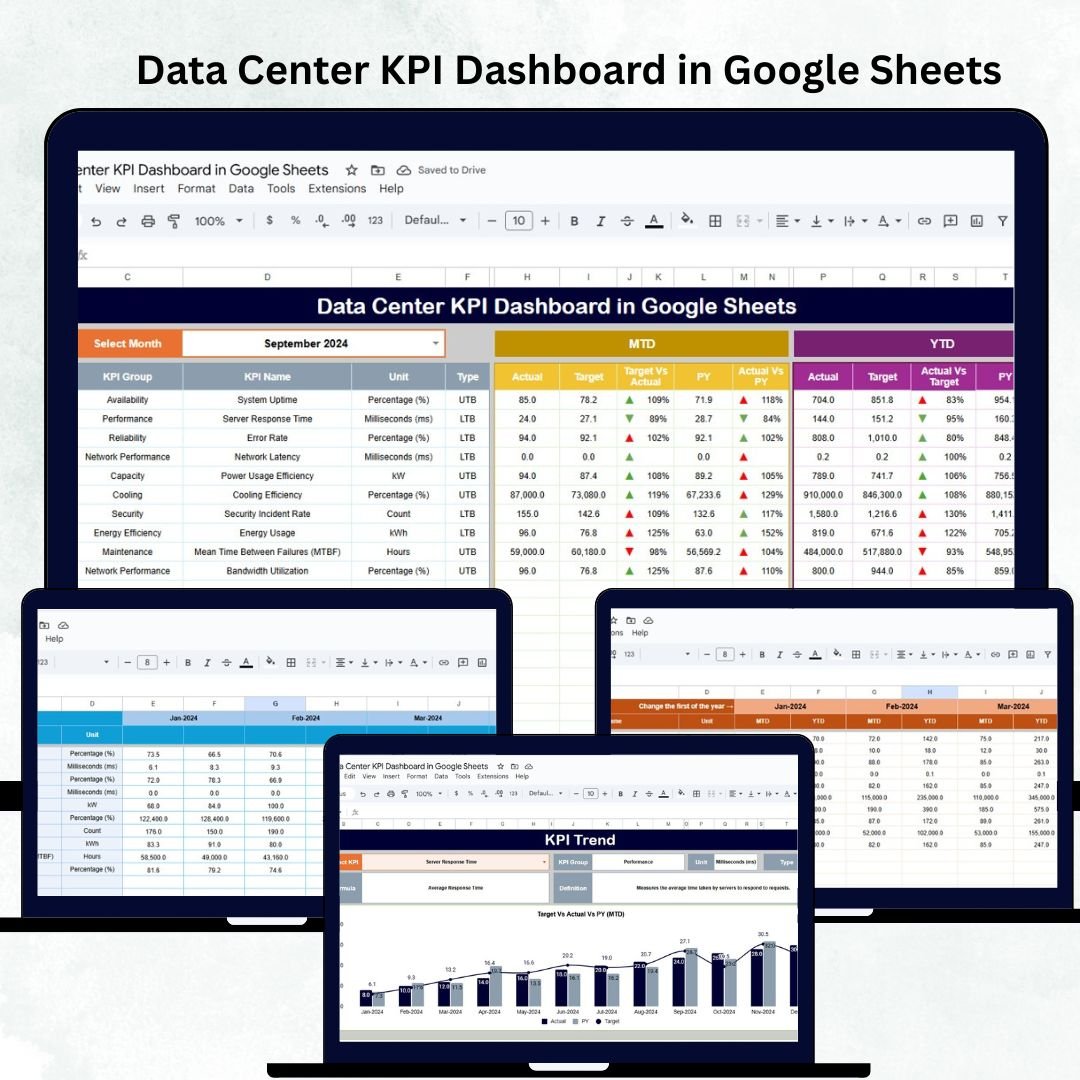
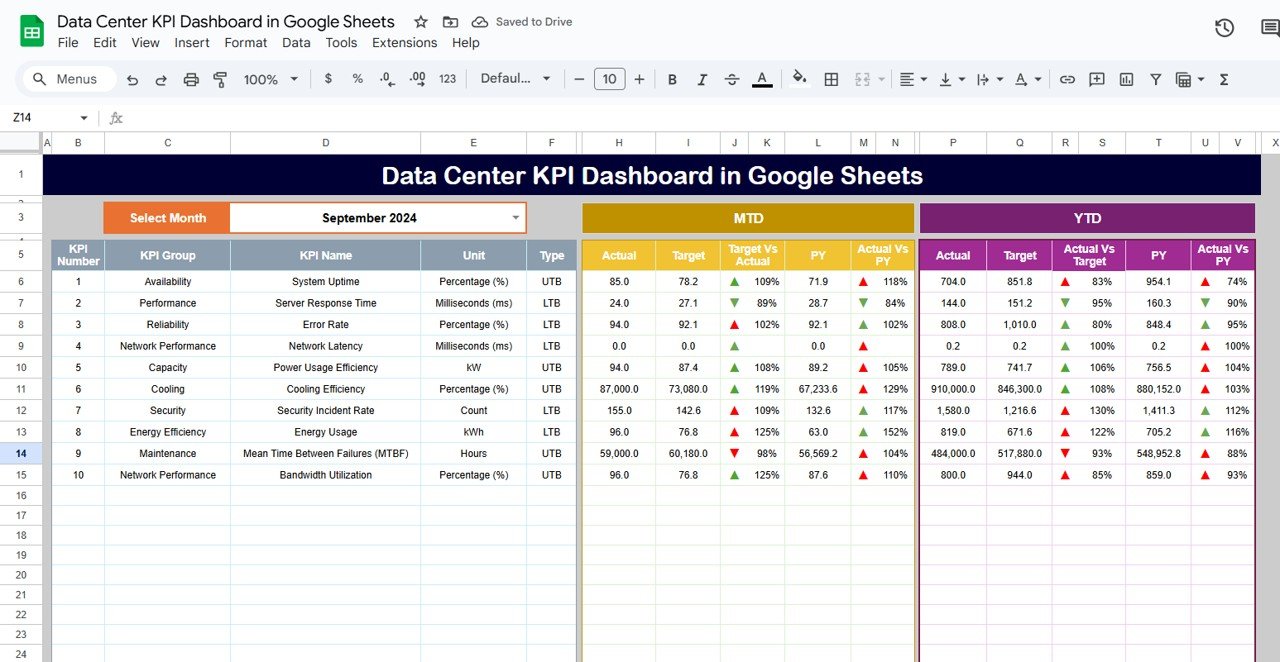
📊 Dashboard Sheet Tab (Main Performance View)
This is the command center of the dashboard, presenting all essential KPIs with month selector (Cell D3).
You can instantly compare:
-
MTD Actual vs Target vs Previous Year
-
YTD Actual vs Target vs Previous Year
The built-in conditional formatting uses:
-
🟢 Green Indicators – On-target or improved
-
🟡 Yellow Indicators – Close to target
-
🔴 Red Indicators – Requires attention
-
⬆️ Up Arrows – Improved performance
-
⬇️ Down Arrows – Declining performance
This sheet provides an instant snapshot of operational health and trend direction.
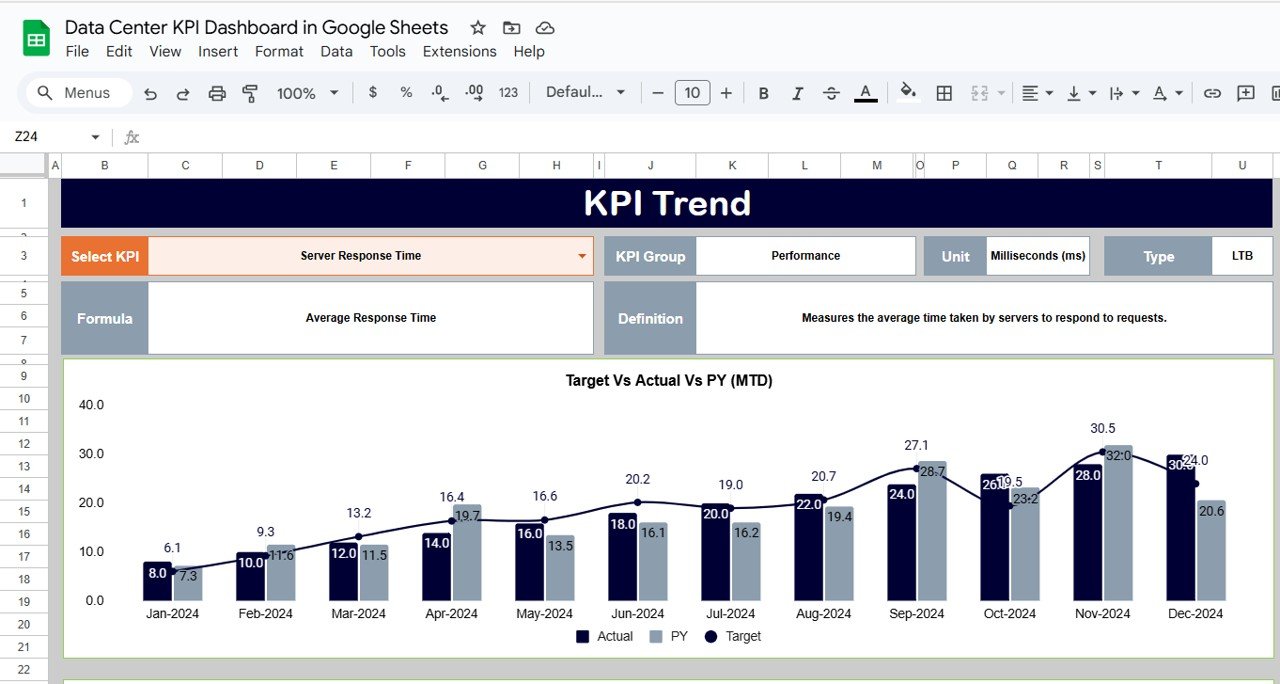
📈 KPI Trend Sheet Tab
Select any KPI using the dropdown (Cell C3) and view:
-
KPI Group
-
Unit of measurement
-
Type (UTB/LTB)
-
KPI Formula
-
KPI Definition
-
Monthly trend charts (MTD & YTD)
This visual trend analysis helps identify performance variations, seasonal patterns, and improvement opportunities.
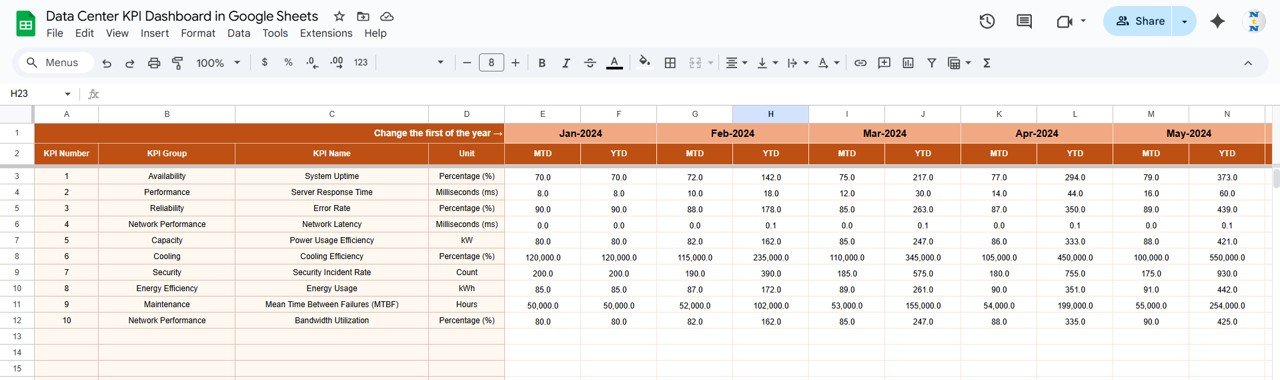
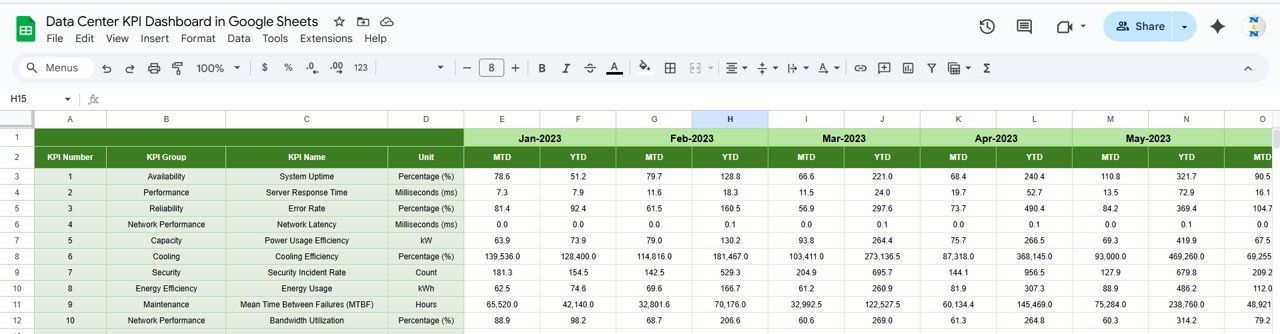
🧾 Actual Number Sheet Tab
-
Enter Actual MTD and YTD numbers for each KPI
-
Select the starting month of the year (Cell E1)
-
Dashboard visuals update automatically
Designed for easy and quick data entry.
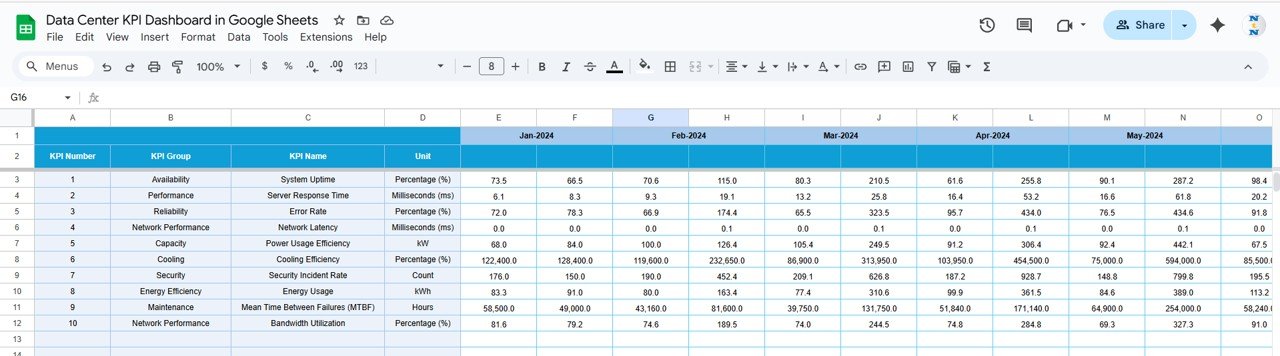
🎯 Target Sheet Tab
Record monthly and YTD targets for each KPI to measure performance gaps.
Perfect for benchmarking expectations vs. real-world performance.
📊 Previous Year Number Sheet Tab
Store last year’s MTD and YTD performance values.
Great for YoY comparison and long-term improvement tracking.
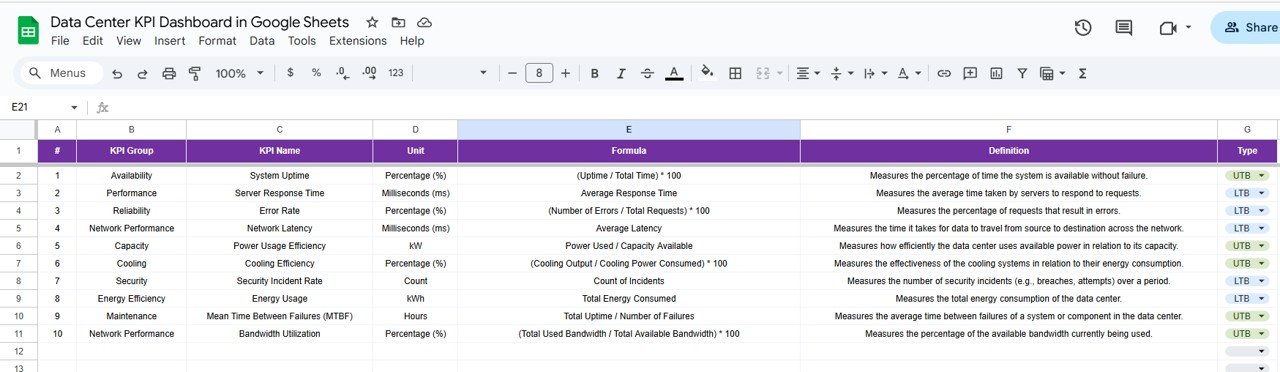
📘 KPI Definition Sheet Tab
A complete table of:
-
KPI Name
-
KPI Group
-
Formula
-
Unit
-
Definition
-
Type (UTB/LTB)
Ensures consistency and team alignment across reporting cycles.
📦 What’s Inside the Data Center KPI Dashboard?
You will receive:
✅ Fully automated Google Sheets KPI Dashboard
✅ 6 Structured Sheets — Dashboard, Trends, Actuals, Targets, Previous Year, KPI Definitions
✅ Pre-built MTD & YTD performance logic
✅ Conditional formatting with arrows & RYG indicators
✅ Editable KPI framework
✅ Trend charts for historical evaluation
✅ No macros or coding needed — plug and play
✅ Real-time collaboration capability
Everything is designed to help your data center run more efficiently and reliably.
🧑💼 Who Can Benefit from This Dashboard?
🎯 Data Center Managers
🎯 IT Operations Teams
🎯 Facility & Infrastructure Teams
🎯 Service Delivery Managers
🎯 Cloud & Hosting Providers
🎯 Network Operations Center (NOC) Teams
Whether you run one data center or a multi-region network, this dashboard scales effortlessly.
🧪 How to Use the Data Center KPI Dashboard
1️⃣ Enter monthly Actuals in the Actual Number Sheet
2️⃣ Set performance expectations in the Target Sheet
3️⃣ Compare with last year in the Previous Year Sheet
4️⃣ Select a month (D3) to refresh dashboard visuals
5️⃣ Review KPI trends in the KPI Trend tab
6️⃣ Analyze MTD/YTD performance instantly
The dashboard updates automatically — allowing faster decisions and more accurate performance evaluation.
🌟 Why Choose This Dashboard?
-
Centralized uptime & performance monitoring
-
Tracks energy efficiency (PUE, cooling), asset usage & reliability
-
Helps reduce downtime and optimize resource usage
-
Supports compliance, audits, and SLA analysis
-
Fully customizable KPIs
-
Real-time cloud collaboration through Google Sheets
With this dashboard, data center performance becomes predictable, measurable, and controllable.
🔗 Click here to read the Detailed blog post
Watch the step-by-step video Demo:


Reviews
There are no reviews yet.