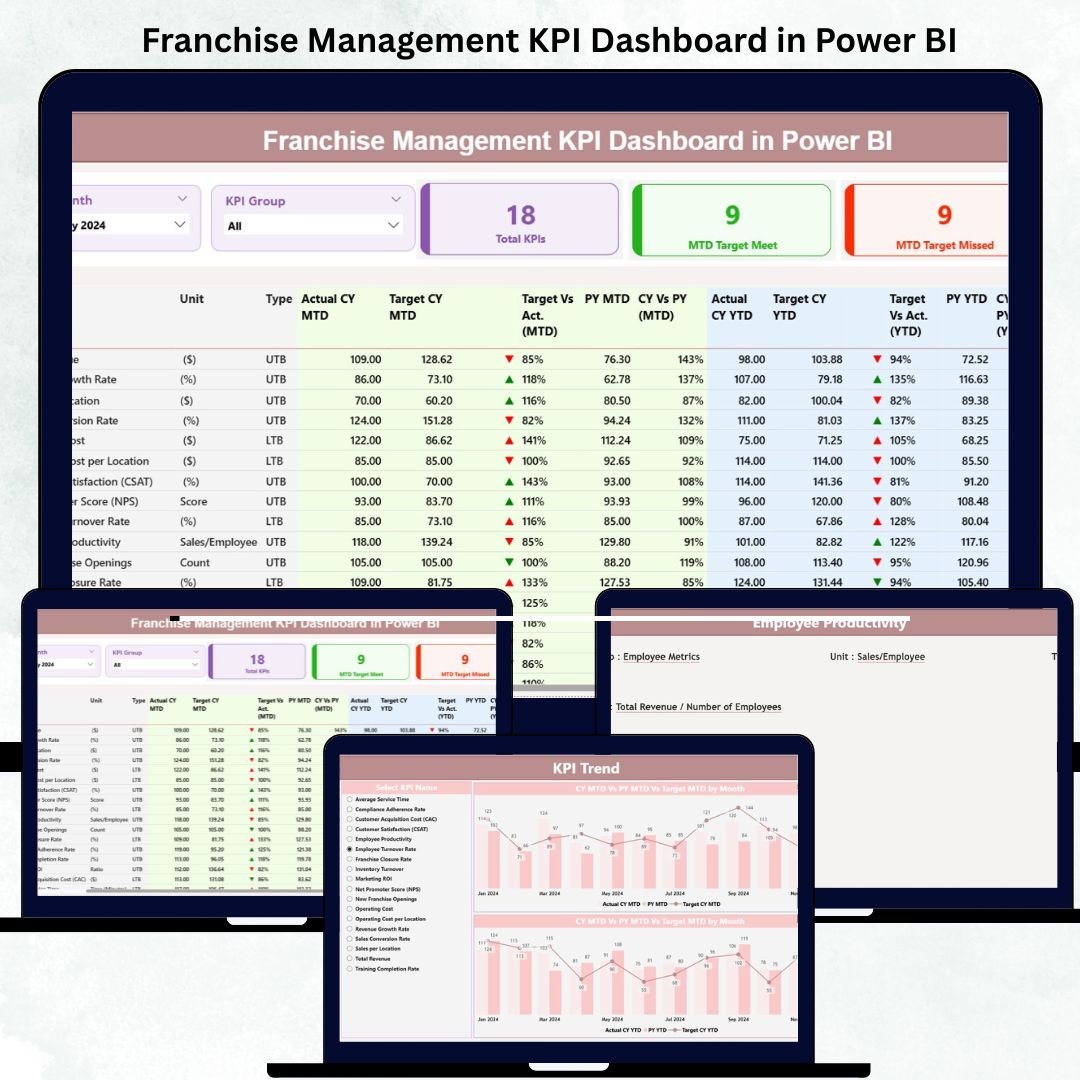
Managing a franchise network across multiple locations can be challenging — especially when it comes to tracking performance, aligning goals, and maintaining consistency. The Franchise Management KPI Dashboard in Power BI is your all-in-one performance command center that simplifies monitoring, reporting, and decision-making across every franchise outlet. 📊
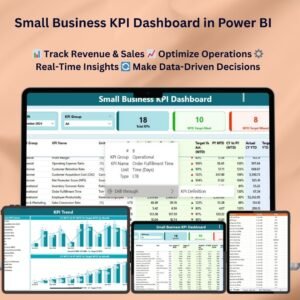
Built using Microsoft Power BI, this ready-to-use dashboard transforms raw data into interactive visuals that display KPIs such as sales, customer satisfaction, operational costs, and more — all updated in real time. Whether you manage 5 stores or 500, this solution keeps every manager and decision-maker on the same page with data-driven clarity.
🌟 Key Features of the Franchise Management KPI Dashboard
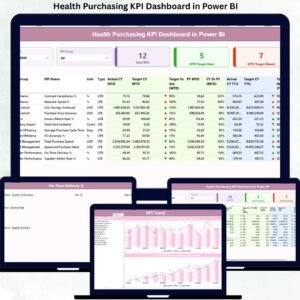
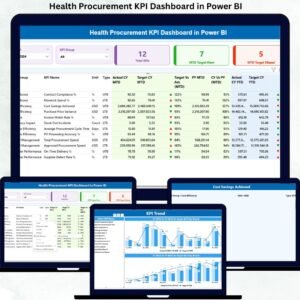
🧭 1️⃣ Summary Page – Centralized Franchise Overview
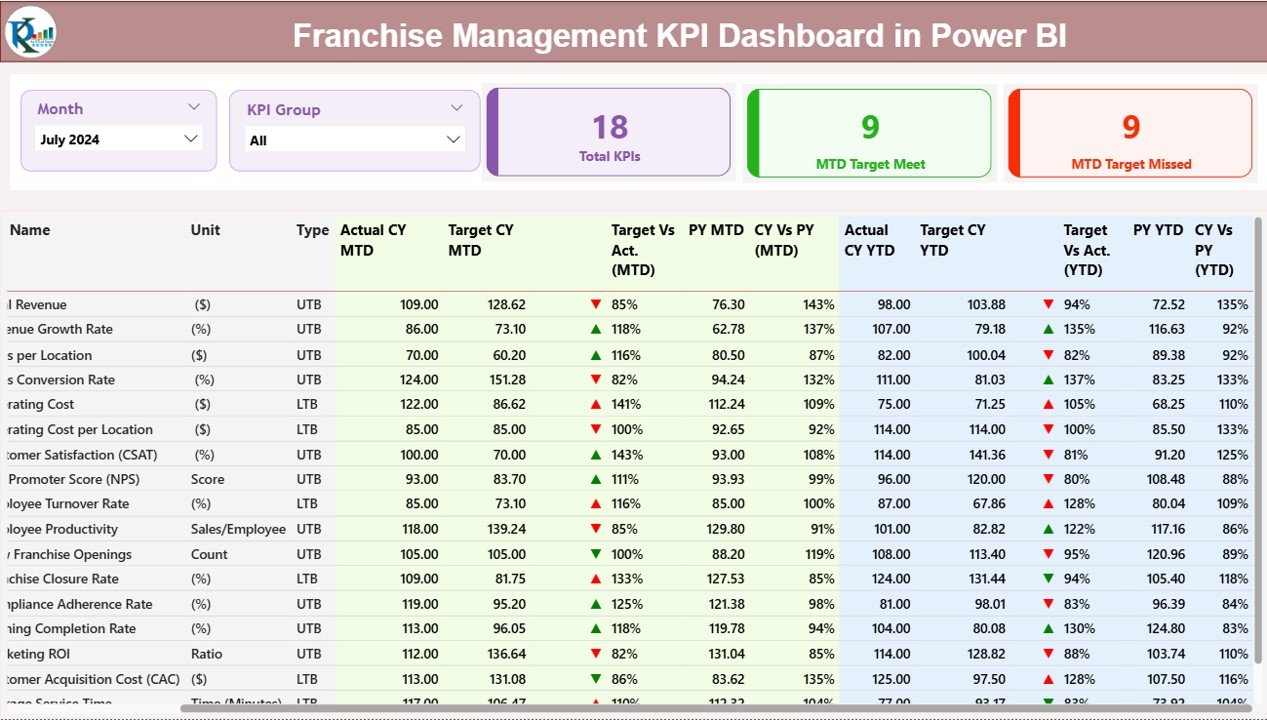
The Summary Page gives an instant snapshot of performance across all franchises.
Highlights:
-
📅 Month & KPI Group Slicers: Filter instantly by period or KPI category.
-
💡 Performance Cards:
-
Total KPIs Tracked
-
MTD Target Met Count
-
MTD Target Missed Count
-
-
📋 Detailed KPI Table showing KPI Group, KPI Name, Unit, Type (UTB/LTB), MTD & YTD Actual vs Target, and Previous Year comparisons.
-
📈 Visual Icons (▲ / ▼) indicate whether KPIs are on track or lagging.
💬 Purpose: Identify high-performing outlets, detect problem areas early, and take corrective actions quickly.
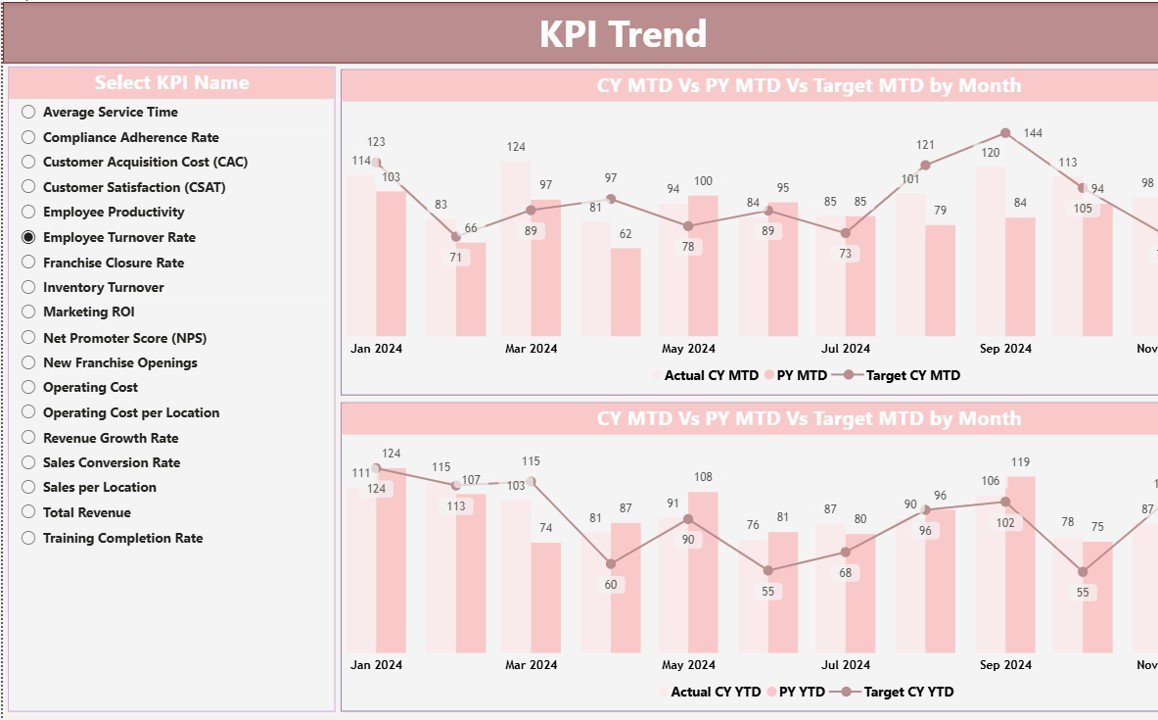
📊 2️⃣ KPI Trend Page – Track Monthly & Yearly Progress
Understand how performance evolves over time.
Features Include:
-
🎯 KPI Selector Slicer to focus on any individual KPI.
-
🔄 Combo Charts comparing Actual vs Target for both MTD and YTD.
-
📆 Historical View of Current Year vs Previous Year results.
📈 Outcome: Detect trends, forecast growth, and measure consistency across outlets.
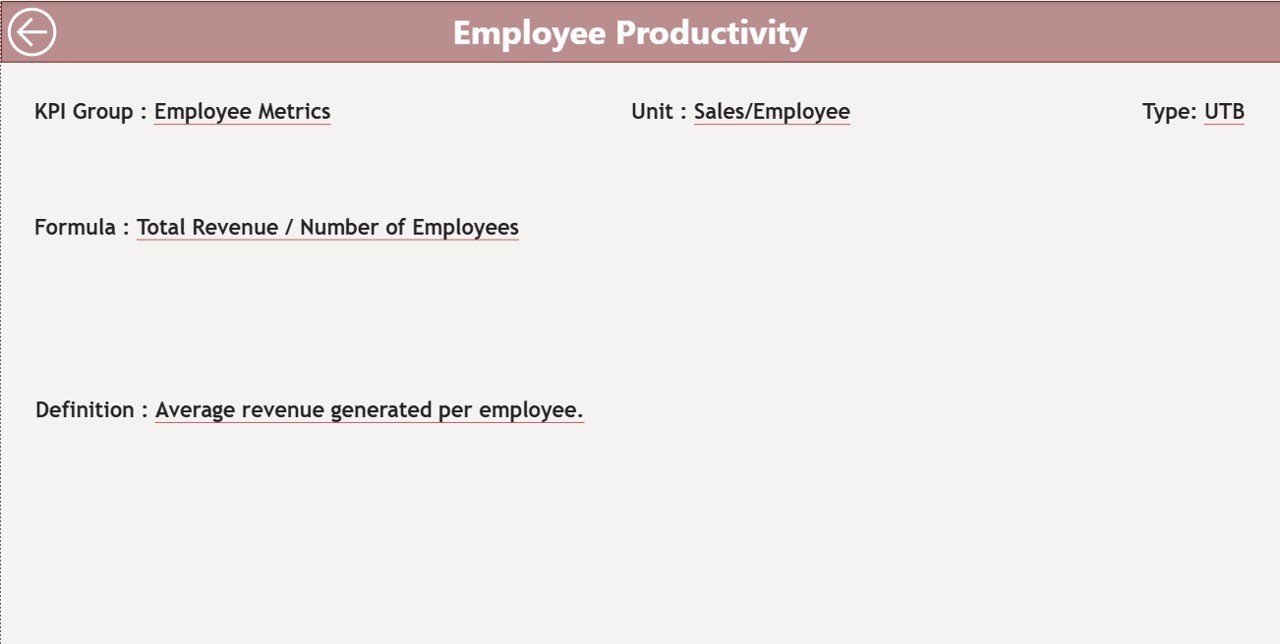
📘 3️⃣ KPI Definition Page – Transparency & Standardization
This drill-through page defines every metric for clear understanding.
Displays:
-
KPI Formula
-
Unit of Measurement
-
Definition
-
Type (UTB/LTB)
Use the built-in Back Button to return to the main dashboard easily.
💡 Purpose: Promote consistent understanding of KPIs across all franchise partners.
💾 Excel Data Source & Structure
The dashboard connects directly to a structured Excel file, ensuring automatic and accurate updates.
1️⃣ Input_Actual Sheet – Stores actual MTD & YTD performance per KPI.
2️⃣ Input_Target Sheet – Contains target MTD & YTD values.
3️⃣ KPI Definition Sheet – Houses KPI details (name, formula, type).
Together, these sheets feed live, refreshable data into Power BI — no manual editing required.
💼 Advantages of Using the Franchise Management KPI Dashboard
✅ Real-Time Insights: Instantly view updated KPI results from every location.
✅ Automated Analytics: No manual calculations — Power BI handles all formulas.
✅ Improved Decision-Making: Identify top performers & underperformers instantly.
✅ Enhanced Accountability: Visual tracking encourages ownership among managers.
✅ Data Accuracy: Reliable metrics ensure trustworthy insights.
✅ Time Savings: Replace hours of reporting with one refreshable dashboard.
✅ Goal Alignment: Consistent KPI definitions keep all outlets working toward shared targets.
⚙️ How to Use the Dashboard Effectively
1️⃣ Enter Data in Excel Input Sheets (Actual & Target).
2️⃣ Refresh Power BI to auto-update visuals.
3️⃣ Use Slicers to filter by Month or KPI Group.
4️⃣ Analyze Trends on the KPI Trend Page.
5️⃣ Drill Through to view KPI definitions for context.
6️⃣ Make Decisions based on visual insights and comparative performance.
🧠 Best Practices
🔹 Maintain consistent KPI naming and units.
🔹 Update data monthly for accurate trends.
🔹 Focus on key KPIs such as Sales Growth %, Customer Satisfaction, and Operating Cost.
🔹 Use drill-through pages to train new franchise managers.
🔹 Schedule regular reviews based on the Trend Page findings.
🏁 Conclusion
The Franchise Management KPI Dashboard in Power BI revolutionizes how franchise networks track and optimize performance. With automated data flows, interactive visuals, and real-time insights, it empowers leaders to drive growth and consistency across all locations.
From sales and operations to customer service and finance, this dashboard gives you complete visibility into your entire network — turning data into action and insight into profit.
📈 Streamline your franchise management today with this Power BI solution — available exclusively at NextGenTemplates.com.


Reviews
There are no reviews yet.