

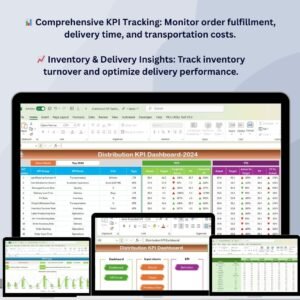
Managing a warehouse efficiently means keeping an eye on hundreds of moving parts — from order accuracy to storage utilization. The Warehouse Management KPI Scorecard in Excel is your all-in-one solution to track, measure, and improve performance without needing any complex software. Built with simplicity and precision, this scorecard transforms your raw warehouse data into clear, visual insights that drive real results.
This ready-to-use Excel template empowers logistics managers, warehouse supervisors, and business owners to monitor Key Performance Indicators (KPIs) effortlessly. Whether it’s productivity, cost efficiency, or operational accuracy, everything you need to evaluate warehouse performance is right here — neatly organized in one powerful dashboard.
⚙️ Key Features of Warehouse Management KPI Scorecard in Excel
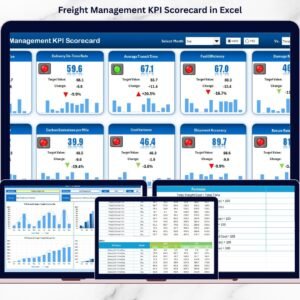
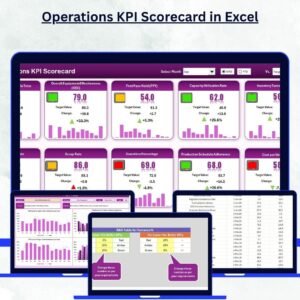
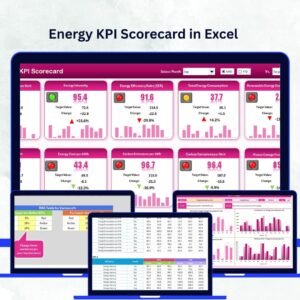
✨ Comprehensive Dashboard View: Instantly view Month-to-Date (MTD) and Year-to-Date (YTD) performance with dropdown selections.
📈 Actual vs Target Analysis: Compare results against planned goals to see exactly where improvement is needed.Warehouse Management KPI Scorecard in Excel
🟢🔴 Visual Indicators: Green and red icons help you recognize high and low-performing KPIs instantly.
📊 Dynamic Charts & Trends: Built-in charts and pivot visuals make performance review meetings more insightful.Warehouse Management KPI Scorecard in Excel
📋 Error-Free Data Entry: Structured validations prevent mistakes, keeping your data clean and reliable.
📅 Track 10 KPIs at Once: Get a snapshot of key warehouse metrics on one interactive screen.
💡 Fully Customizable: Easily add or modify KPIs, formulas, and visuals to match your operations.
🧠 No Coding Required: Works with Excel 2016 or later—just plug in your data and start analyzing.

📂 What’s Inside the Warehouse Management KPI Scorecard
This Excel file includes four powerful worksheet tabs, each designed for easy navigation and real-time analysis:Warehouse Management KPI Scorecard in Excel
1️⃣ Scorecard Sheet (Main Dashboard): The heart of the tool — view all key KPIs, MTD/YTD comparisons, and trend indicators in one clean layout.
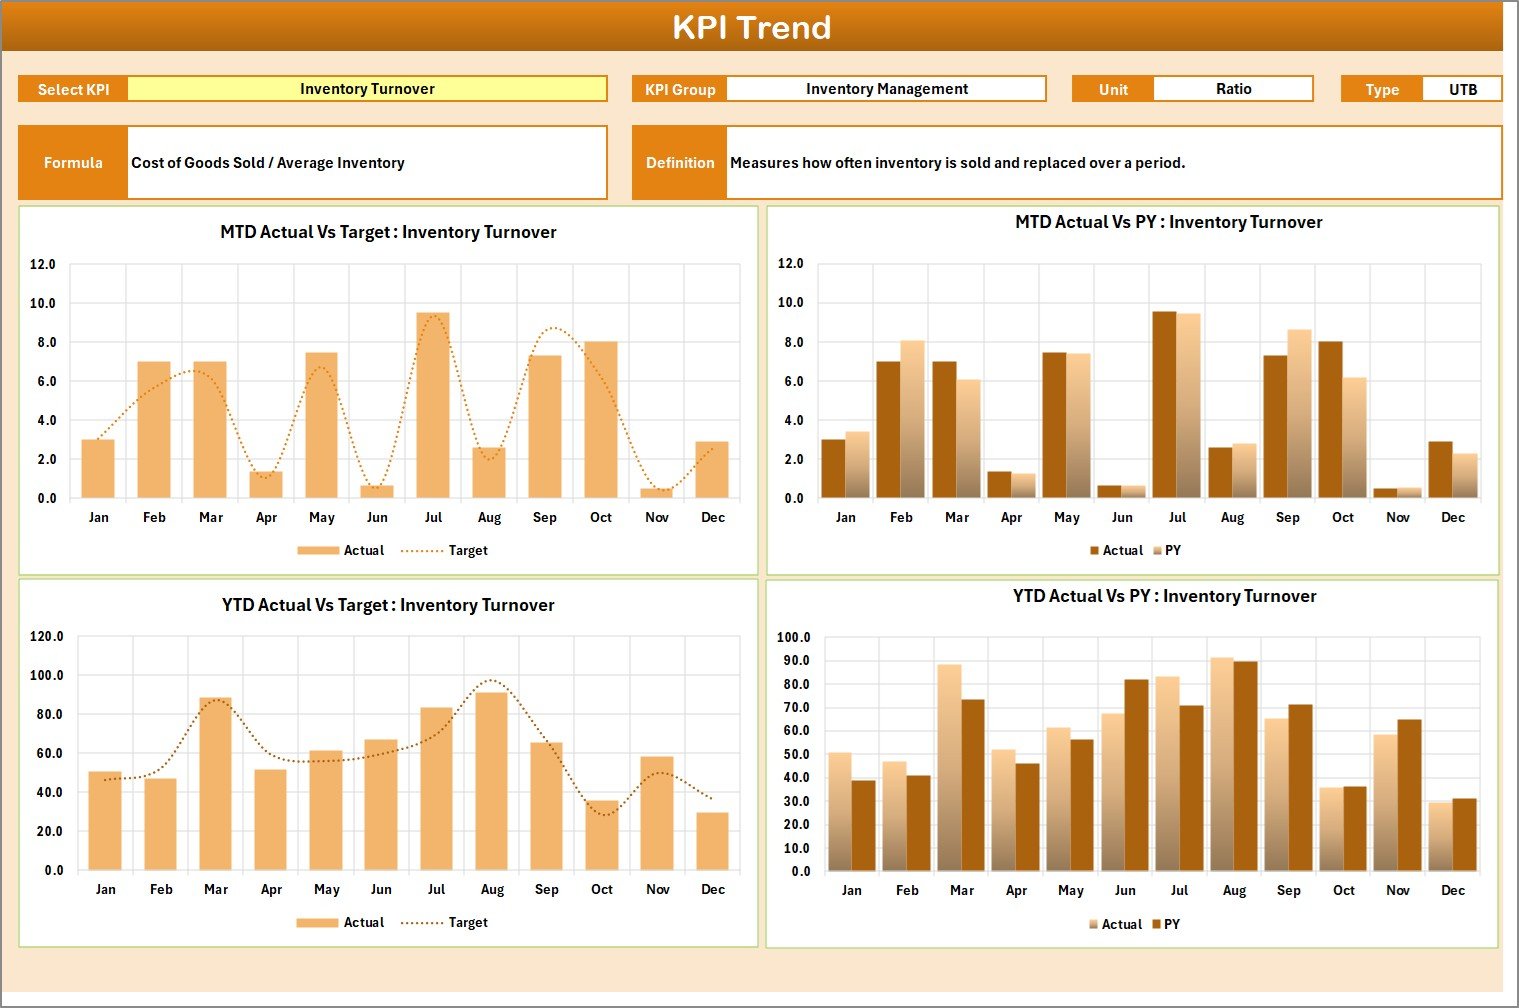
2️⃣ KPI Trend Sheet: Dive deep into individual KPI performance over time. View historical data, interactive charts, and performance patterns effortlessly.
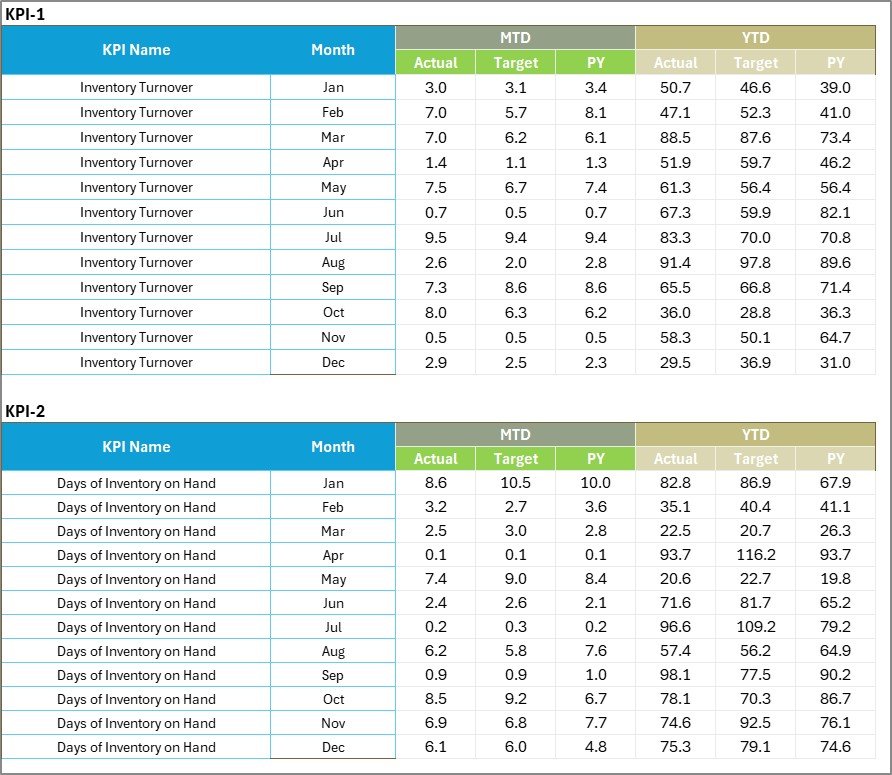
3️⃣ Input Data Sheet: The database behind your visuals — input Actual, Target, and Previous Year values to keep everything updated automatically.
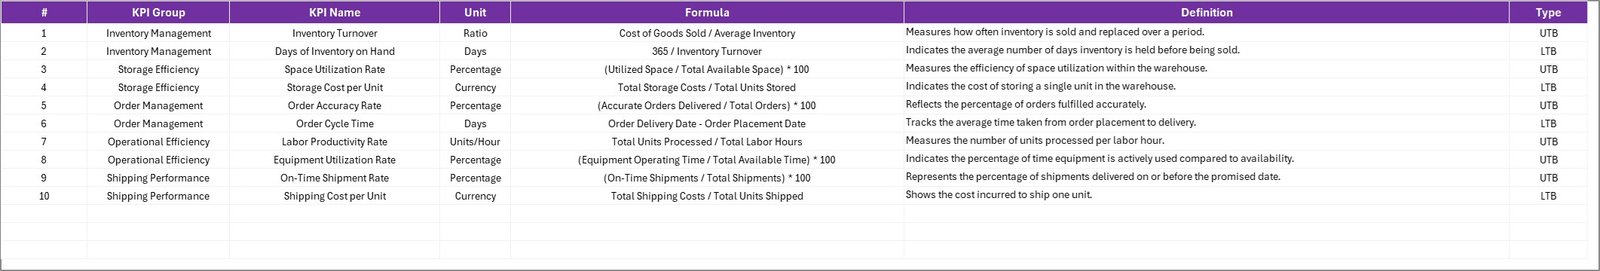
4️⃣ KPI Definition Sheet: A transparent guide defining each KPI, including formulas, type (UTB/LTB), and unit of measurement for consistent understanding.
This well-structured format ensures every department can align on how performance is measured and reported.
🧭 How to Use the Warehouse Management KPI Scorecard in Excel
Using the scorecard is quick and straightforward:
✅ Step 1: Define your KPIs — choose metrics like order accuracy, inventory turnover, and shipment timeliness.
✅ Step 2: Enter data in the Input Sheet for each month (Actual, Target, PY).
✅ Step 3: Analyze insights on the Scorecard Sheet for quick performance snapshots.
✅ Step 4: Use the Trend Sheet to evaluate historical patterns and identify growth areas.
✅ Step 5: Take corrective actions and update regularly for continuous improvement.
Within minutes, you’ll have an interactive KPI scorecard that simplifies your warehouse reporting and decision-making process.
👥 Who Can Benefit from This Warehouse Management KPI Scorecard
🚚 Warehouse Managers: Track KPIs, reduce bottlenecks, and improve team efficiency.
🏭 Operations Heads: Monitor productivity and performance trends across multiple facilities.
📦 Supply Chain Professionals: Gain real-time visibility into order accuracy and inventory control.
📊 Analysts and Planners: Leverage visual trends for data-driven forecasting.
💼 Business Owners: Get instant insights into cost efficiency and service quality.
Whether you’re managing a small warehouse or a multi-location operation, this template scales perfectly to your needs.
🎯 Why Choose This Excel Template?
-
Created by NextGenTemplates.com, trusted for professional Excel tools.
-
Designed for both beginners and experts — no macros or coding needed.
-
Fully editable, printable, and presentation-ready.
-
A cost-effective alternative to expensive software dashboards.
Turn warehouse data into business growth insights — all within a simple, familiar Excel interface.
🔗 Click here to read the Detailed blog post
Watch the step-by-step video tutorial:


Reviews
There are no reviews yet.