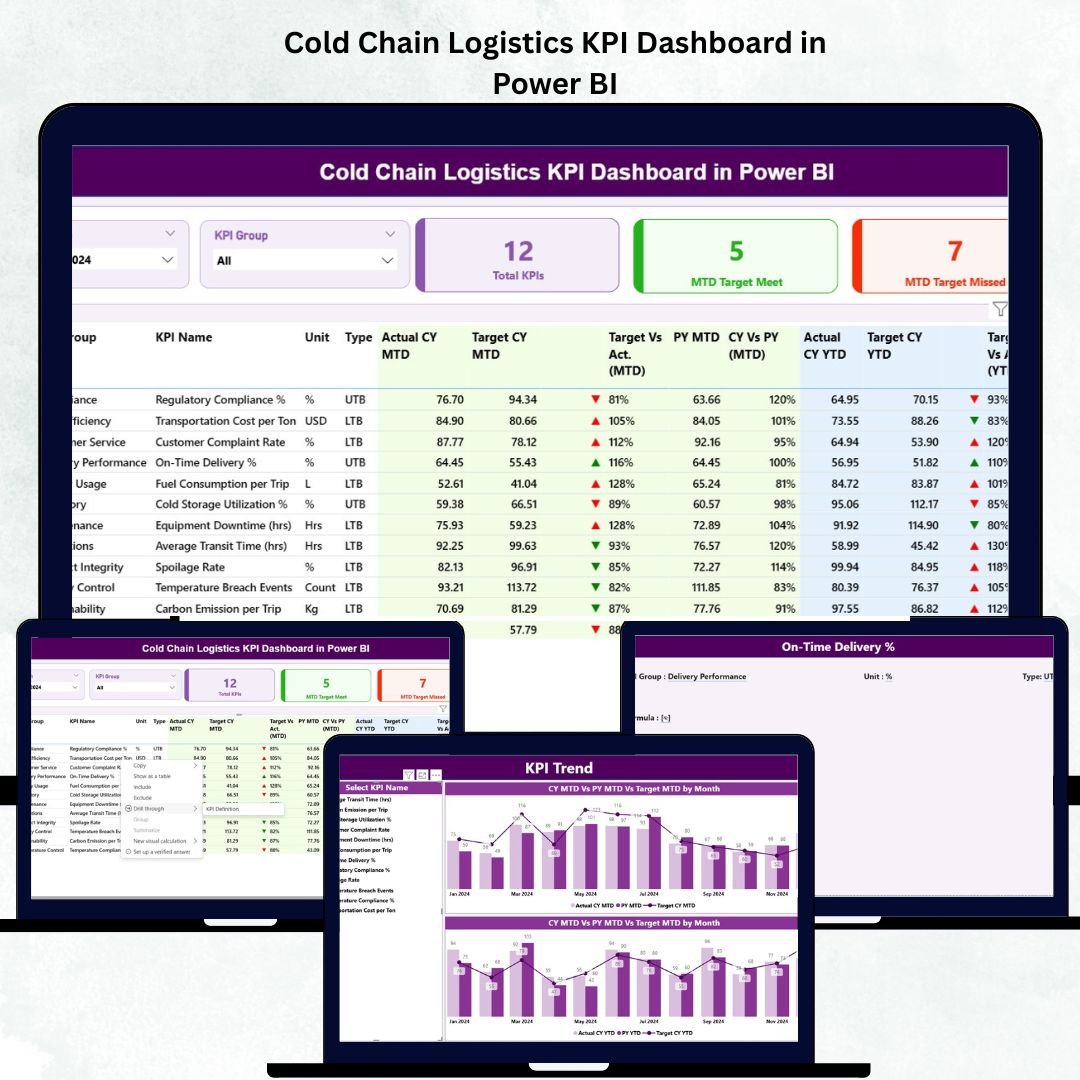
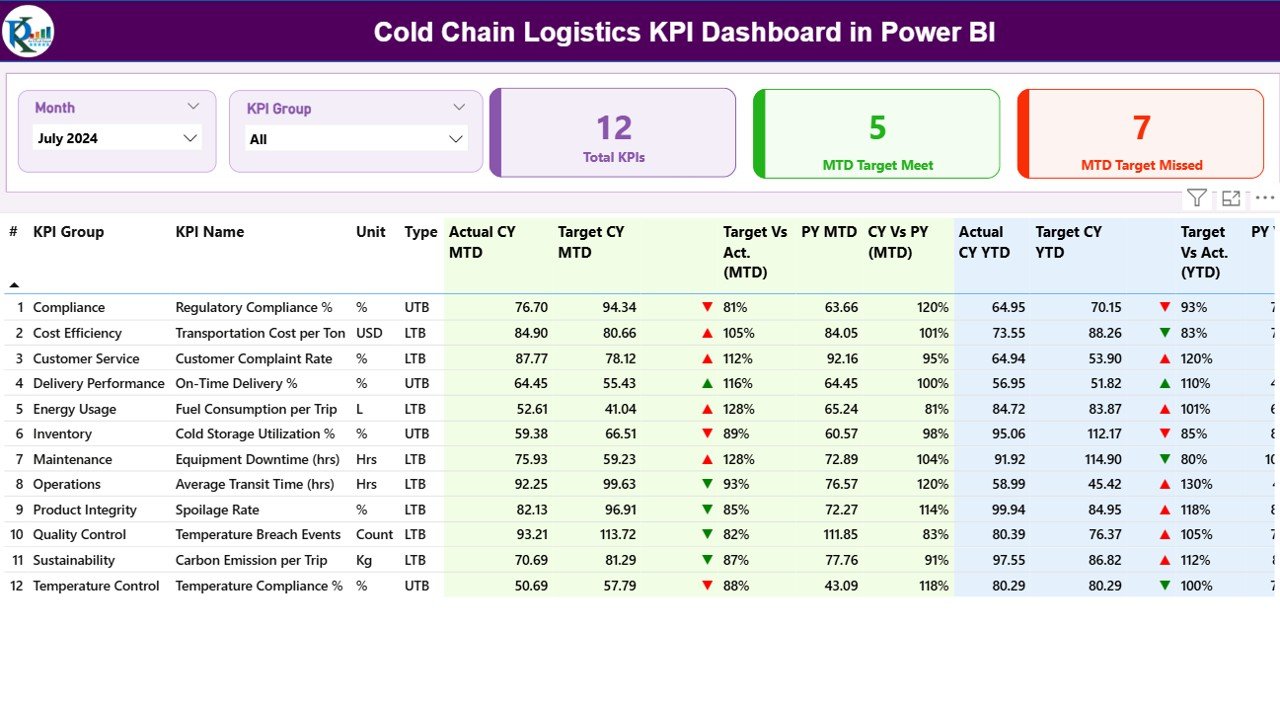
In the temperature-sensitive world of logistics, precision and timing mean everything. When you’re transporting vaccines, frozen foods, or pharmaceutical supplies, a few degrees can make all the difference. The Cold Chain Logistics KPI Dashboard in Power BI is your ultimate performance tracking solution — designed to give logistics teams complete control, visibility, and confidence in their cold chain operations. 🚚❄️Cold Chain Logistics KPI Dashboard in Power BI
This ready-to-use Power BI dashboard transforms your logistics data into smart visuals, real-time insights, and actionable performance indicators — all at a glance. Whether you’re managing warehouses, transportation routes, or last-mile delivery, this dashboard helps you ensure temperature compliance, prevent spoilage, and optimize cost efficiency effortlessly.
⚙️ Key Features of Cold Chain Logistics KPI Dashboard in Power BI
✅ Real-Time KPI Monitoring: Stay on top of critical metrics like temperature compliance, delivery accuracy, and spoilage rate with dynamic visuals that update automatically.Cold Chain Logistics KPI Dashboard in Power BI
📊 Interactive Slicers: Filter by month, KPI group, or performance type to view focused insights instantly.
📈 Performance Comparison: Analyze MTD (Month-to-Date) and YTD (Year-to-Date) performance, compare with previous years, and spot trends early.Cold Chain Logistics KPI Dashboard in Power BI
🔁 Excel Integration: Seamlessly connects with Excel sheets — simply update your data, and Power BI refreshes automatically.
📍 Target vs Actual Indicators: Green and red arrows instantly show which KPIs are performing well and which need attention.
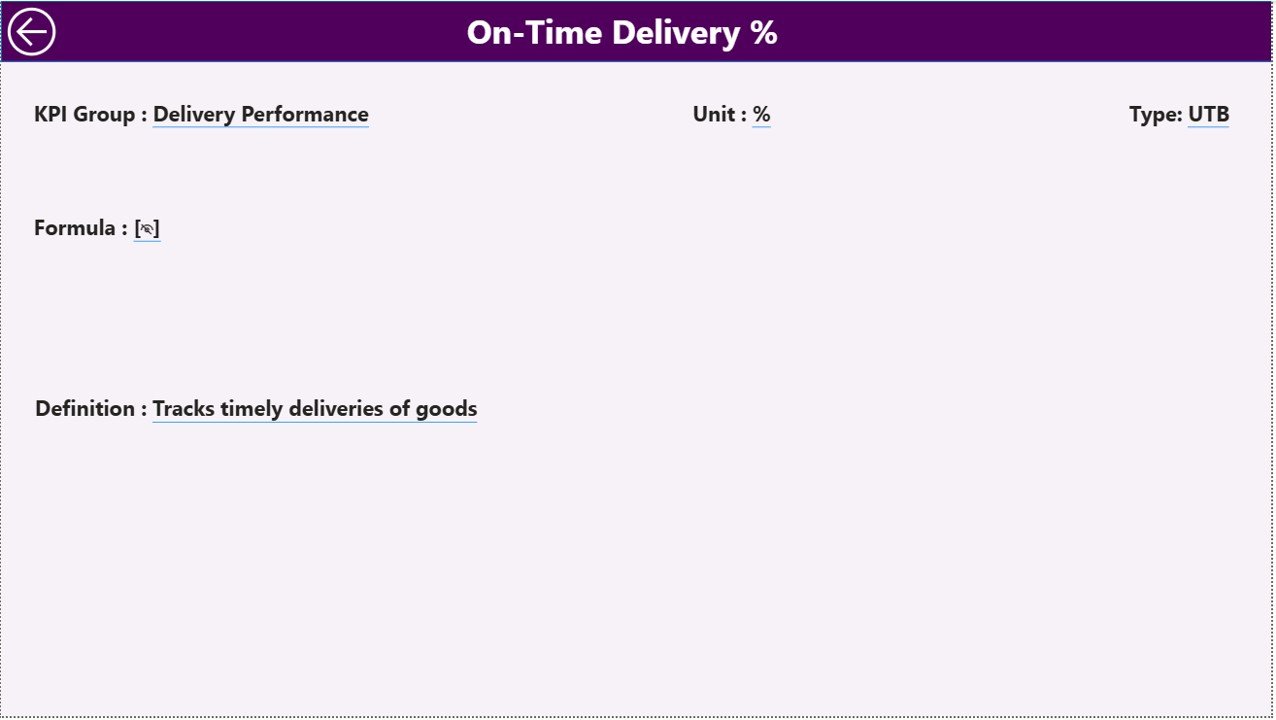
🧾 Detailed KPI Definitions: Includes a reference sheet for KPI Group, Unit, Formula, and Type (UTB/LTB).
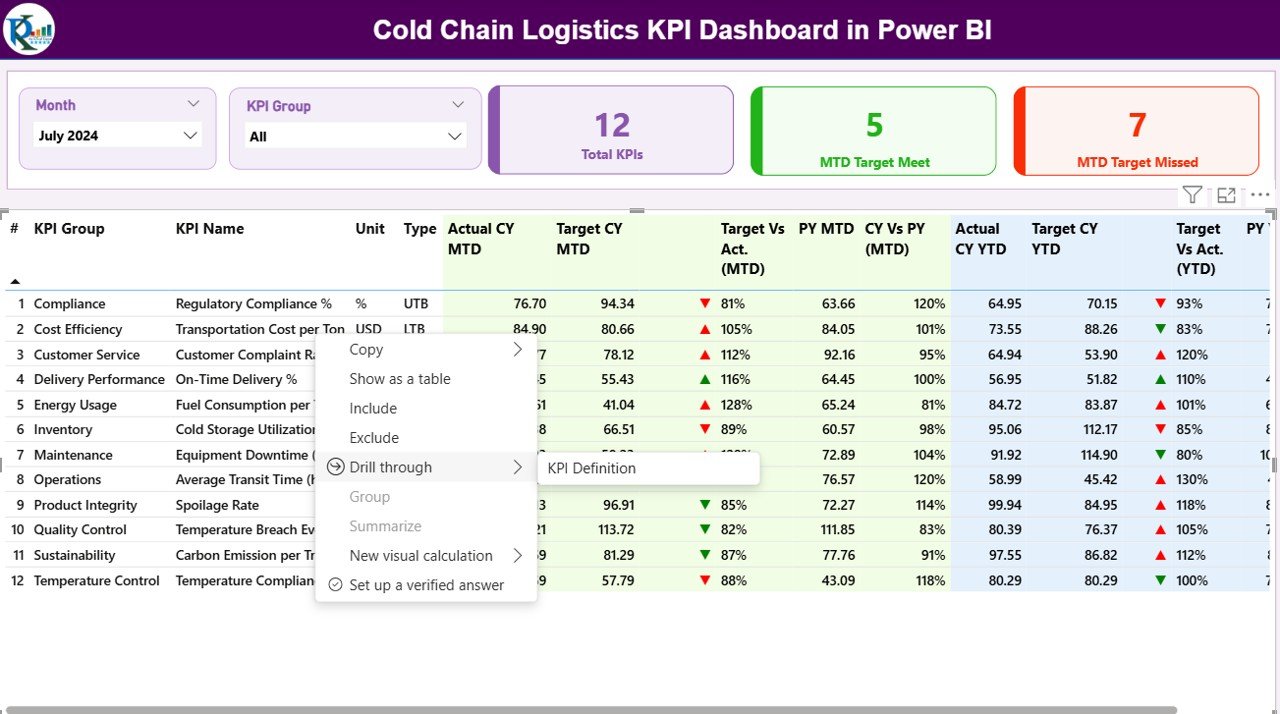
💻 Drill-Through Capability: Click any KPI to explore detailed trends and historical patterns.
🌎 Cloud Access: Access your dashboard from any device, anywhere, ensuring 24×7 monitoring.
🔒 Secure and Shareable: Role-based permissions allow safe data sharing with stakeholders.
📦 What’s Inside the Cold Chain Logistics KPI Dashboard
Inside this Power BI dashboard, you’ll find everything structured for clarity and control:
-
Summary Page:
Get a quick snapshot of overall performance with cards showing Total KPIs Tracked, MTD Target Met, and MTD Target Missed.
Visual tables display KPI names, units, actuals vs targets, and variance icons for instant performance overview. -
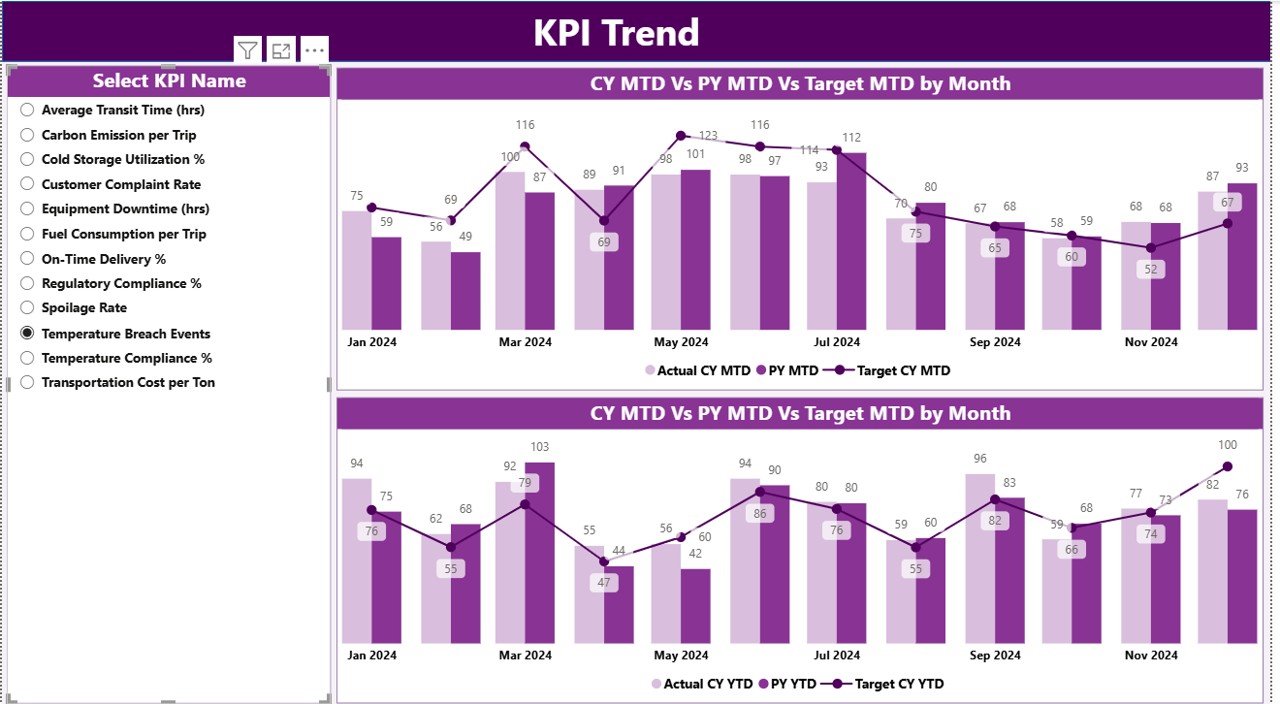
KPI Trend Page:
Track performance over time with combo charts comparing Actual vs Target values for MTD and YTD.
Identify bottlenecks, analyze fluctuations, and forecast future performance.Cold Chain Logistics KPI Dashboard in Power BI -
KPI Definition Page:
Understand every KPI in detail — from definition and formula to performance type (UTB/LTB).
Use this page to maintain KPI consistency and ensure accurate reporting. -
Excel Data Connection:
The dashboard connects with three sheets:-
Input_Actual (Enter Actual values)
-
Input_Target (Enter Target values)
-
KPI Definition (Define KPIs)
Once updated, Power BI automatically refreshes visuals for real-time accuracy.
-
🧭 How to Use the Cold Chain Logistics KPI Dashboard
Using this dashboard is as simple as 1-2-3! 🧩
1️⃣ Prepare Your Data:
Fill in your Actual, Target, and Definition sheets in Excel.
2️⃣ Connect to Power BI:
Link your Excel file and enable automatic refresh for real-time updates.
3️⃣ Explore Insights:
Use filters and slicers to view performance by month, group, or individual KPI.
4️⃣ Drill Down:
Click on KPIs for deeper insights — identify where performance excels or lags.
5️⃣ Act Fast:
Use trend visuals to make data-driven decisions that reduce spoilage and boost efficiency.
No coding, no complex setup — just plug, play, and perform! ⚡
👥 Who Can Benefit from This Cold Chain Logistics KPI Dashboard
🎯 Logistics Managers: Monitor end-to-end cold chain efficiency in real time.
🏭 Warehouse Supervisors: Track storage conditions and delivery accuracy effortlessly.
💊 Pharmaceutical & Healthcare Professionals: Maintain temperature compliance and regulatory standards.
🍦 Food & Beverage Companies: Reduce spoilage, optimize delivery times, and ensure product freshness.
📦 E-Commerce & Retail Firms: Ensure perishable goods reach customers on time and in perfect condition.
📊 Data Analysts & Consultants: Visualize performance patterns and recommend strategic improvements.
If your business relies on temperature control — this dashboard is your digital co-pilot! 🚀


Reviews
There are no reviews yet.