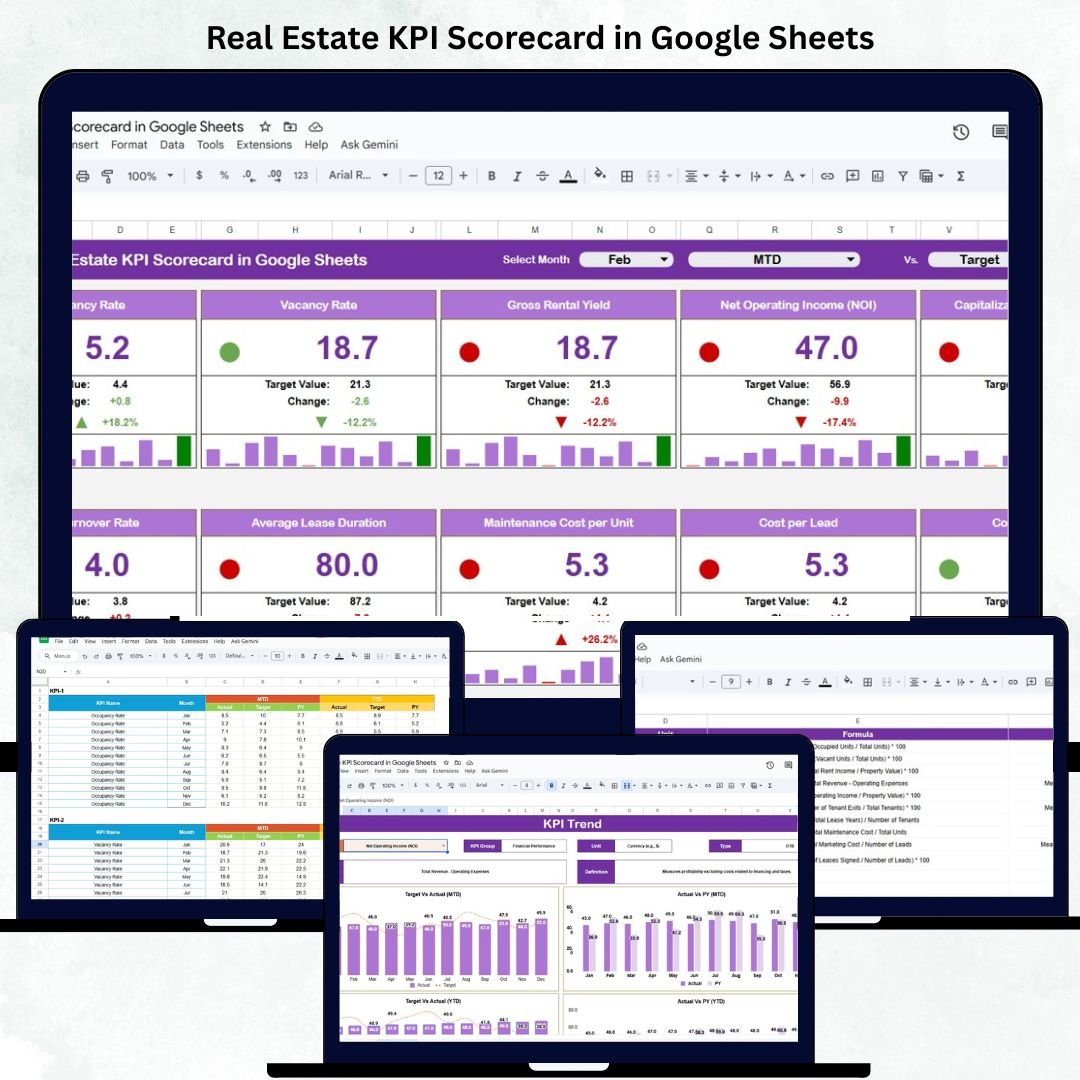
Success in real estate depends on how well you track performance — from property sales and rental income to occupancy rates and marketing ROI. The Real Estate KPI Scorecard in Google Sheets is a ready-to-use, automated, and data-driven template that empowers real estate professionals to measure, analyze, and optimize performance across all key business areas. 🏠📈
Built entirely in Google Sheets, this scorecard consolidates essential real estate metrics into a visual and interactive dashboard, enabling you to make faster, smarter, and data-backed decisions.
Whether you manage residential portfolios, commercial properties, or real estate agencies, this scorecard helps you stay on top of sales, revenue, occupancy, and customer satisfaction — all in one place.
🔑 Key Features of the Real Estate KPI Scorecard in Google Sheets
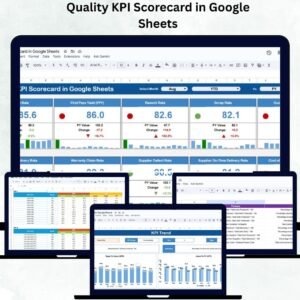
📋 Dashboard Sheet Tab (Main Performance View)
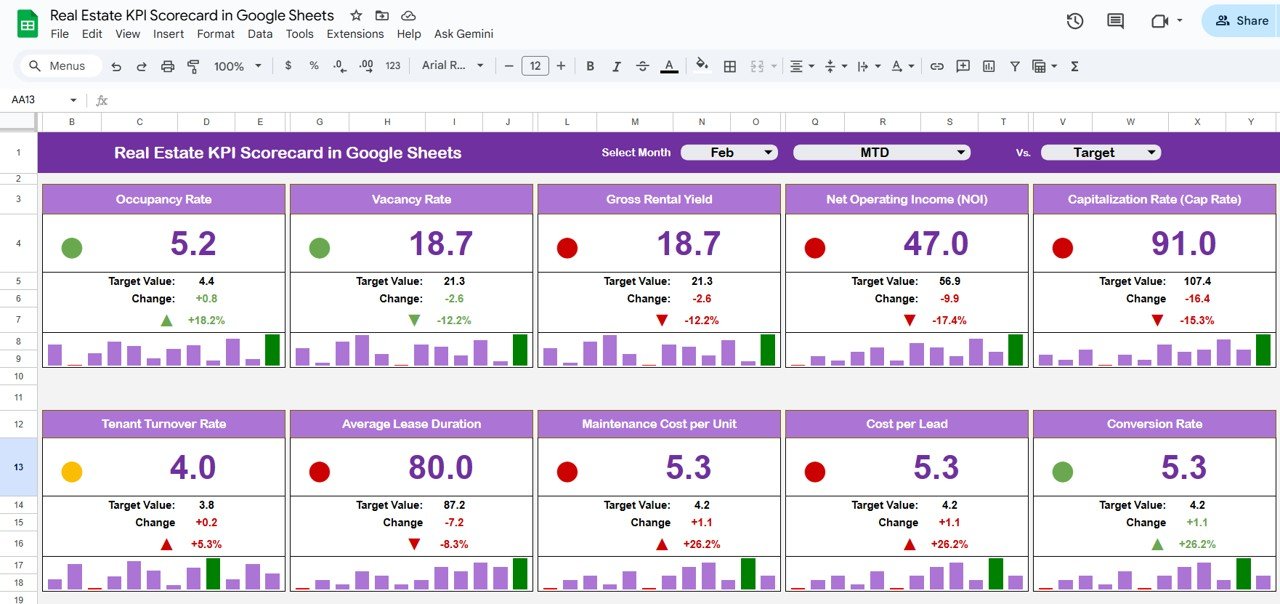
The central interface that displays key real estate performance indicators with dynamic visuals.
-
View Month-to-Date (MTD) and Year-to-Date (YTD) metrics at a glance.
-
Instantly compare Actual vs Target vs Previous Year results.
-
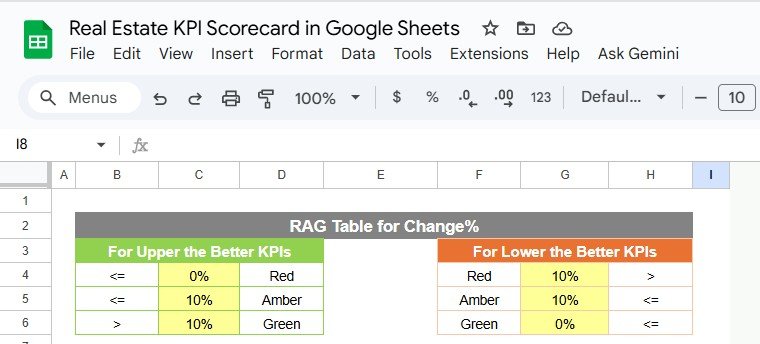
Color-coded traffic lights and arrows indicate performance trends:
-
🟢 Green = Improvement
-
🔴 Red = Decline
-
🟡 Yellow = Stable
-
This automated view helps property managers and brokers identify strong and weak performance areas instantly.
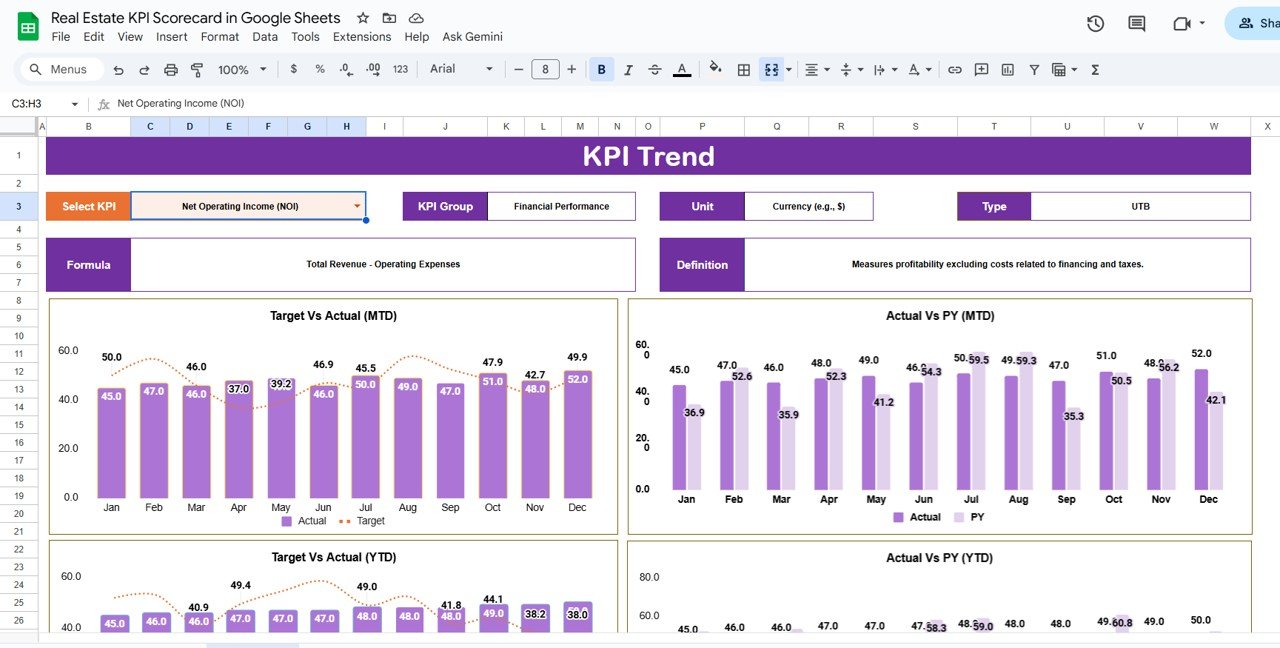
📈 KPI Trend Sheet Tab
Track performance over time with historical trend charts.
-
Select any KPI (dropdown in cell C3) to analyze its growth and variation month-by-month.
-
Displays complete KPI details:
-
KPI Group
-
Unit of Measurement
-
Type (UTB – Upper the Better / LTB – Lower the Better)
-
Formula
-
Definition
-
-
Provides deeper insights into long-term business performance.
🧾 Input Data Sheet Tab
This is where you record raw performance data such as sales, expenses, occupancy, and customer satisfaction.
-
Enter monthly figures for each KPI.
-
Automatically updates dashboard metrics and visuals.
-
Perfect for collaborative data entry among team members.
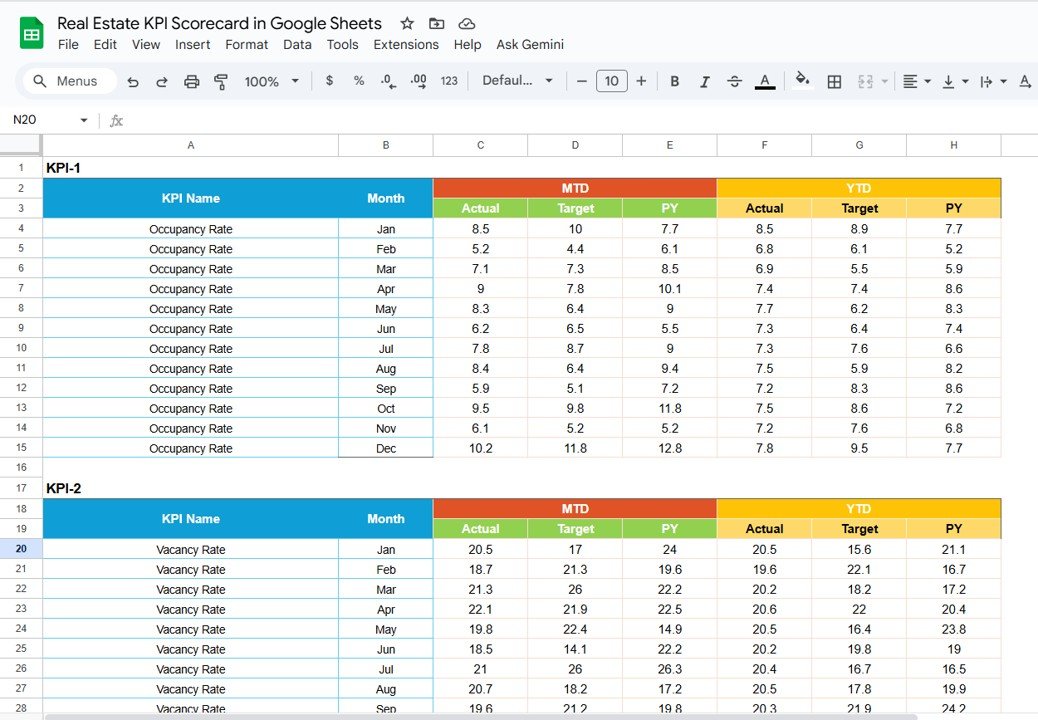
📊 Actual Numbers Sheet Tab
-
Enter actual KPI values monthly and YTD.
-
Enables accurate comparison between targets, actual results, and historical data.
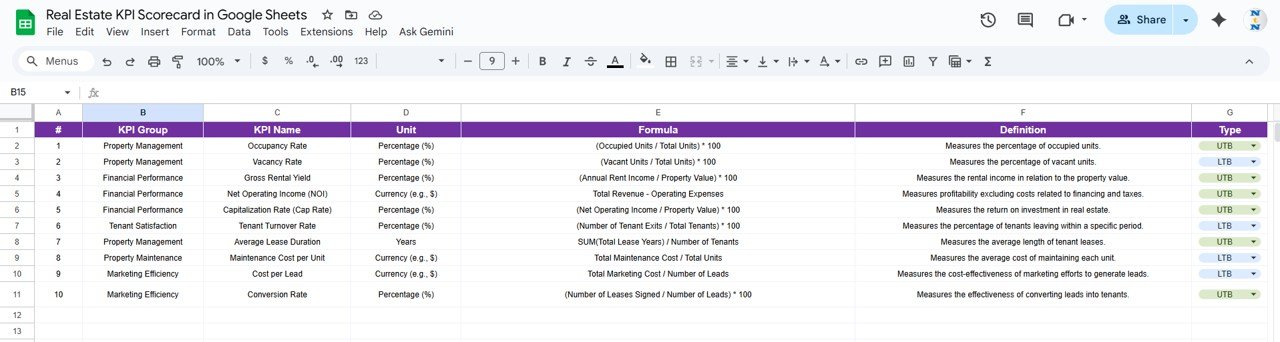
📘 KPI Definition Sheet Tab
Clearly defines all KPIs used in the scorecard — including KPI Group, Unit, Formula, Definition, and Type (UTB/LTB).
This ensures clarity, consistency, and accuracy in performance reporting.
📦 What’s Inside the Real Estate KPI Scorecard
✅ Fully functional Google Sheets file – plug-and-play ready
✅ Dynamic Dashboard – MTD/YTD performance at a glance
✅ Trend Charts – Track KPI growth over time
✅ Target vs Actual Comparison – Identify performance gaps
✅ Visual Indicators – Traffic lights & arrows for instant insights
✅ Editable KPI Library – Add or modify KPIs anytime
✅ Cloud Collaboration – Real-time multi-user access
✅ PDF Export – Share professional reports with clients or management
Everything is automated and preformatted — simply input data and the dashboard updates instantly. ⚙️
🧑💼 Who Can Benefit from This Scorecard
🏢 Real Estate Agencies – Measure agent performance, sales, and revenue.
🏘️ Property Managers – Track occupancy rates, maintenance costs, and ROI.
💼 Developers & Investors – Analyze project performance and profitability.
📊 Marketing Teams – Monitor campaign ROI and lead conversions.
Designed for both small teams and large enterprises, this scorecard ensures data-driven decision-making and improved business transparency.
🧪 How to Use the Real Estate KPI Scorecard
1️⃣ Enter Data: Input monthly KPIs in the Input Data Sheet.
2️⃣ Define Targets: Record targets in the KPI Definition Sheet.
3️⃣ Analyze Dashboard: Review automated charts and KPIs.
4️⃣ Track Trends: Use the KPI Trend Tab to see month-over-month performance.
5️⃣ Share Insights: Export as a PDF or collaborate live with your team.
💡 Pro Tip: Integrate Google Forms for automated data collection or add scripts for automated reporting!
🌟 Why Choose This Scorecard
-
Real-time performance monitoring
-
Comprehensive KPI coverage for all real estate operations
-
Fully customizable to your portfolio or business structure
-
100% cloud-based — access anytime, anywhere
-
No complex setup — ready in minutes
-
Perfect for managers, analysts, and executives
The Real Estate KPI Scorecard in Google Sheets turns complex property data into clear, actionable insights — helping you improve performance, profitability, and growth. 🌟
🔗 Click here to read the Detailed blog post
Watch the step-by-step video Demo:


Reviews
There are no reviews yet.