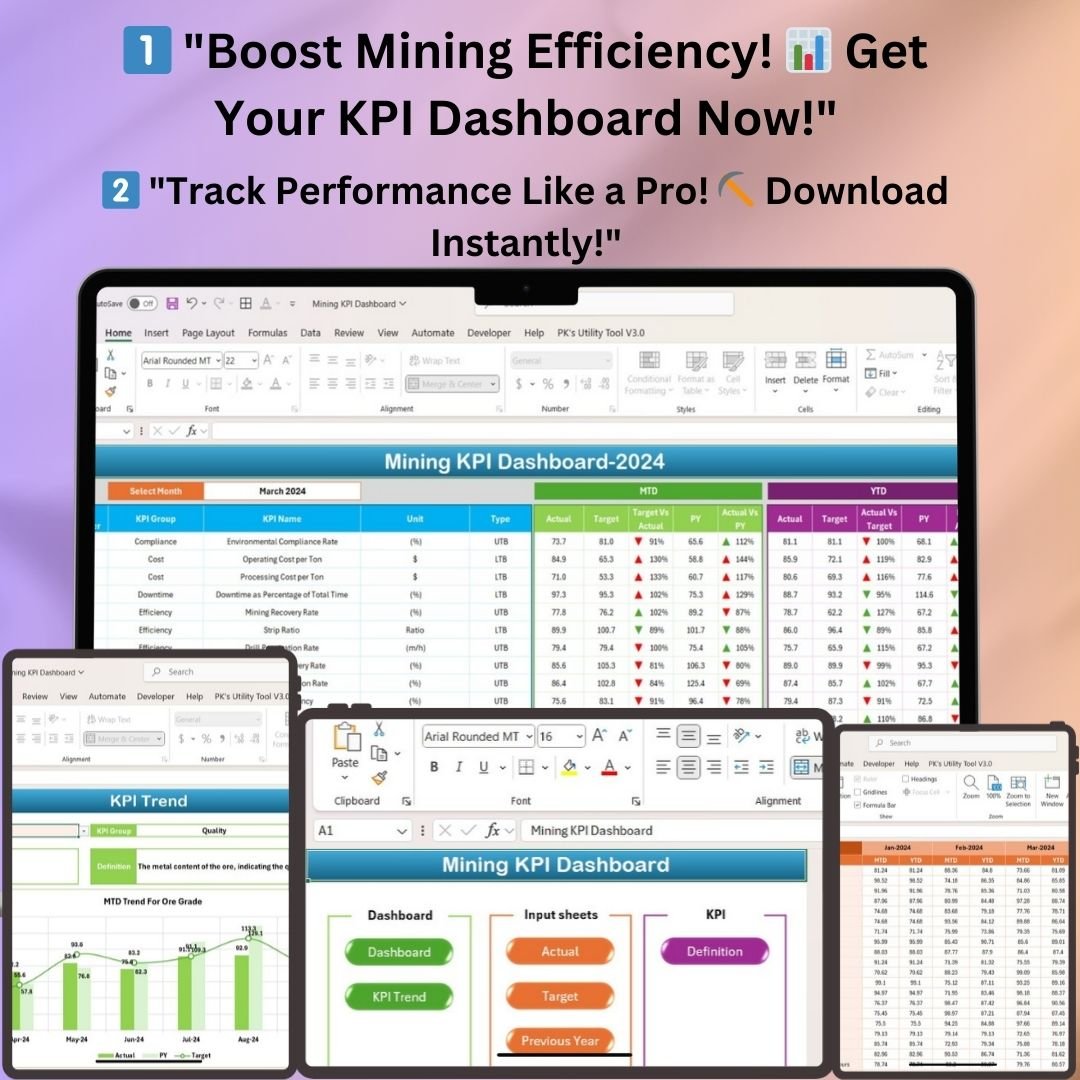
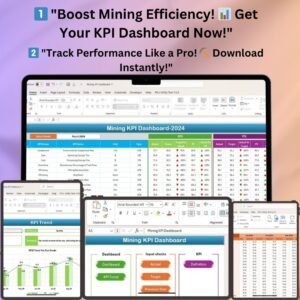
The Mining KPI Dashboard in Excel is an advanced performance tracking tool designed for mining operations, enabling businesses to monitor key performance indicators (KPIs) with real-time insights, visual trends, and data-driven decision-making. This user-friendly dashboard ensures optimal operational efficiency, safety compliance, and financial performance by providing MTD (Month-to-Date) and YTD (Year-to-Date) data, target comparisons, and historical performance insights.
With easy navigation, interactive charts, and automated calculations, this Excel-based dashboard helps you streamline reporting and enhance strategic planning. Whether you’re managing production output, cost per ton, safety incidents, or equipment utilization, this tool is your go-to mining performance solution!
Key Features & Functionalities
📌 Home Sheet – Your Navigation Hub
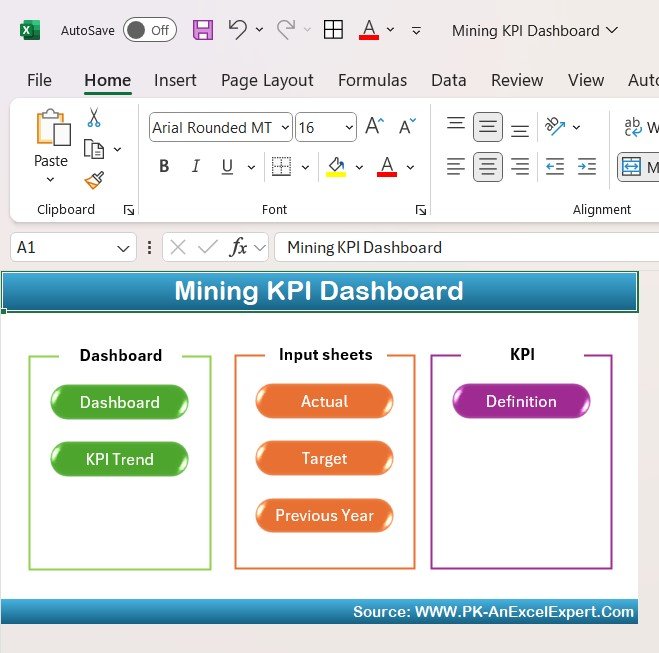
The Home Sheet acts as the control center for the entire dashboard.
- Provides quick access to all key sections, including the Dashboard, KPI Trend, and Data Input Sheets.
- Designed with user-friendly navigation buttons for easy interaction.
- Acts as a centralized menu for monitoring mining operations effortlessly.
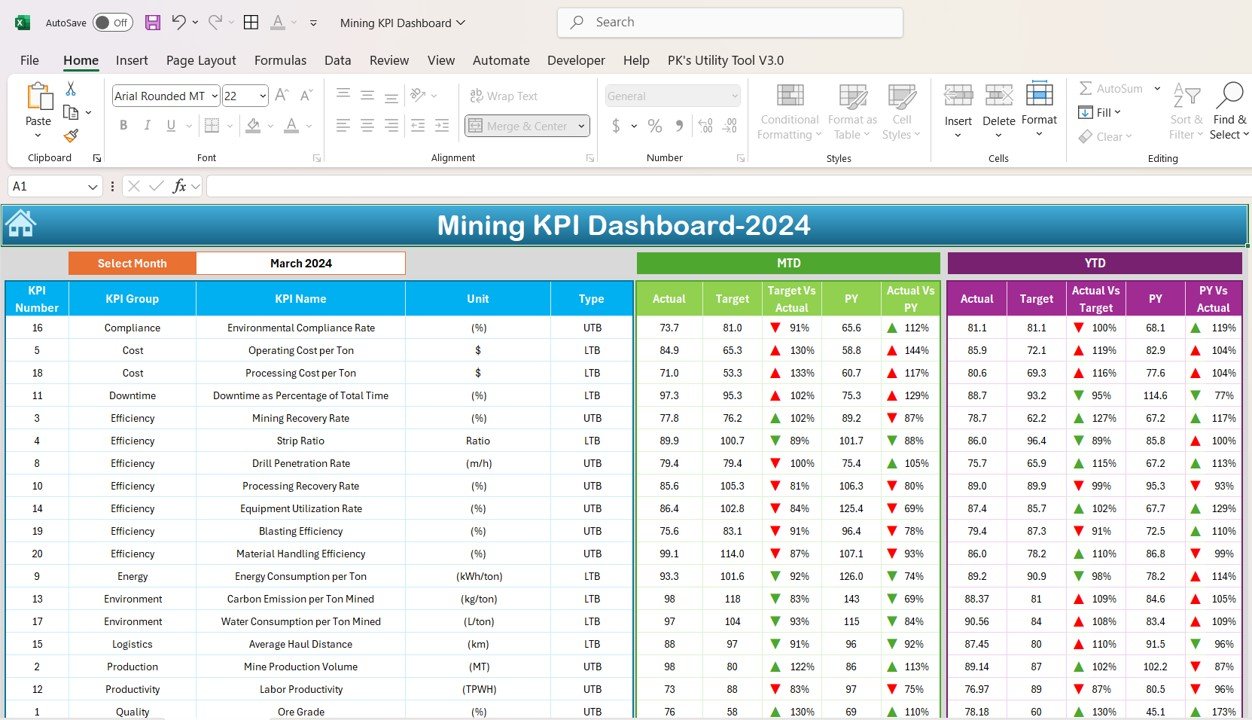
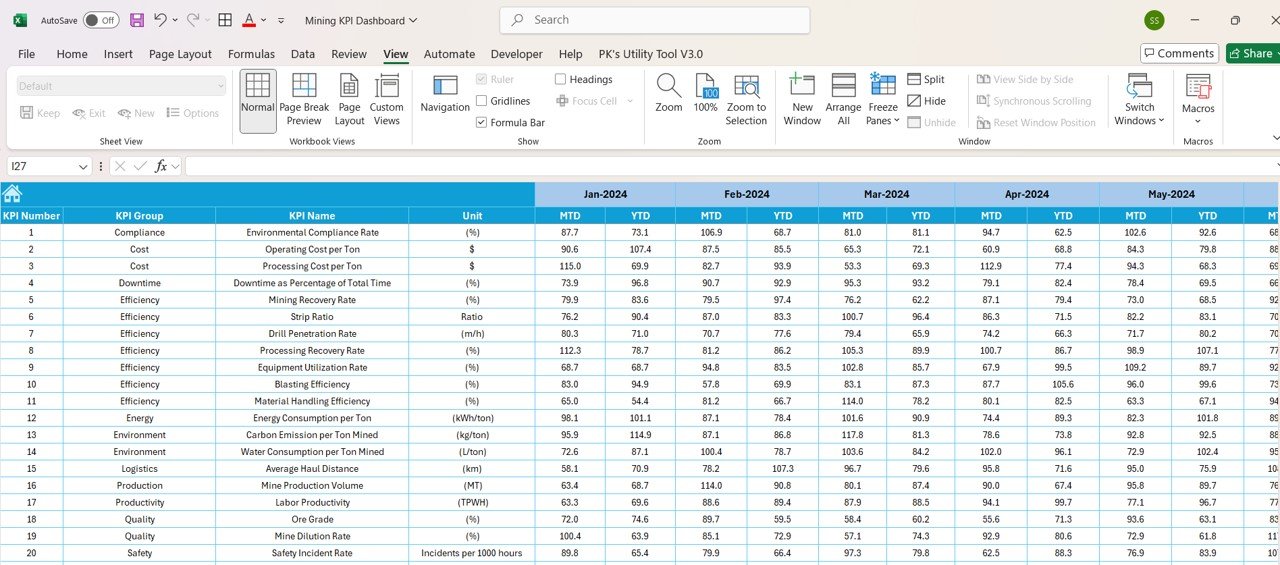
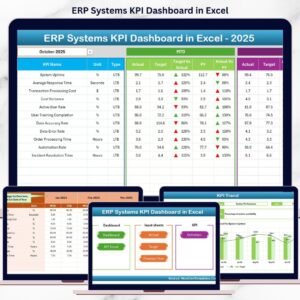
📊 Dashboard Sheet – Real-Time Mining KPI Insights
The Dashboard Sheet is the heart of the system, offering a visual snapshot of mining performance.
- Comprehensive KPI Overview: Displays all key MTD & YTD metrics in a structured format.
- Target vs. Actual Comparison: Track actual performance against predefined targets to measure efficiency.
- Previous Year vs. Actual Data: Compare current performance with historical trends to evaluate improvements.
- Conditional Formatting: Color-coded indicators (up/down arrows) highlight performance trends instantly.
- Dynamic Monthly Selection: Choose any month from the dropdown menu, and the data updates automatically.
🔹 Example KPIs Tracked:
✔️ Production Output (Tons)
✔️ Cost per Ton
✔️ Equipment Utilization Rate
✔️ Safety Incidents
✔️ Energy Consumption
✔️ Ore Grade Percentage
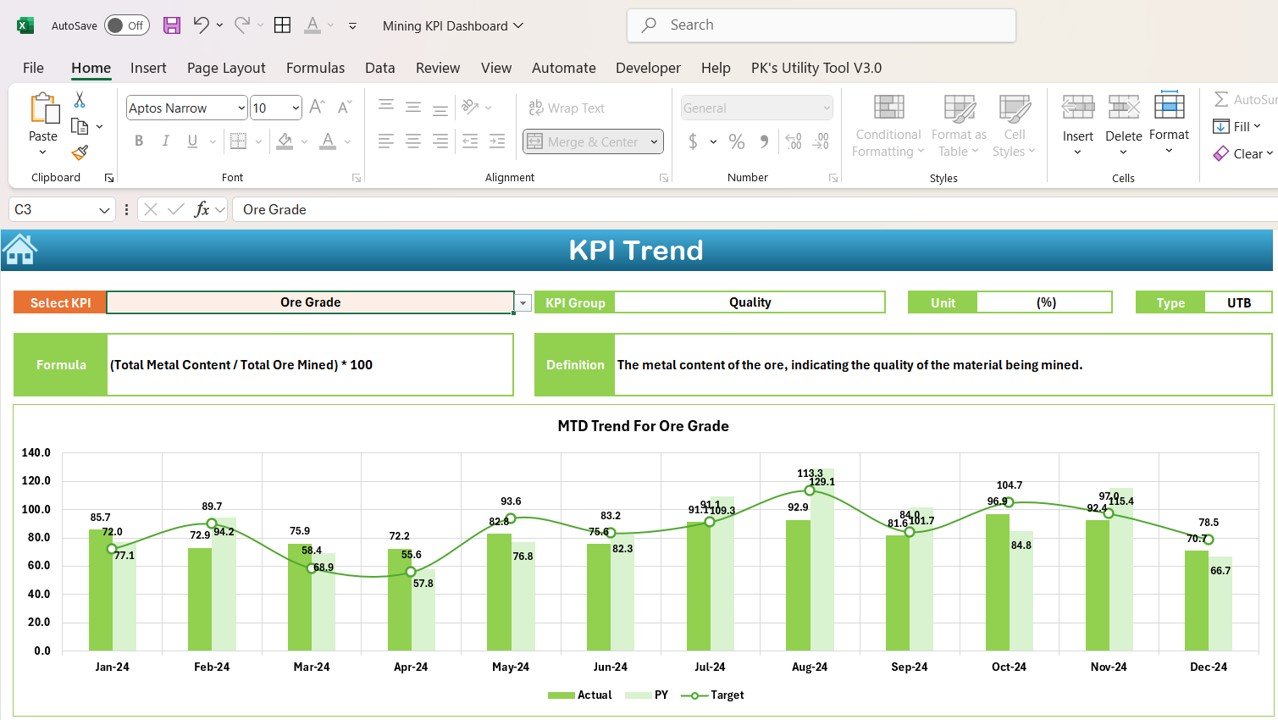
📈 KPI Trend Sheet – Analyze Long-Term Trends
The KPI Trend Sheet enables users to drill down into detailed trend analysis for each KPI.
- Select a specific KPI from the dropdown list to view its historical trends.
- Displays MTD and YTD performance trends using interactive charts.
- Identifies seasonal patterns, operational inefficiencies, and opportunities for process improvement.
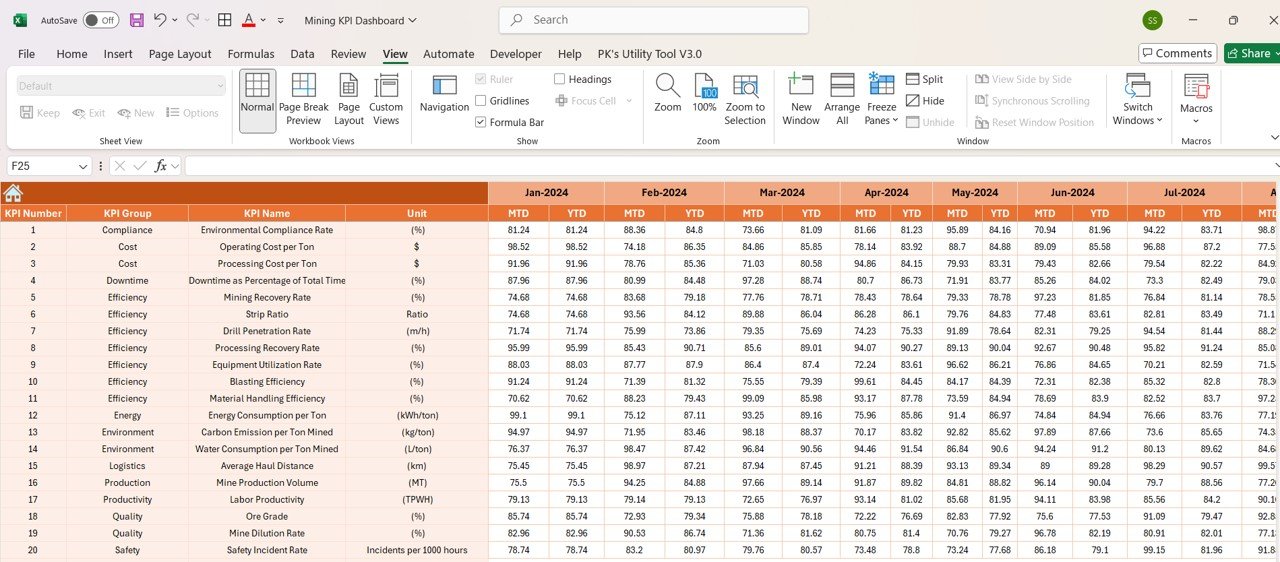
📥 Actual Numbers Input Sheet – Enter & Update Data Easily
- Automated Data Entry: Simply update the MTD and YTD values, and the dashboard reflects real-time changes.
- Month Selection Feature: Change the month in the dropdown menu, and all reports update dynamically.
- Ensures Accuracy: Eliminates manual errors by providing structured data input fields.
🎯 Target Sheet – Define Your KPI Goals
- Set monthly and annual targets for each KPI.
- Helps in performance benchmarking and identifying areas for improvement.
- Provides a clear gap analysis between actual results vs. target goals.
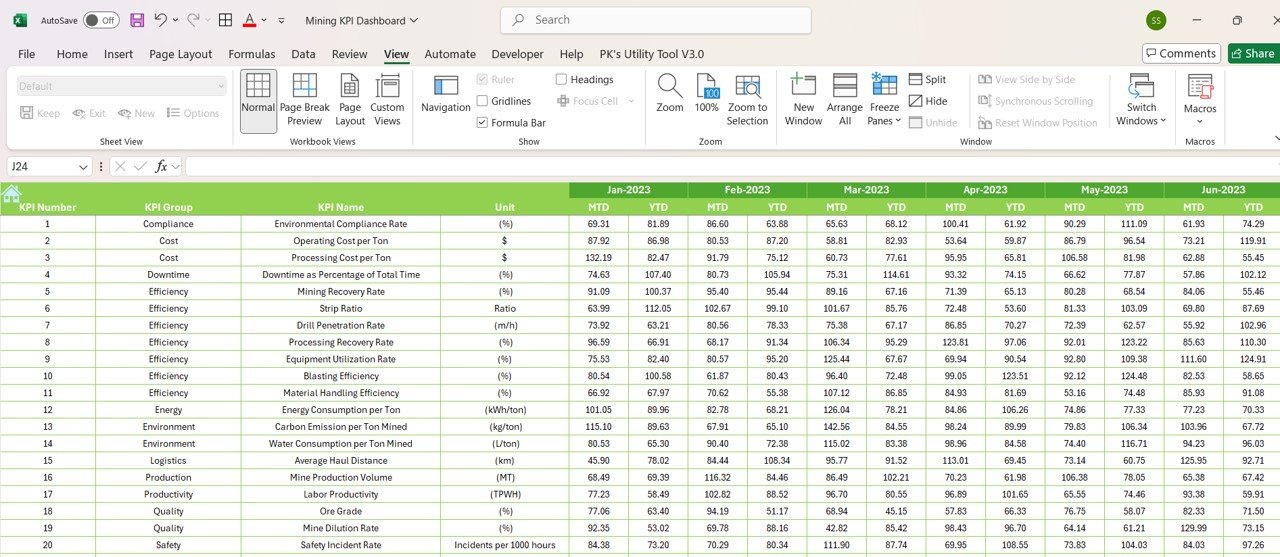
📊 Previous Year Number Sheet – Compare Past & Present Performance
- Stores historical data to analyze year-over-year performance.
- Identify growth trends and areas needing optimization.
- Assists in predictive analysis and long-term strategy planning.
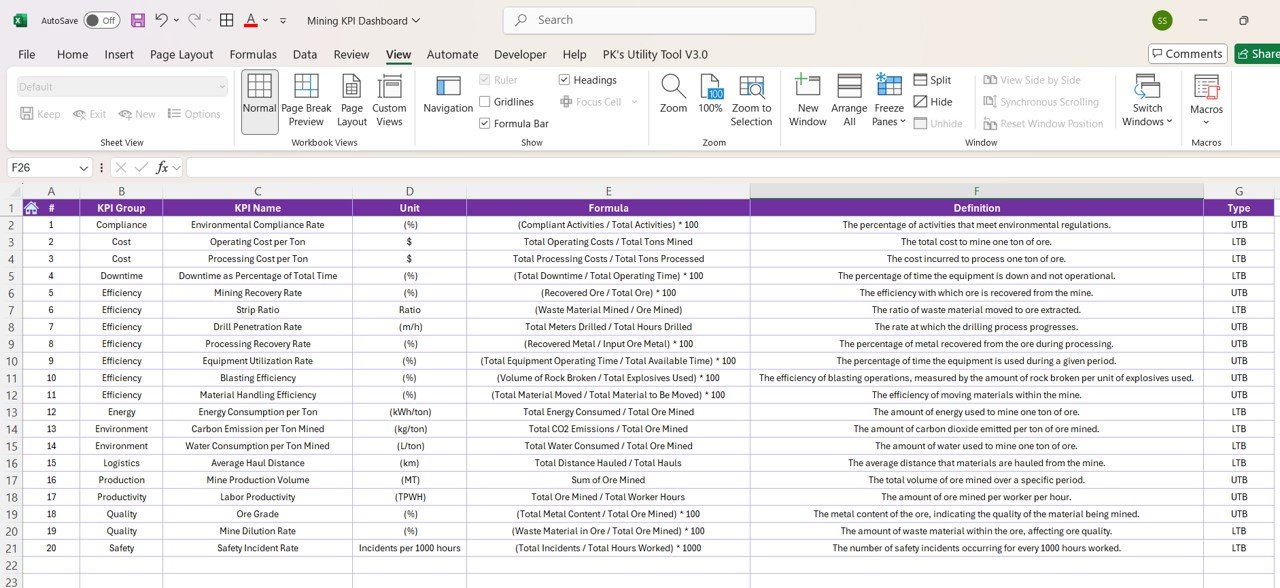
📖 KPI Definition Sheet – Your KPI Reference Guide
The KPI Definition Sheet serves as a knowledge base for understanding key metrics.
- Lists all tracked KPIs with detailed definitions and formulas.
- Ensures standardized reporting across departments.
- Useful for training new employees on mining KPIs and performance tracking.
Why Choose This Mining KPI Dashboard?
✅ 100% Automated & Dynamic – No complex formulas required! Simply update the input sheets and see real-time insights.
✅ User-Friendly & Customizable – Easily modify KPI names, targets, and data ranges to suit your mining operations.
✅ Instant Performance Monitoring – Identify bottlenecks and optimize mining processes with ease.
✅ Excel-Based Flexibility – No need for additional software; works in Microsoft Excel 2016+.
✅ Industry-Specific KPI Tracking – Includes essential mining-related metrics for better resource planning.
Who Can Use This Dashboard?
🔹 Mine Managers – Track daily production, equipment efficiency, and safety compliance.
🔹 Operations Teams – Analyze cost per ton, energy usage, and workforce productivity.
🔹 Financial Analysts – Monitor mining financial KPIs and cost control strategies.
🔹 Project Managers – Compare project performance against past years and target values.
Click hare to read the Detailed blog post
Visit our YouTube channel to learn step-by-step video tutorials


Reviews
There are no reviews yet.