

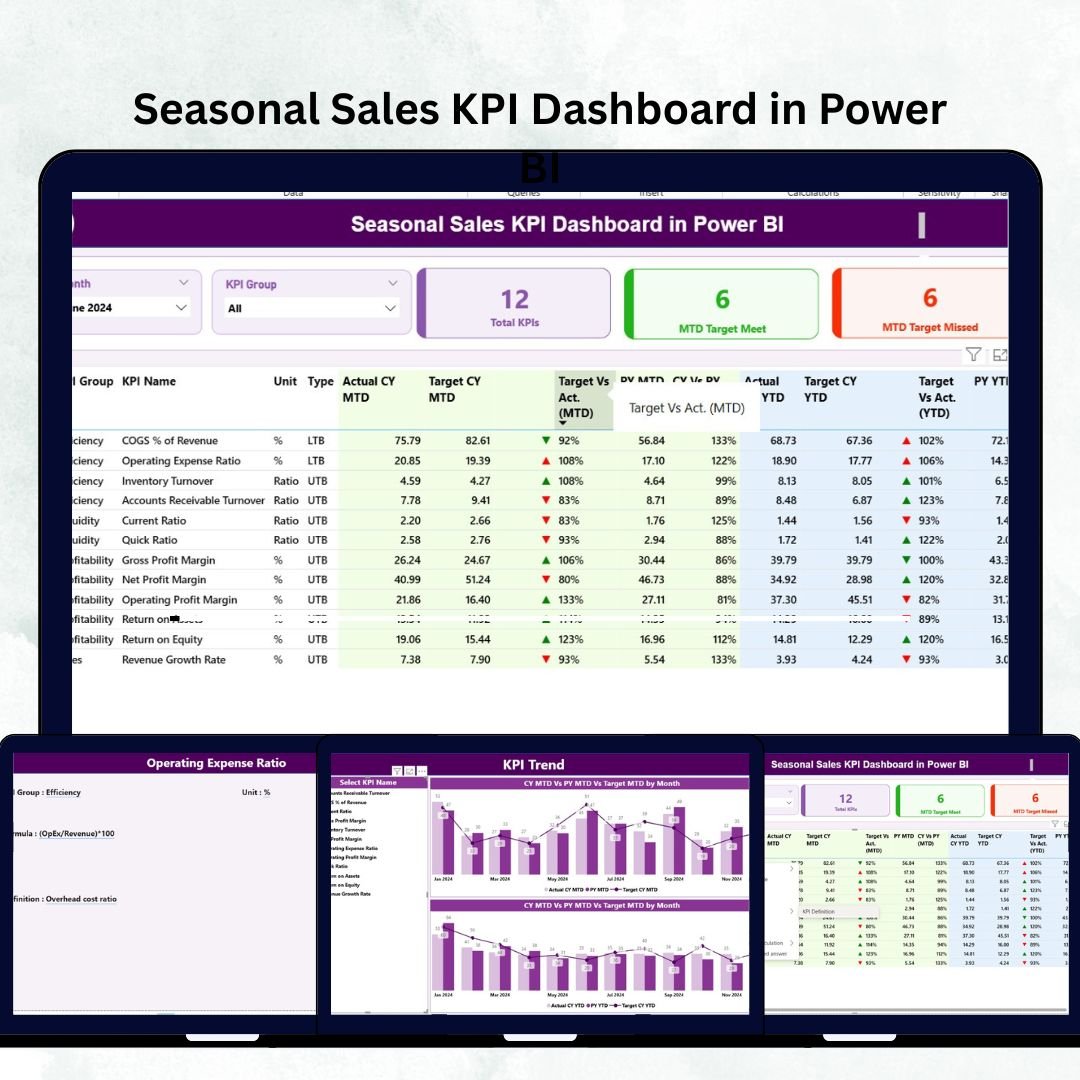

The Seasonal Sales KPI Dashboard in Power BI is your ultimate business intelligence companion — designed to help you unlock sales insights, visualize performance trends, and make smarter seasonal decisions. Whether your business thrives during the holidays, tourist peaks, or back-to-school rush, this dashboard transforms your raw data into actionable stories that drive growth and profitability.Seasonal Sales KPI Dashboard in Power BI
🌟 Key Features of the Seasonal Sales KPI Dashboard in Power BI
✨ Dynamic Seasonal Insights: Instantly track your performance across different months and seasons. Power BI’s smart visuals reveal peaks, dips, and hidden opportunities.
📊 Interactive Filters & Slicers: Filter data by month or KPI group to focus only on what matters most.
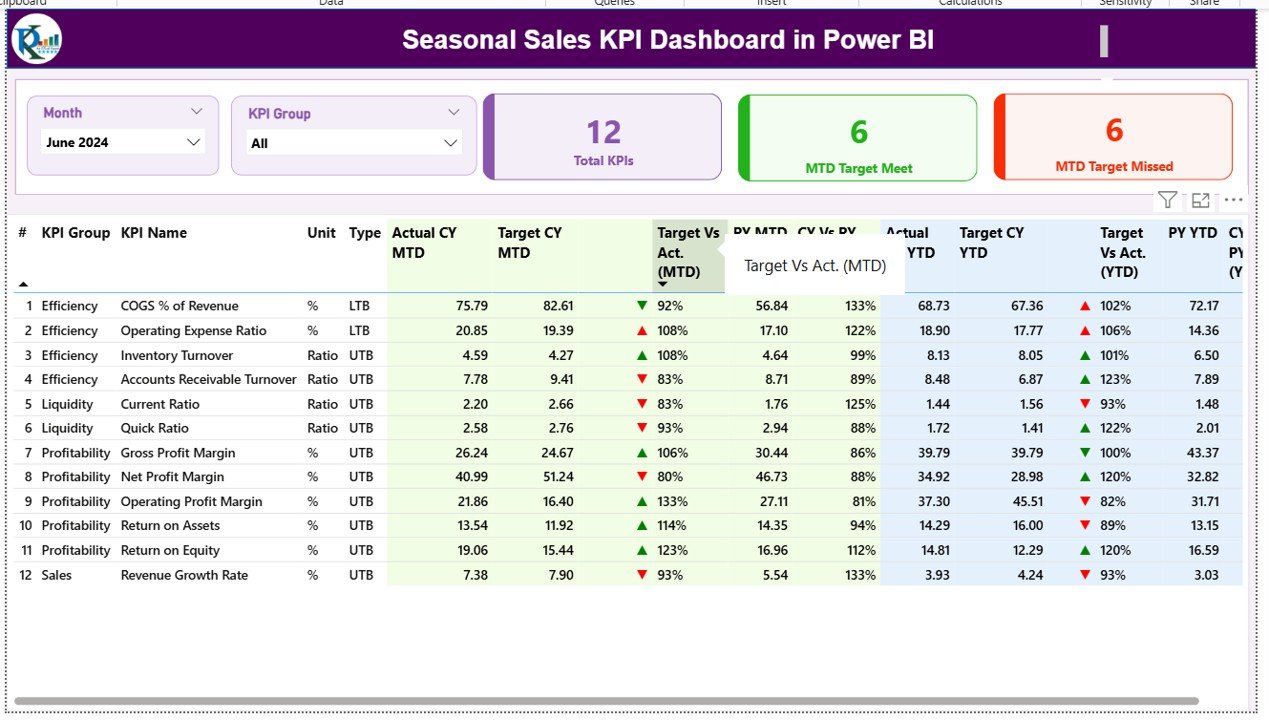
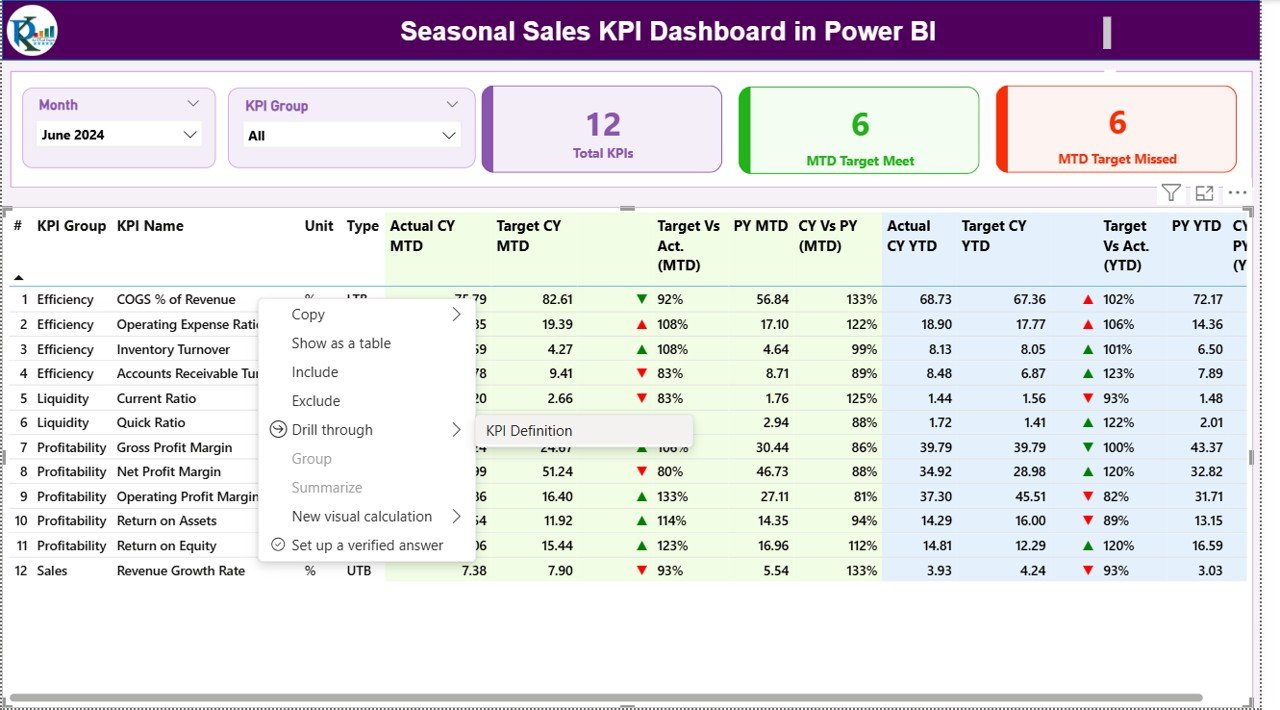
📈 Smart KPI Cards: Get a quick view of total KPIs, MTD target achievements, and missed targets with color-coded indicators.
🧮 Real-Time Target vs Actual Comparison: See exactly where you stand against goals — with green ▲ for improvement and red ▼ for decline.Seasonal Sales KPI Dashboard in Power BI
💡 Excel Integration: Seamlessly linked with your Excel data source for automatic updates and high accuracy.
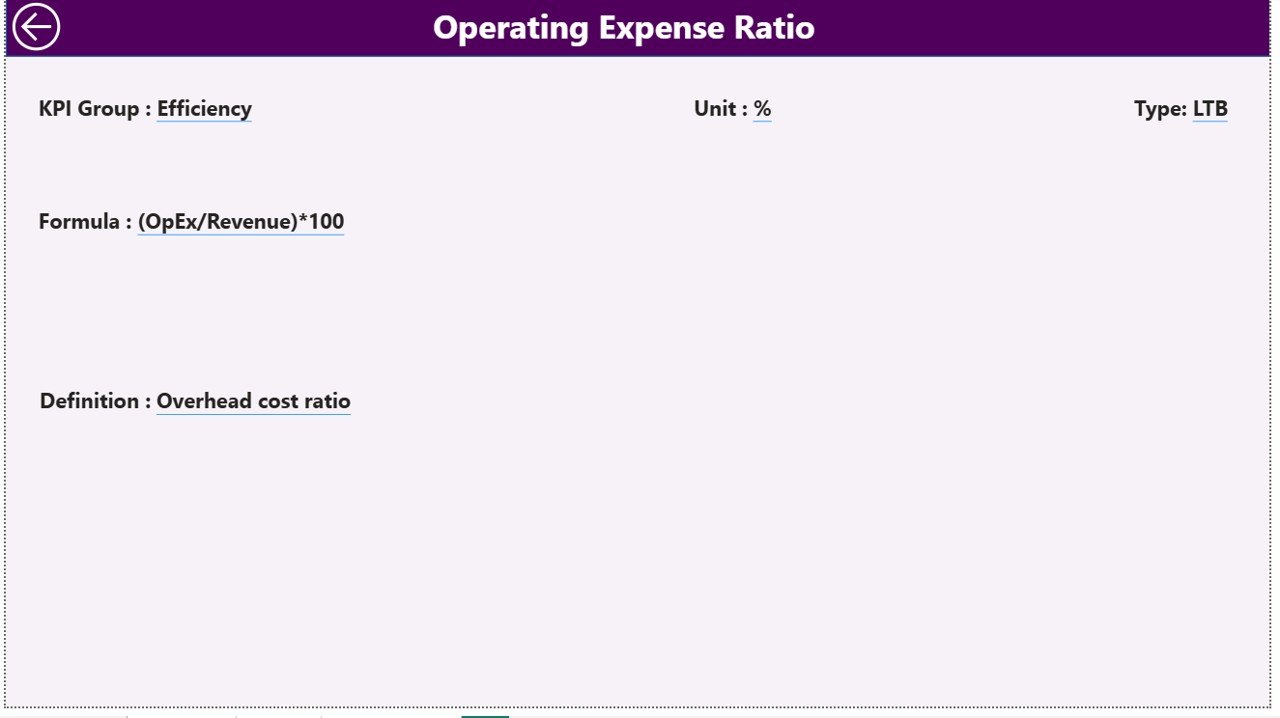
📑 KPI Definitions Page: Access precise KPI formulas, meanings, and logic through the built-in drill-through feature.
🔁 Year-over-Year Analysis: Compare current year vs. previous year data to evaluate progress and seasonal performance changes.
⚙️ Customizable & Scalable: Adapt it for any industry — retail, travel, hospitality, or manufacturing.Seasonal Sales KPI Dashboard in Power BI
📦 What’s Inside the Seasonal Sales KPI Dashboard in Power BI
This ready-to-use Power BI template comes packed with powerful analytical sections designed for clarity and action:
🔹 Summary Page: Your control hub! View overall KPI performance, identify trends, and assess progress at a glance.
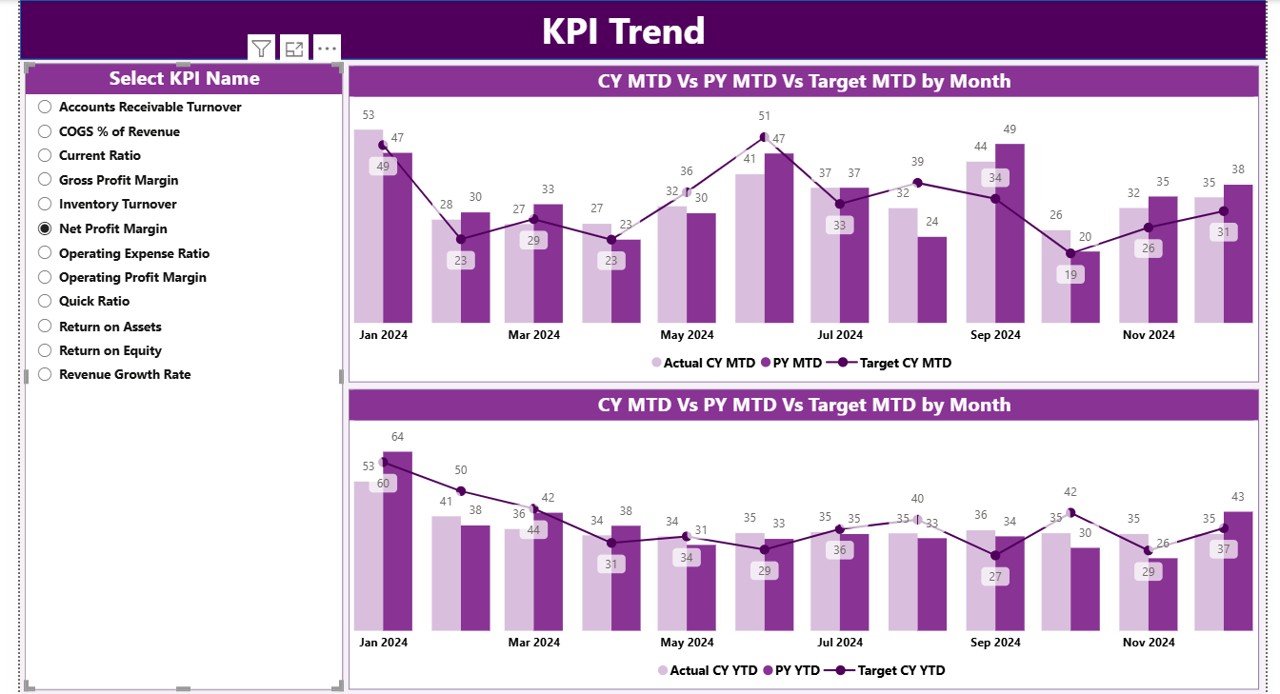
🔹 KPI Trend Page: Dive deep into each KPI’s performance curve through combo charts showing actuals vs. targets vs. previous year.
🔹 KPI Definition Page: A detailed sheet explaining each metric’s definition, unit, and formula for transparent analysis.
🔹 Excel Data Source: Three structured sheets — Input_Actual, Input_Target, and KPI_Definition — make data management effortless.
Every element of this dashboard is built for precision, performance, and ease of use. With automatic refresh capabilities, your visuals always stay up to date.
🧭 How to Use the Seasonal Sales KPI Dashboard in Power BI
🪄 Step 1: Fill your Excel file with monthly actuals and target data.
🔄 Step 2: Refresh the Power BI file to sync new information automatically.
📅 Step 3: Use slicers on the Summary Page to analyze results by month or KPI category.
📊 Step 4: Explore the KPI Trend Page for a deeper month-by-month performance comparison.
🧾 Step 5: Drill through to KPI Definition Page to understand metrics clearly.
🤝 Step 6: Share insights with your team using Power BI Service or embed it in your internal dashboards.
Within minutes, you’ll have a complete, professional dashboard that visualizes your seasonal performance like never before.
🎯 Who Can Benefit from This Seasonal Sales KPI Dashboard
👨💼 Sales Managers: Track seasonal goals and identify which campaigns drive results.
🛍️ Retailers: Understand which products perform best during festive seasons.
✈️ Tourism & Hospitality Businesses: Forecast demand for peak travel months and off-season planning.
🏭 Manufacturers: Align production targets with seasonal sales forecasts.
💻 E-commerce Professionals: Monitor holiday and clearance season performance.
📈 Marketing Teams: Plan promotions and measure campaign effectiveness.
🧠 Business Analysts: Discover insights from real-time visuals and data models.
💼 Decision-Makers: Make faster, data-backed strategic choices to boost ROI.
💎 Why You’ll Love It
✅ Real-Time Updates: Reflects live data from your Excel source.
✅ Easy to Customize: Modify KPIs, visuals, or categories effortlessly.
✅ Professional-Grade Visuals: Clean layout with intuitive charts and performance cards.
✅ Forecasting Potential: Identify sales patterns and anticipate demand shifts.
No more spreadsheets full of confusing numbers — get a vibrant, easy-to-navigate Power BI dashboard that tells your business story instantly.
Click here to read the Detailed Blog Post
Watch the step-by-step video tutorial:
Visit our YouTube channel to learn step-by-step video tutorials and see this dashboard in action!
Compatibility and Requirements
- Built for Power BI Desktop, which is free. Get it from Microsoft: Get Power BI Desktop.
- Data comes from three Excel sheets: Input_Actual, Input_Target and KPI_Definition. Fill them in and refresh the report.
Frequently Asked Questions
Which pages does the report have?
A Summary page, a KPI Trend page and a KPI Definition page you reach by drill through.
How do I filter the Summary page?
Use the slicers to look at results by month or KPI category.
What does the KPI Trend page show?
Combo charts compare actuals, targets and the previous year month by month.
How do I update the numbers?
Enter monthly actuals and targets in the Excel file, then refresh the Power BI file.
Is there an Excel or Google Sheets version?
Yes. See the Seasonal Sales KPI Dashboard In Excel and the Seasonal Sales KPI Dashboard in Google Sheets.
Related Sales Templates
- Seasonal Sales KPI Dashboard In Excel: the same KPIs in Excel
- Seasonal Sales KPI Dashboard in Google Sheets: the Google Sheets edition
- Sales KPI Dashboard in Power BI: general sales KPIs in Power BI
- Channel Sales KPI Dashboard in Power BI: track sales by channel
- Power BI Dashboard Mega Collection: 15 Power BI templates in one download
Browse all Power BI KPI dashboards.















Reviews
There are no reviews yet.