

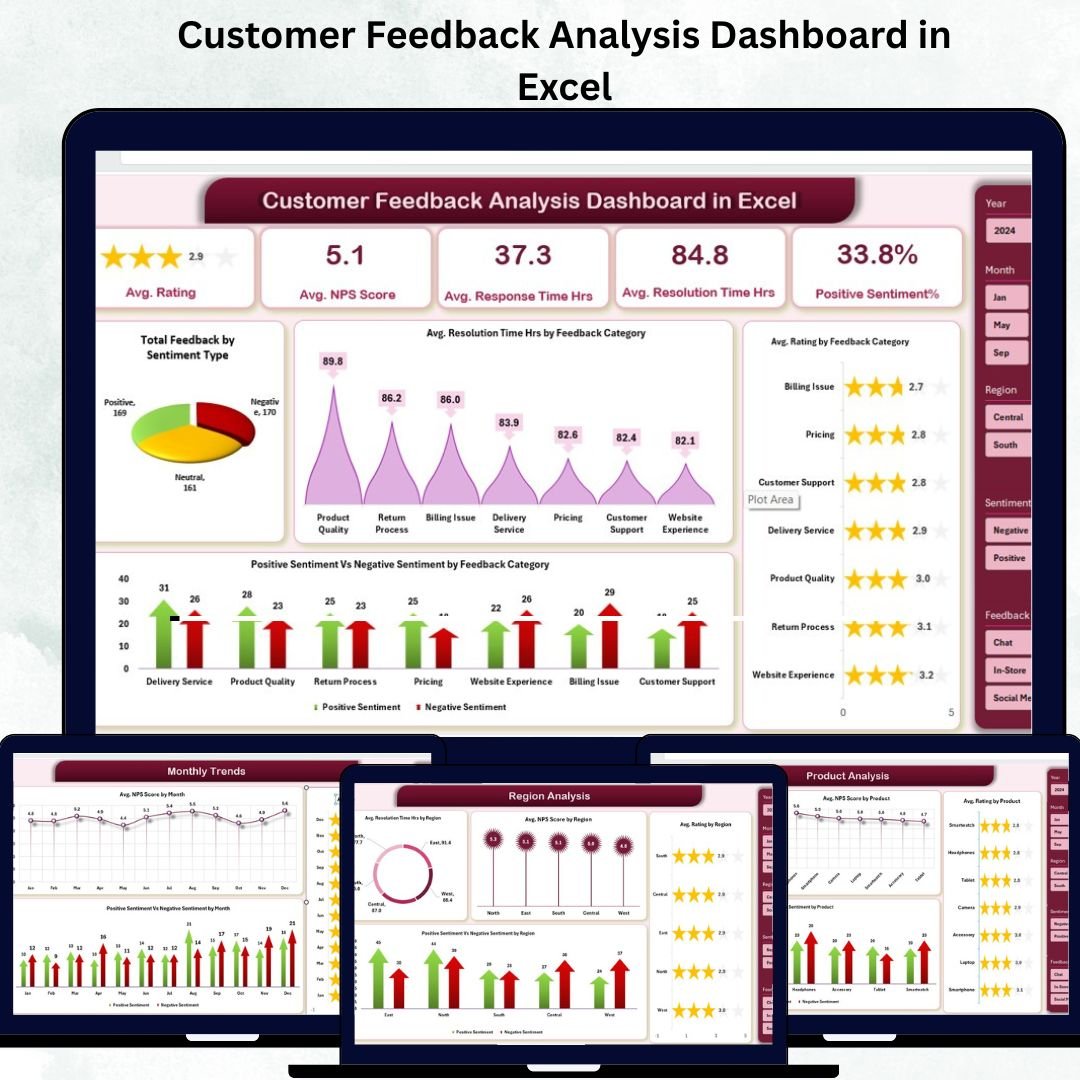

Customer Feedback Analysis Dashboard in Excel is your all-in-one solution for turning customer opinions into actionable insights 📊. Whether your feedback comes from surveys, emails, social media, or chat, this ready-to-use Excel dashboard helps you visualize satisfaction, track sentiment, and measure performance — all without complex software or coding.
✨ Key Features of the Customer Feedback Analysis Dashboard in Excel
⭐ Comprehensive Feedback Visualization:
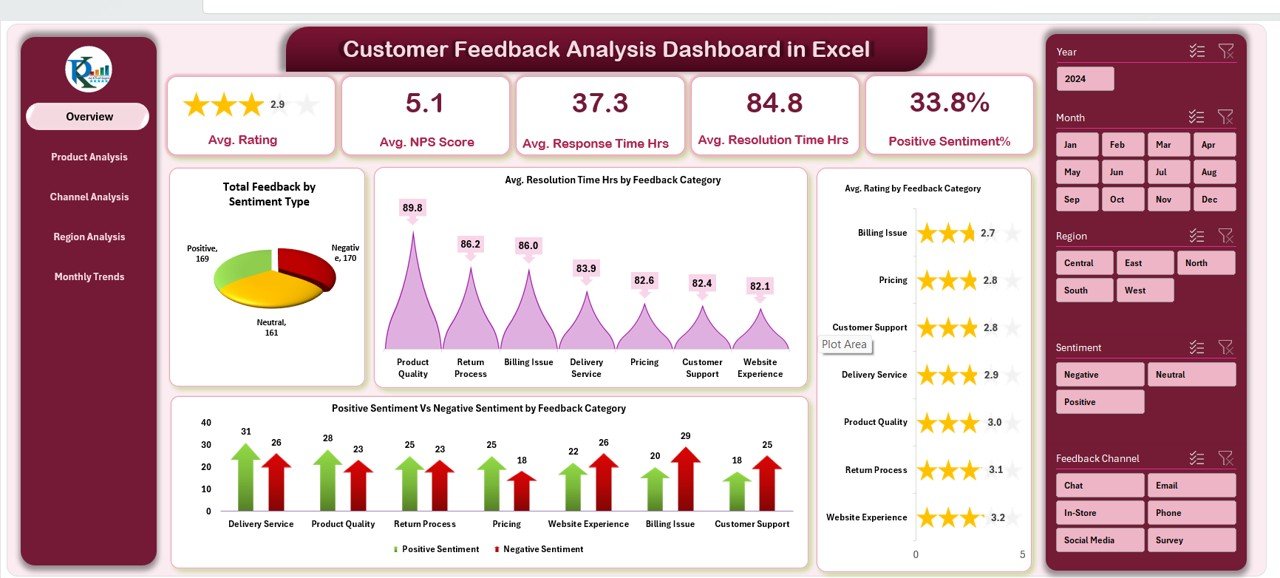
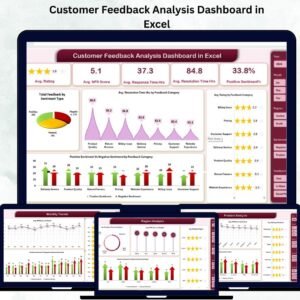
View all customer feedback data in one dynamic dashboard. Interactive KPI cards display Average Rating, NPS Score, Response Time, Resolution Time, and Positive Sentiment %.
📈 Multi-Level Analysis Tabs:
Analyze feedback across multiple perspectives — Overview, Product, Channel, Region, and Monthly Trends. Each tab includes ready-made pivot charts and insights for easy interpretation.
📊 Automated KPIs and Charts:
No manual work required! Once you paste your data, Excel automatically updates charts and KPI cards in real time.
🔍 Sentiment Breakdown:
Get a clear comparison between Positive, Neutral, and Negative responses by category, region, or product.
🕓 Performance Tracking Over Time:
Monthly trends help identify improvement areas and measure how changes affect customer satisfaction.
🧭 Interactive Slicers and Filters:
Filter results by product, channel, or region — perfect for drilling down into specific feedback sources.
⚙️ 100% Customizable:
Add or modify KPIs, adjust formulas, or redesign visuals — the flexibility of Excel means you stay in control.
💡 User-Friendly Interface:
No technical expertise needed. Anyone familiar with Excel can operate the dashboard easily.
📦 What’s Inside the Customer Feedback Analysis Dashboard in Excel
This pre-built Excel file includes multiple intelligently designed sheets:
1️⃣ Overview Sheet:
Shows top-level metrics through KPI cards and charts like Total Feedback by Sentiment Type, Average Resolution Time by Category, and Positive vs. Negative Sentiment by Category.
2️⃣ Product Analysis Sheet:
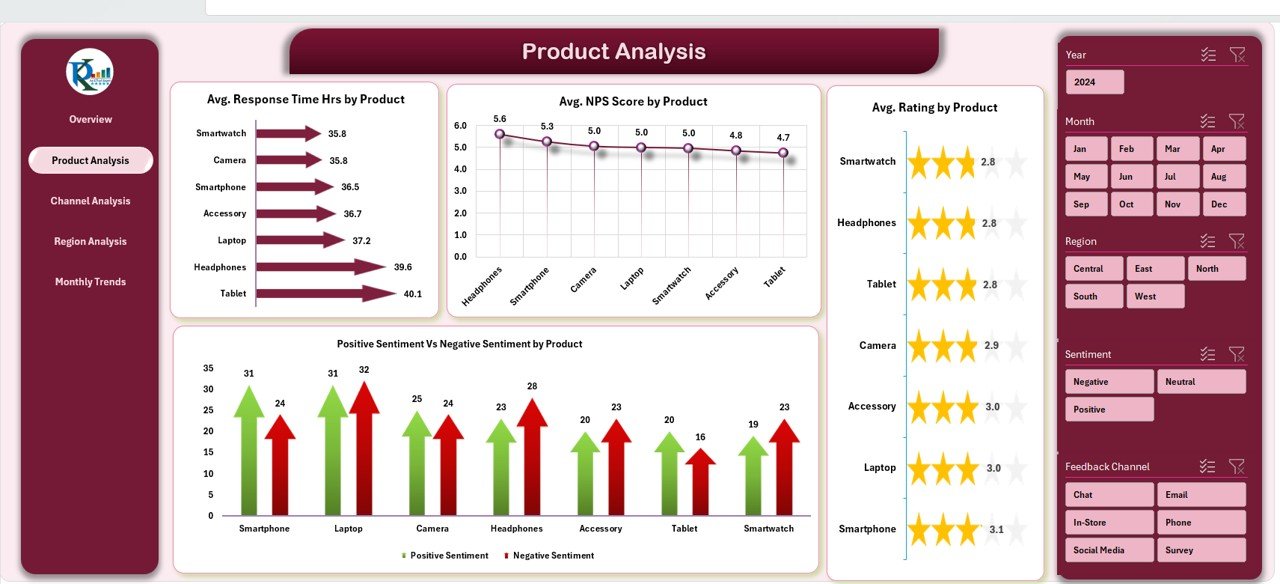
Compare performance across products with charts for Average Response Time, NPS Score, and Sentiment Distribution.
3️⃣ Channel Analysis Sheet:
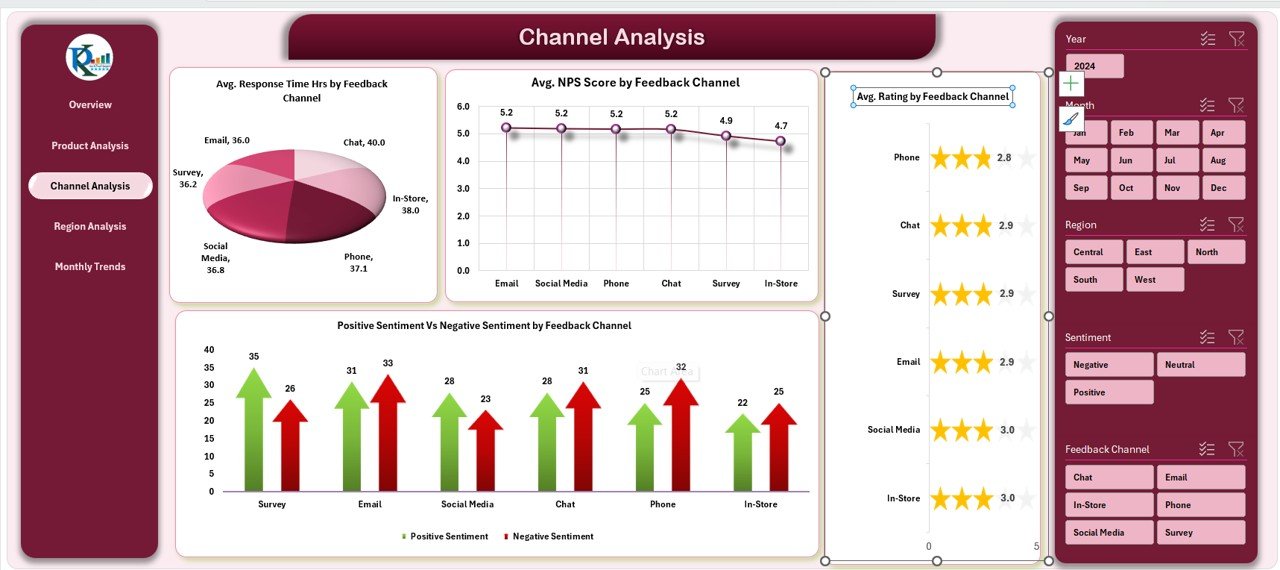
Discover which communication channels perform best — see satisfaction and response time by email, chat, call, or social media.
4️⃣ Region Analysis Sheet:
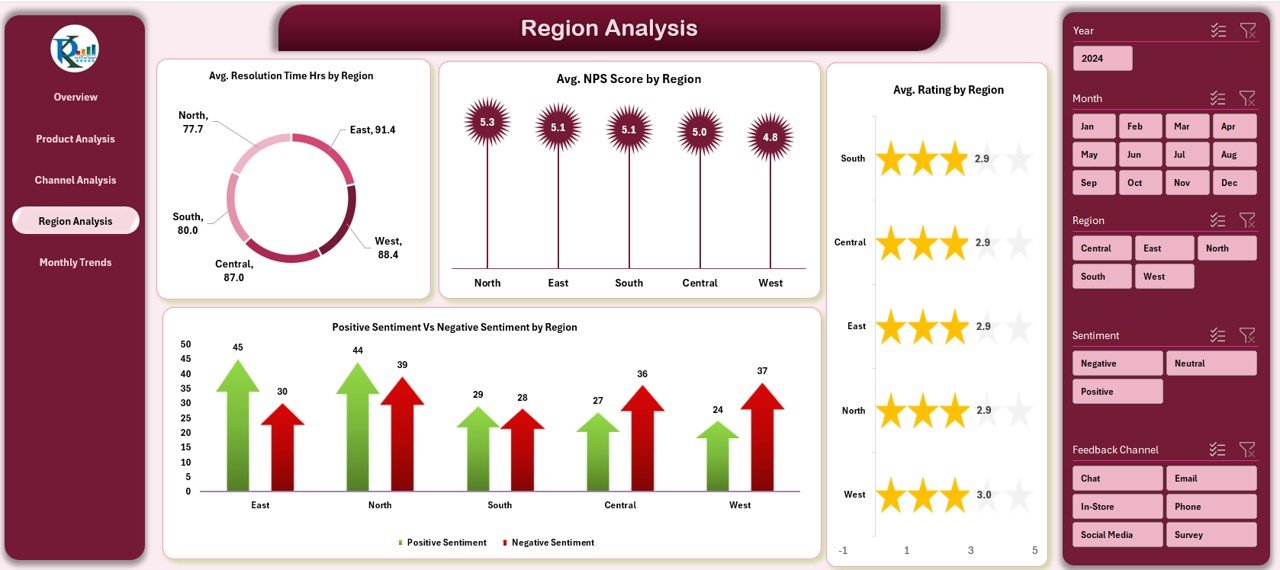
Understand customer sentiment by geography — spot regions with high satisfaction or delayed responses.
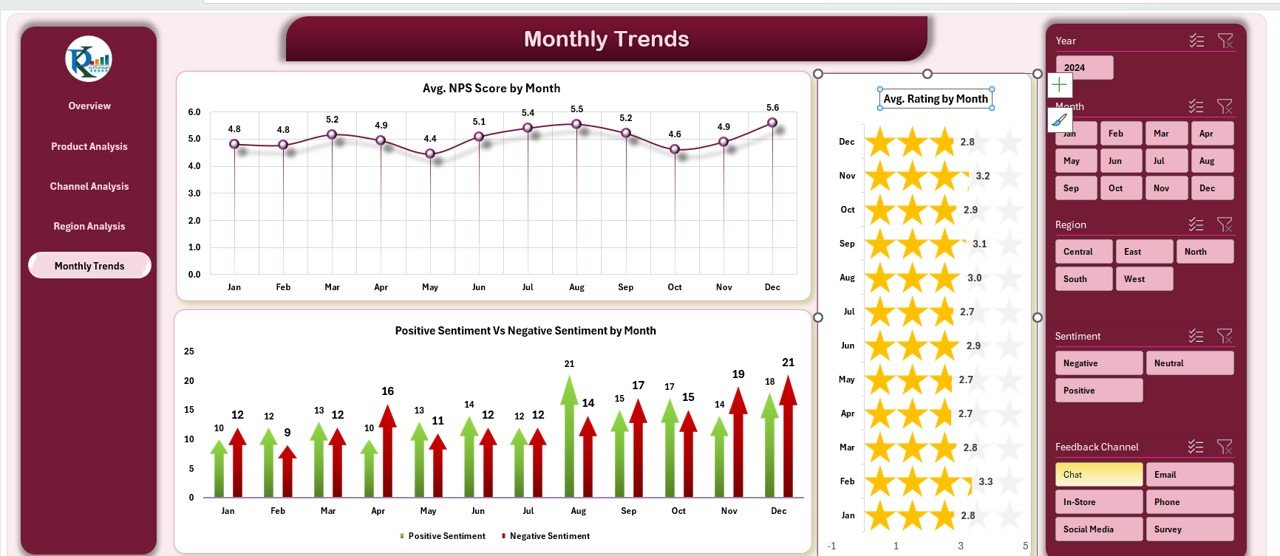
5️⃣ Monthly Trends Sheet:
Track how satisfaction, NPS, and sentiment evolve month-to-month.
6️⃣ Data Input Sheet:
Easily paste your raw feedback data — the entire dashboard updates automatically via pivot tables.
⚙️ How to Use the Customer Feedback Analysis Dashboard in Excel
1️⃣ Collect and Paste Data:
Gather feedback from forms, CRMs, or surveys and paste it into the Data Input Sheet.
2️⃣ Refresh Dashboard:
Click “Refresh All” — Excel automatically recalculates all KPIs and updates charts.
3️⃣ Analyze with Filters:
Use slicers to focus on specific months, regions, or products.
4️⃣ Draw Insights & Take Action:
Quickly identify slow response areas, low satisfaction products, or strong-performing regions.
This simple 4-step workflow helps you transform feedback into strategy effortlessly.
👥 Who Can Benefit from This Customer Feedback Analysis Dashboard in Excel
✅ Business Owners: Understand what customers love (or don’t) and make service improvements fast.
✅ Marketing Teams: Track campaign feedback, sentiment trends, and customer loyalty metrics.
✅ Customer Support Managers: Identify delays and optimize response or resolution times.
✅ Product Managers: Monitor product-specific feedback for targeted quality enhancements.
✅ Corporate Executives: Get a top-down performance view to guide data-driven decisions.
✅ Consultants & Analysts: Impress clients with visual reports and actionable insights.
Click Here to Read the Detailed Blog Post
Watch the step-by-step video tutorial:
Visit our YouTube Channel to learn step-by-step video tutorials
Compatibility and Requirements
- Works in Microsoft Excel desktop (Excel 2016 or later, or Microsoft 365).
- The dashboard runs on pivot tables and slicers. Microsoft explains slicers in Use slicers to filter data.
Frequently Asked Questions
Which sheets are in the file?
Overview, Product Analysis, Channel Analysis, Region Analysis, Monthly Trends and a Data Input sheet.
Which KPI cards are shown?
Average Rating, NPS Score, Response Time, Resolution Time and Positive feedback, with charts by sentiment, product, channel and region.
How do I add my feedback data?
Paste it into the Data Input sheet, then click Refresh All. The pivot tables, cards and charts update.
Can I filter the results?
Yes. Slicers filter by month, product, channel or region.
Can I change the KPIs?
Yes. You can add or change KPIs, adjust formulas and redesign the visuals.
Related Customer Feedback Templates
- Customer Feedback Analysis Dashboard in Google Sheets: the same topic in Google Sheets
- Customer Satisfaction Dashboard in Excel: focus on satisfaction scores
- NPS Dashboard in Excel: track Net Promoter Score in detail
- Customer Feedback Tracker in Excel: log each piece of feedback
- Customer Satisfaction Dashboard in Power BI: satisfaction analysis in Power BI
Browse all Excel Dashboards.











Reviews
There are no reviews yet.