Building a sustainable future starts with effective recycling — but you can’t improve what you can’t measure ♻️📊.
The Recycling KPI Scorecard in Excel empowers organizations to monitor recycling performance, identify inefficiencies, and report progress with confidence.
This ready-to-use Excel template is designed for sustainability managers, environmental officers, and facility administrators who want accurate, data-driven insights without the need for complex BI software. With built-in automation, color coding, and trend charts, this tool turns raw waste-management data into meaningful visuals that help teams make smarter, greener decisions 🌍.
⚙️ Key Features of the Recycling KPI Scorecard in Excel
📊 4 Smartly-Designed Sheets – Scorecard, KPI Trend, Input Data, and KPI Definition.
🎯 MTD & YTD Tracking – View Month-to-Date and Year-to-Date progress.
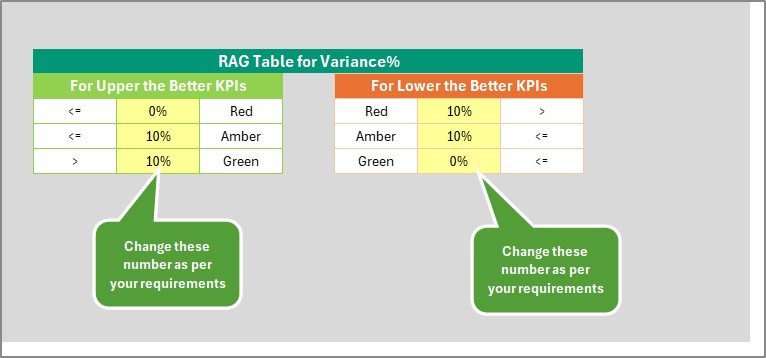
🟢 Color-Coded Insights – Instantly identify performance levels (Green, Yellow, Red).
📈 Trend Charts – Track KPI improvements across months.
💡 Dropdown Filters – Choose any KPI or month to update results automatically.
🧾 KPI Reference Sheet – Includes group, unit, formula, and definition for each KPI.
⚙️ Customizable Design – Add, edit, or remove KPIs easily.
💰 Cost-Effective – 100% Excel-based; no additional software required.
🚀 Data Automation – Formulas auto-calculate targets, variance, and trends.
📦 What’s Inside the Template
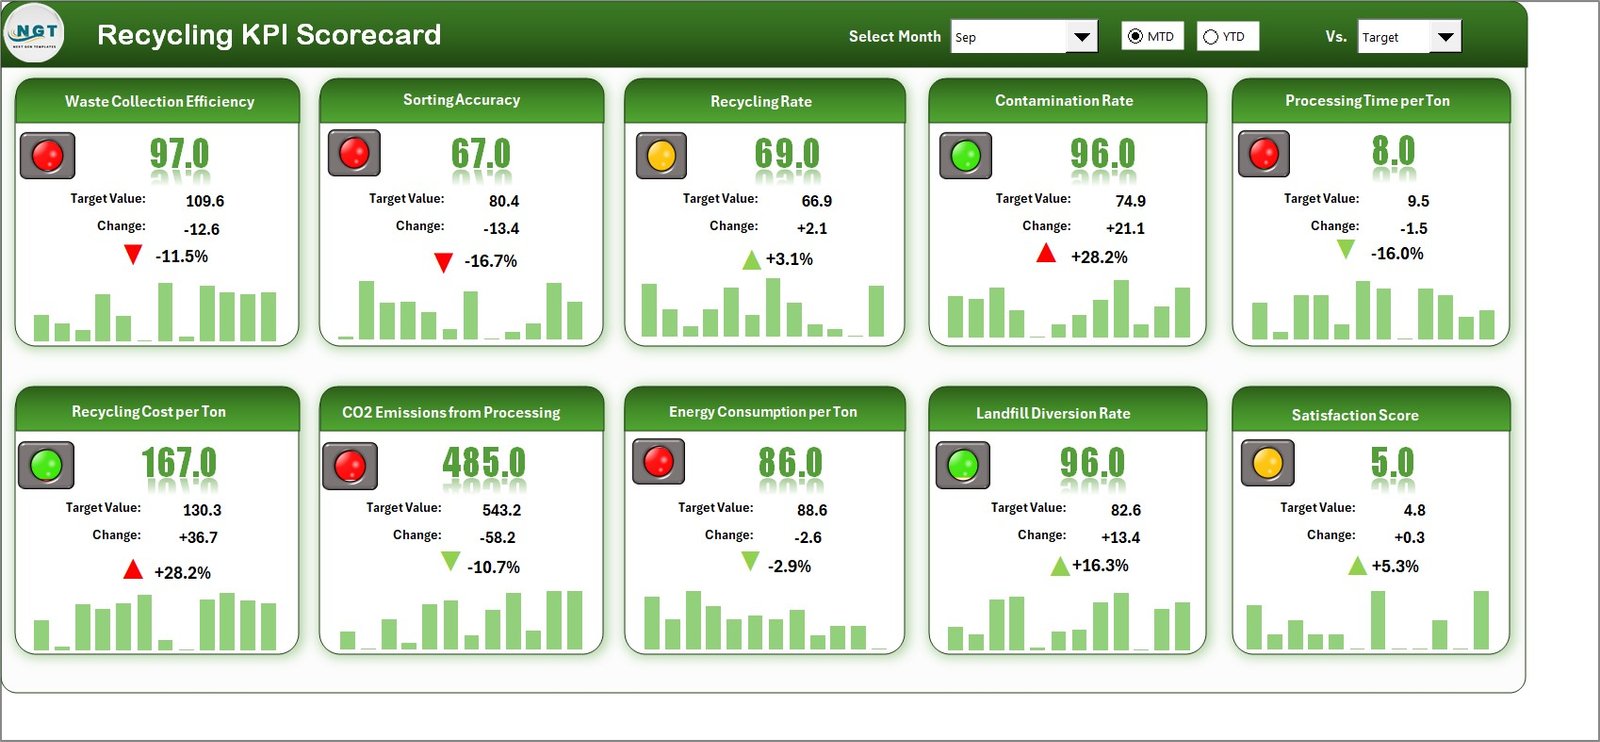
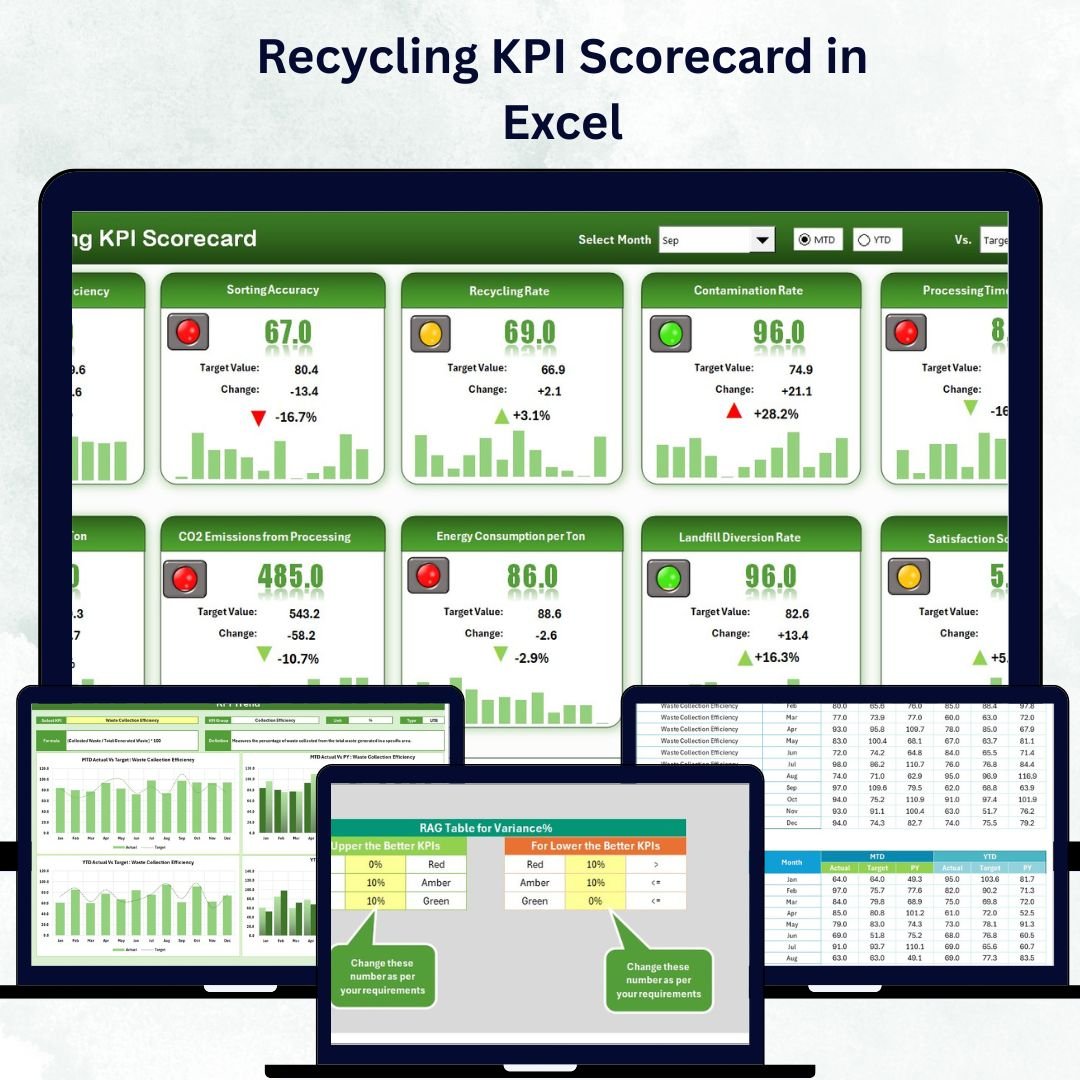
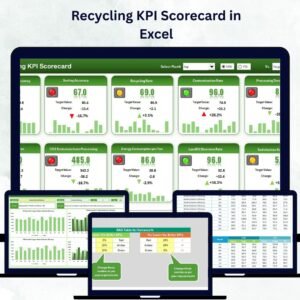
1️⃣ Scorecard Sheet – The Main Dashboard
This is your command center for tracking recycling performance.
-
Dropdowns for Month and MTD/YTD selection.
-
Real-time comparison between Actual vs Target performance.
-
Color indicators (🟢 🟡 🔴) that instantly show areas of success or concern.
-
MTD and YTD values for all KPIs, including Actual, Target, and Previous Year.
It’s the perfect place to monitor sustainability progress at a glance and report to management or stakeholders.
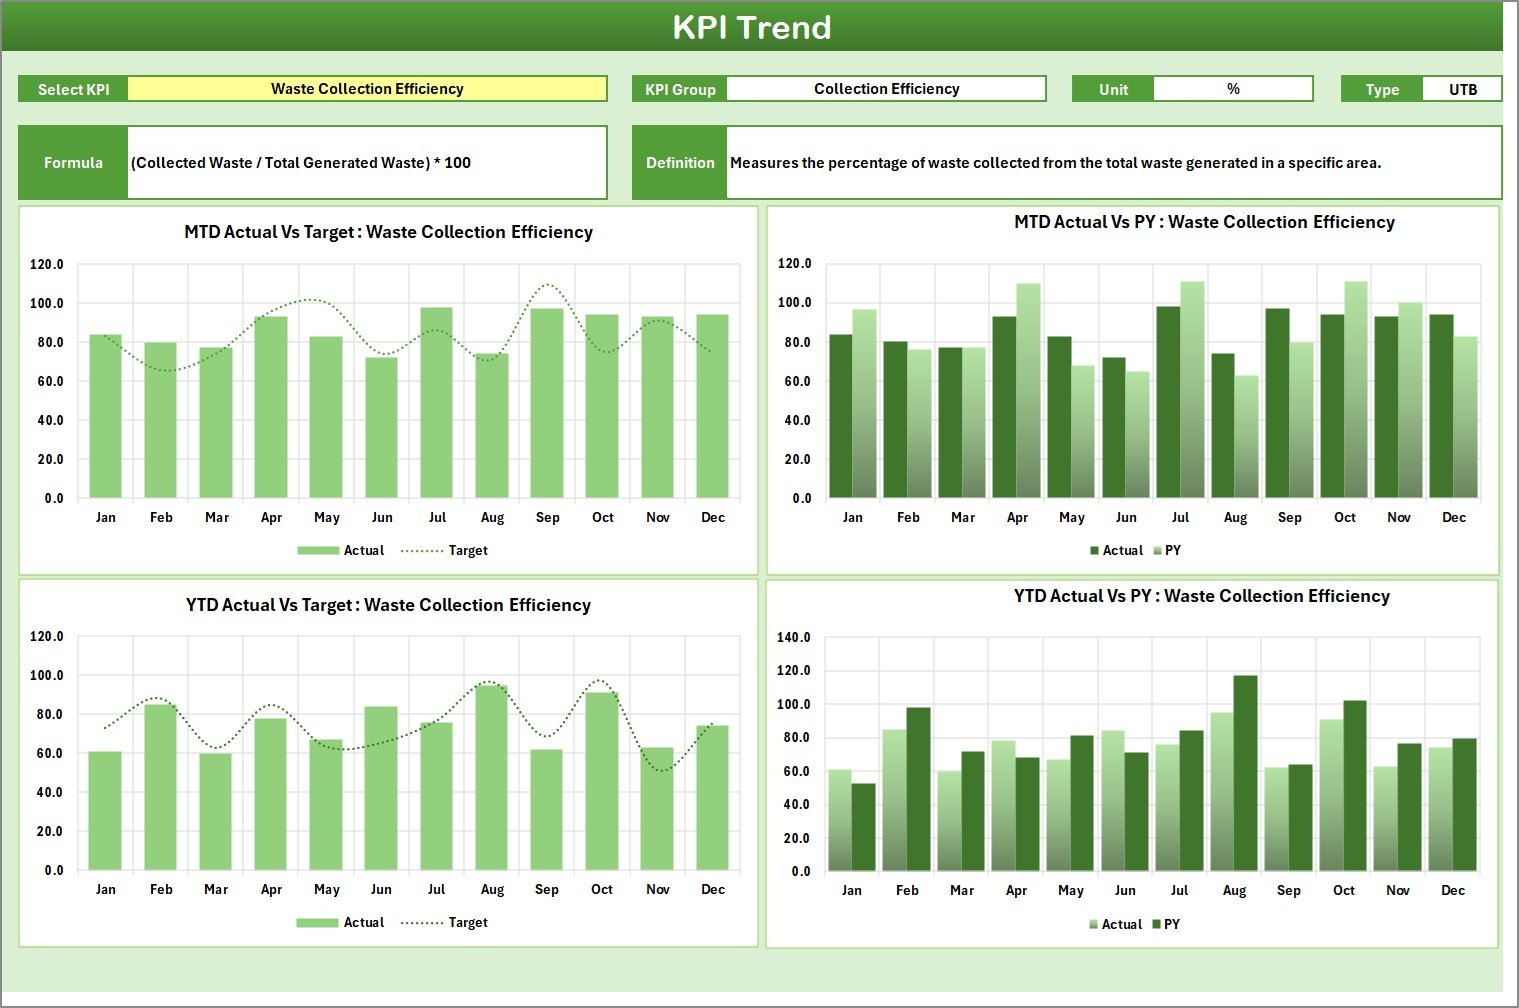
2️⃣ KPI Trend Sheet – Visualize Recycling Progress Over Time
This sheet gives you deep insights into how performance evolves each month.
-
Dropdown (Cell C3) to select a KPI for detailed analysis.
-
Displays KPI metadata (Group, Unit, Formula, and Type).
-
Dynamic MTD and YTD charts compare Actual, Target, and Previous Year data.
Use it to detect patterns, highlight seasonal variations, and identify consistent improvement or recurring issues.
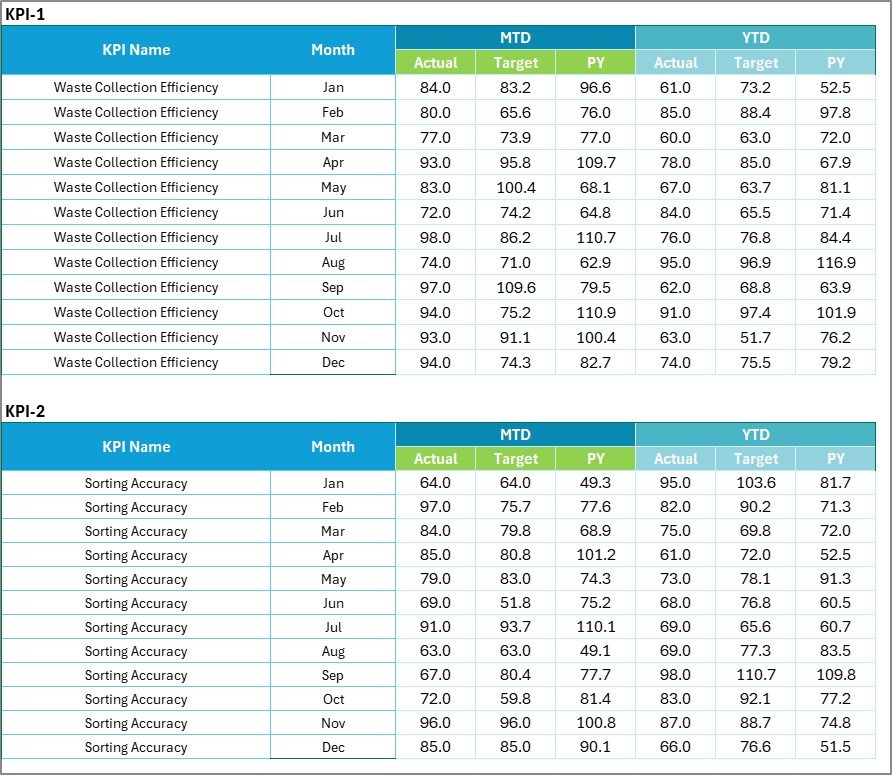
3️⃣ Input Data Sheet – Central Data Entry
Keep all your data organized in one place.
-
Enter monthly Actual, Target, and Previous Year data for each KPI.
-
The entire workbook updates automatically, ensuring accuracy and saving time.
-
Easily expand to include additional KPIs or categories without breaking formulas.
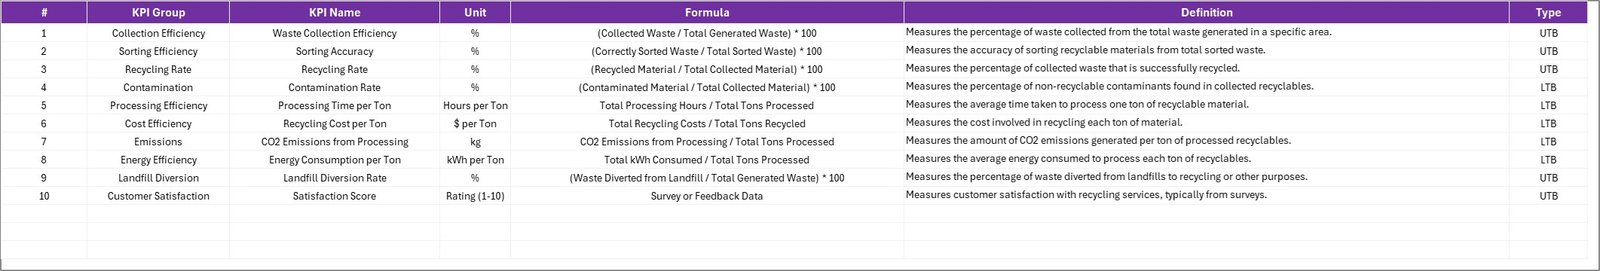
4️⃣ KPI Definition Sheet – Maintain Clarity & Consistency
This sheet documents every KPI and its purpose.
Includes columns for:
-
KPI Name
-
KPI Group (Waste Collection, Energy Usage, etc.)
-
Unit (%, Kg, Ton, etc.)
-
Formula
-
KPI Definition
It acts as your internal “KPI dictionary,” ensuring every team member measures and interprets results the same way.
💡 Why Use the Recycling KPI Scorecard in Excel?
♻️ Centralized Data Control: Manage all recycling data in one structured file.
📊 Instant Insights: Visualize efficiency, cost, and performance in seconds.
💼 Transparency: Assign KPI ownership for accountability.
🧠 Smart Decision-Making: Identify low-performing areas early.
💰 Budget-Friendly: Skip costly BI tools—Excel does it all!
🌱 Environmental Impact Reporting: Show measurable sustainability progress to stakeholders.
🌟 Advantages of the Recycling KPI Scorecard in Excel
✅ Real-Time Tracking – Stay updated with automated KPI comparisons.
✅ Visual Analytics – Use color codes and charts for easy interpretation.
✅ Customizable Layout – Adjust for corporate or municipal needs.
✅ Automation Ready – Formulas handle calculations instantly.
✅ Data Accuracy – Eliminate manual reporting errors.
✅ Eco-Focused Design – Built specifically for sustainability programs.
🧭 How to Use the Scorecard Effectively
1️⃣ Update KPI Definitions: Add relevant recycling metrics with formulas.
2️⃣ Enter Monthly Data: Fill Actual, Target, and Previous Year values.
3️⃣ Choose Month & Period: Navigate to the Scorecard sheet for MTD/YTD insights.
4️⃣ Analyze Trends: Use the KPI Trend sheet to understand performance movement.
5️⃣ Review & Report: Share insights with management or sustainability teams.
👥 Who Can Benefit from This Scorecard
-
Sustainability Managers 🌿
-
Environmental Teams 🌎
-
Facility & Operations Managers 🏢
-
Waste-Management Authorities 🚛
-
Corporate CSR Departments 💼
-
Municipal Governments 🏛️
If your organization aims to reduce waste, increase recycling efficiency, and promote sustainability, this template is your essential toolkit.
🧠 Conclusion
The Recycling KPI Scorecard in Excel helps you measure what matters — from waste diversion and recycling rates to emission reductions and cost savings.
With its clean structure, visual analytics, and automated reporting, it simplifies sustainability management and drives continuous improvement.
Start tracking your recycling performance today and take the next step toward a cleaner, greener planet 🌍💚.


Reviews
There are no reviews yet.