In the fast-paced world of textiles, success depends on precision, productivity, and performance. From monitoring production lines to ensuring consistent quality, every decision counts. That’s why the Textile Industry KPI Scorecard in Excel is the perfect solution for data-driven textile operations 🧶📊.
This ready-to-use Excel template helps manufacturers, exporters, and process managers track, measure, and visualize key performance indicators (KPIs) across all departments. It transforms complex production data into clear, actionable insights — enabling faster, smarter, and more profitable decisions.
Whether you manage spinning, weaving, dyeing, or garment units, this scorecard empowers your team to reduce waste, improve output, and enhance efficiency — all within Excel’s familiar environment.
⚙️ Key Features of the Textile Industry KPI Scorecard in Excel
📋 Four Functional Sheets – Scorecard, KPI Trend, Input Data, and KPI Definition.
🎯 Actual vs Target Comparison – Track Month-to-Date (MTD) and Year-to-Date (YTD) results.
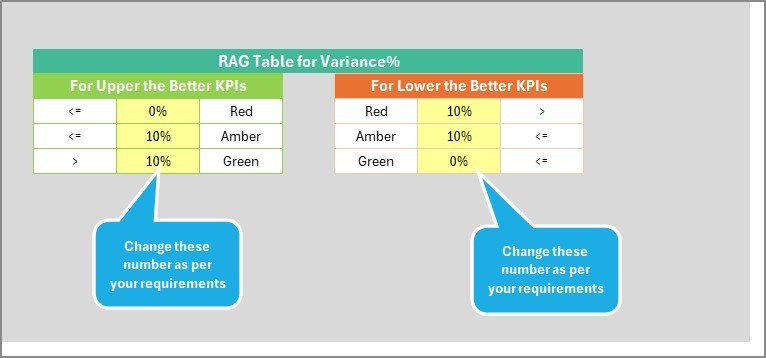
🟢 Color-Coded Indicators – Instantly see which KPIs meet or miss targets.
📈 Dynamic Charts & Dropdowns – Analyze performance by department, process, or product.
🔍 Comprehensive KPI Overview – Production efficiency, defect rates, downtime, and on-time delivery.
⚙️ Auto Calculations – Update data once; dashboards refresh automatically.
💡 Easy Customization – Add or modify KPIs, formulas, or visuals anytime.
💰 Cost-Effective & Scalable – No subscription required — perfect for small to large textile units.
📦 What’s Inside the KPI Scorecard Template
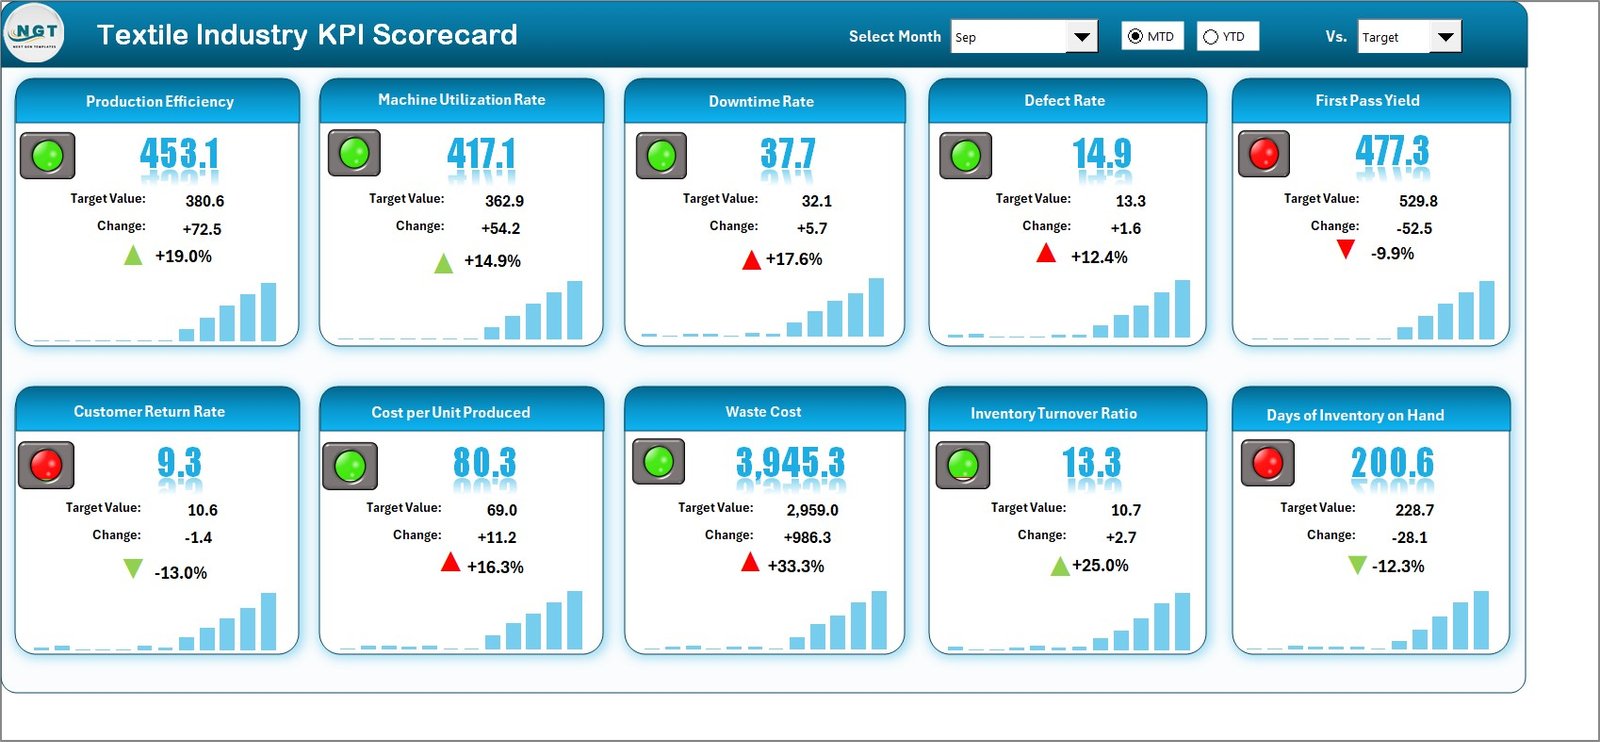
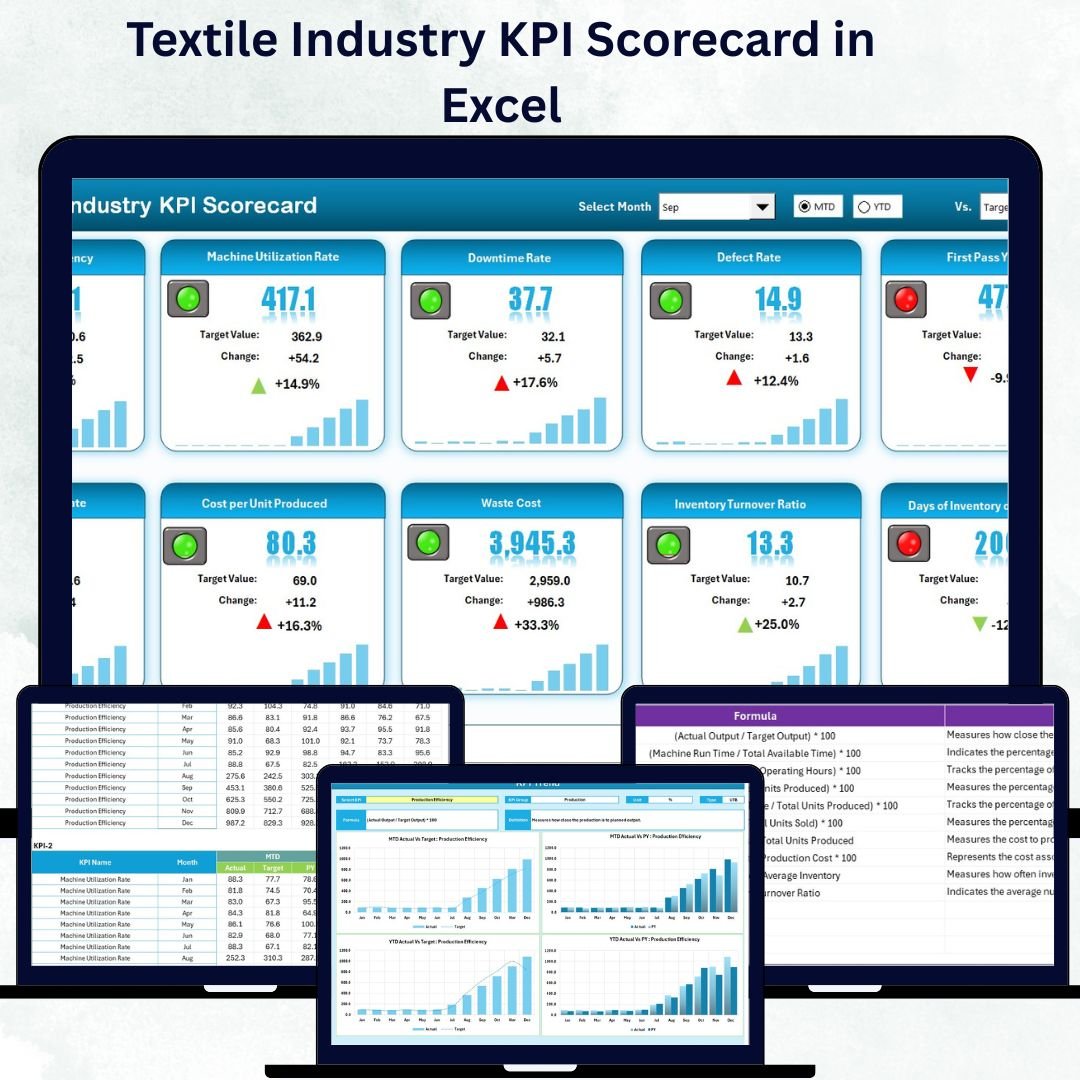
1️⃣ Scorecard Sheet – Central Dashboard View
This is the visual heart of the workbook, displaying all your KPIs in one place.
-
Select any month via dropdown to view MTD and YTD performance.
-
Compare Actual vs Target results at a glance.
-
Use traffic-light color indicators (green, yellow, red) for instant understanding.
-
View up to 10 KPIs at once for a clean, organized snapshot.
This sheet enables quick performance reviews for production managers, quality heads, and business owners alike.
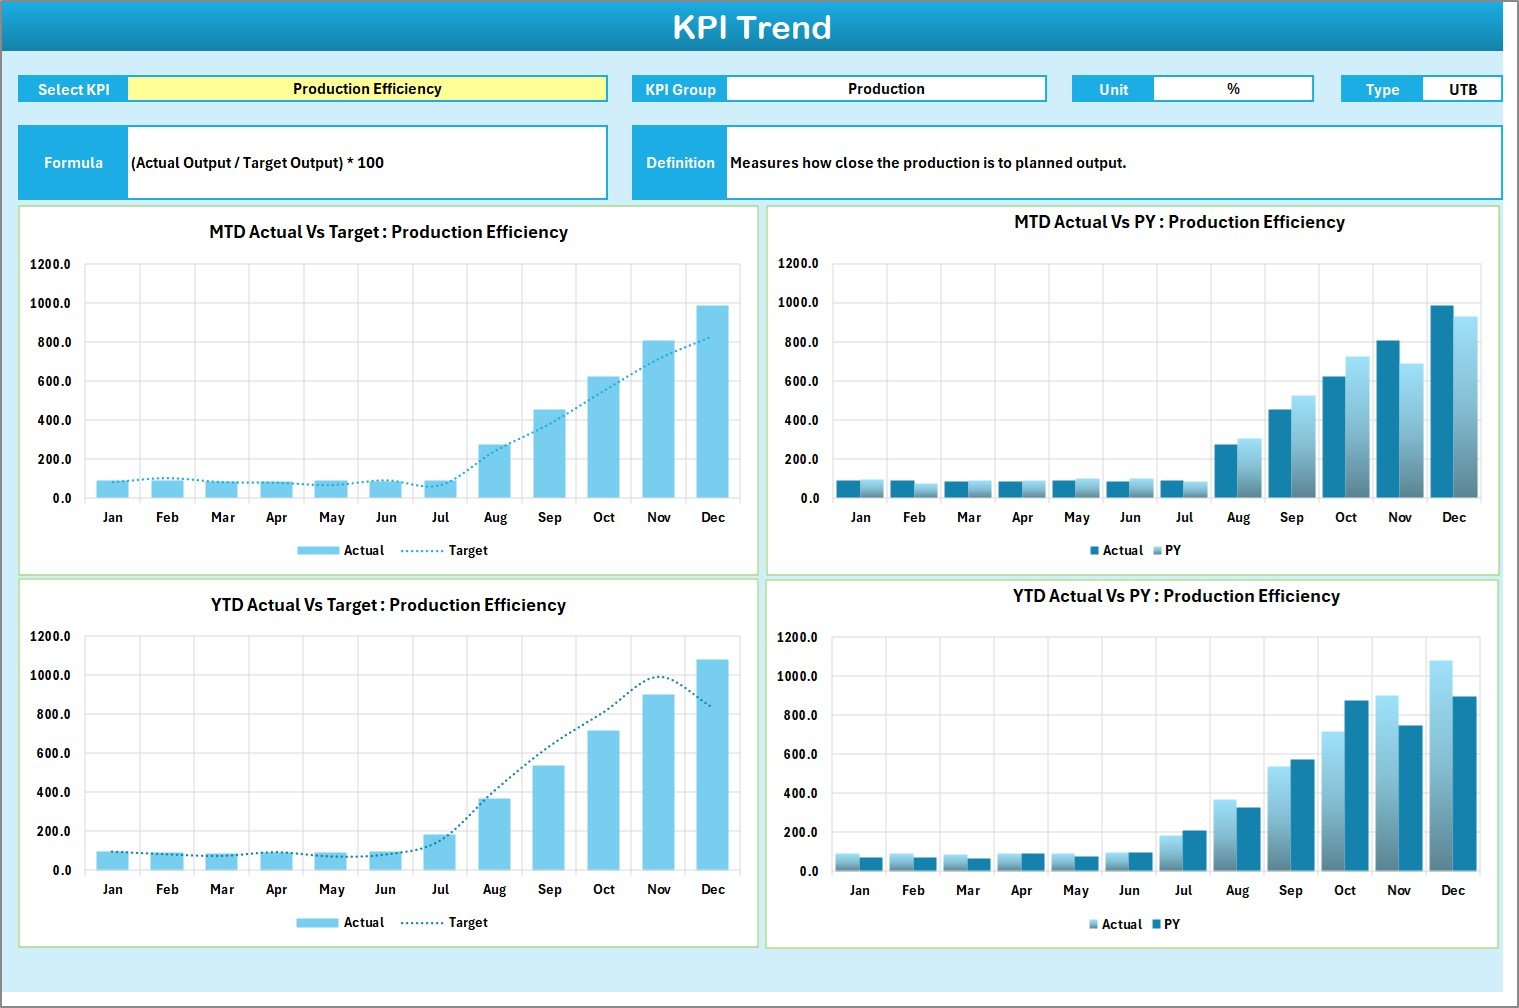
2️⃣ KPI Trend Sheet – Analyze Performance Over Time
Identify patterns, track improvements, and anticipate challenges using dynamic charts.
-
Select a KPI from the dropdown (cell C3).
-
View KPI Group, Unit, Formula, Type (UTB/LTB), and Definition automatically.
-
Explore MTD and YTD trends for Actual, Target, and Previous Year values.
This tab helps detect inefficiencies early — so you can act before they impact output.
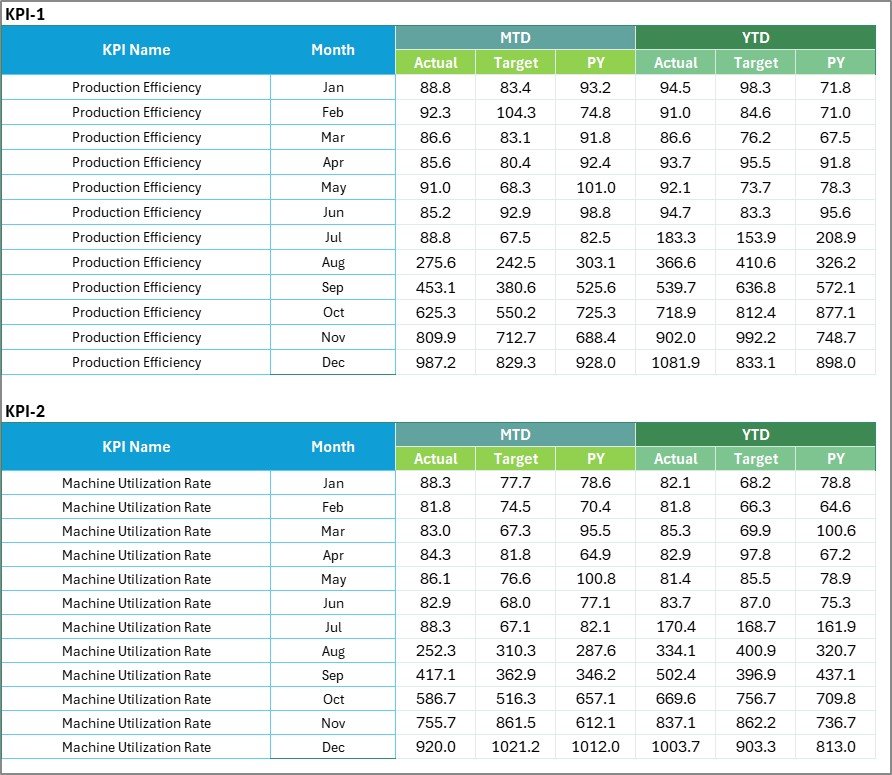
3️⃣ Input Data Sheet – Simplified Data Entry
A clean, structured space for entering monthly KPI data.
-
Add Actual and Target values.
-
Built-in formulas update all visuals instantly.
-
Dropdowns and validations maintain accuracy.
This is the foundation that powers your entire scorecard 📑.
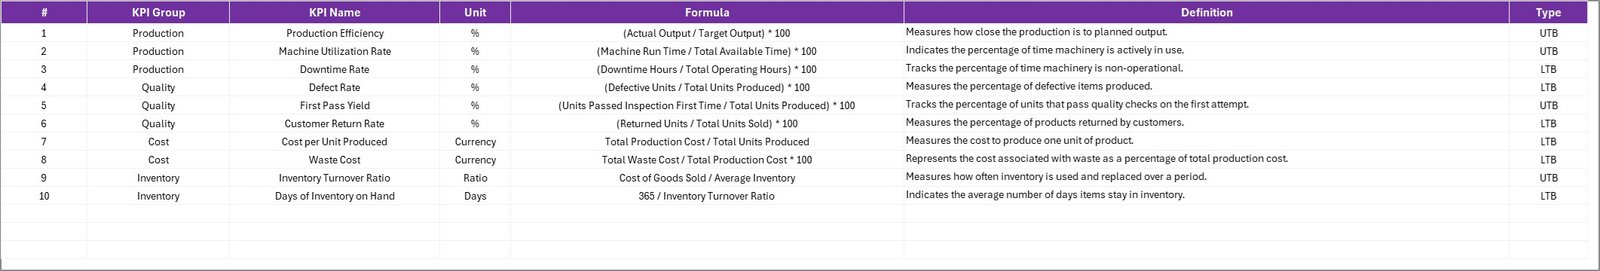
4️⃣ KPI Definition Sheet – Your Performance Dictionary
Standardize KPI understanding across all departments.
-
Define each KPI’s Group, Unit, Formula, and Type (UTB/LTB).
-
Eliminate confusion about how each metric is measured.
This sheet ensures that everyone measures success the same way.
💡 Why the Textile Industry Needs KPI Scorecards
📊 Real-Time Visibility – Track production efficiency, machine downtime, and quality in one view.
🧵 Improved Productivity – Detect bottlenecks, monitor operator output, and reduce rework.
🎯 Quality Management – Track defect rates, rework percentage, and waste levels easily.
💬 Transparency & Accountability – Assign KPI ownership to departments for clarity.
💸 Smarter Decision-Making – Make strategic adjustments based on facts, not guesses.
With this Excel-based scorecard, you turn operational data into measurable business intelligence.
🌟 Advantages of Using This Scorecard
✅ Centralized Control: Access all performance data in one workbook.
✅ Instant Insights: Automatic updates make manual reporting obsolete.
✅ Visual Clarity: Color codes highlight top-performing and underperforming areas.
✅ Collaboration Ready: Share the same scorecard across departments for unified analysis.
✅ Customizable Layout: Easily adapt KPIs to your plant’s structure.
✅ Transparent Reporting: Standardized metrics support audits and reviews.
🧭 How to Use the Textile KPI Scorecard
1️⃣ Define KPIs – Set up clear definitions in the KPI Definition sheet.
2️⃣ Input Data – Add monthly or weekly actuals and targets in the Input Data sheet.
3️⃣ Review Scorecard – Select your month and review MTD/YTD data instantly.
4️⃣ Analyze Trends – Examine historical data in the KPI Trend sheet.
5️⃣ Take Action – Identify problem areas and plan corrective steps.
👥 Who Can Benefit from This Scorecard
-
Textile Manufacturers 🏭
-
Production & Quality Managers
-
Exporters & Merchandisers
-
Process Engineers
-
Factory Owners & Operational Heads
Whether managing a single unit or multiple facilities, this tool ensures consistent, transparent, and data-driven performance tracking.
🧠 Conclusion
The Textile Industry KPI Scorecard in Excel is more than just a dashboard — it’s a complete productivity engine. With automated charts, interactive filters, and ready-made formulas, it enables you to monitor every step of textile production with clarity and control.
Say goodbye to scattered reports and guesswork — and start managing your business with real-time performance insights today! 🌟


Reviews
There are no reviews yet.