In the fast-paced world of hospitality, every decision — from pricing rooms to managing staff — influences guest satisfaction and profitability. The Hospitality KPI Scorecard in Excel is your all-in-one solution for tracking, analyzing, and improving performance with data-driven precision.
This ready-to-use Excel template consolidates all your Key Performance Indicators (KPIs) — from occupancy rates to guest satisfaction — into a visually appealing, interactive scorecard that empowers hotels, resorts, and restaurants to make smarter, faster decisions.
Key Features of Hospitality KPI Scorecard in Excel
🏨 Comprehensive Dashboard View
Access all crucial KPIs — Actual, Target, and Previous Year — in one clear view. Visual indicators like arrows and colors instantly show performance trends.
📊 MTD & YTD Comparison
Monitor Month-to-Date (MTD) and Year-to-Date (YTD) performance effortlessly. Understand short-term fluctuations and long-term progress side by side.
📅 Dynamic Dropdowns
Easily filter by Month or KPI Group to tailor the analysis for specific departments such as Rooms, Food & Beverage, or Operations.
🎯 Automatic Actual vs Target Calculations
Save time with prebuilt formulas that automatically calculate variance and performance gaps.
🎨 Visual Insights
Use color-coded charts, icons, and data bars to spot high-performing and underperforming KPIs instantly.
🔄 Customizable & Scalable
Add new KPIs, departments, or branches as your business grows — no coding required.
What’s Inside the Hospitality KPI Scorecard in Excel
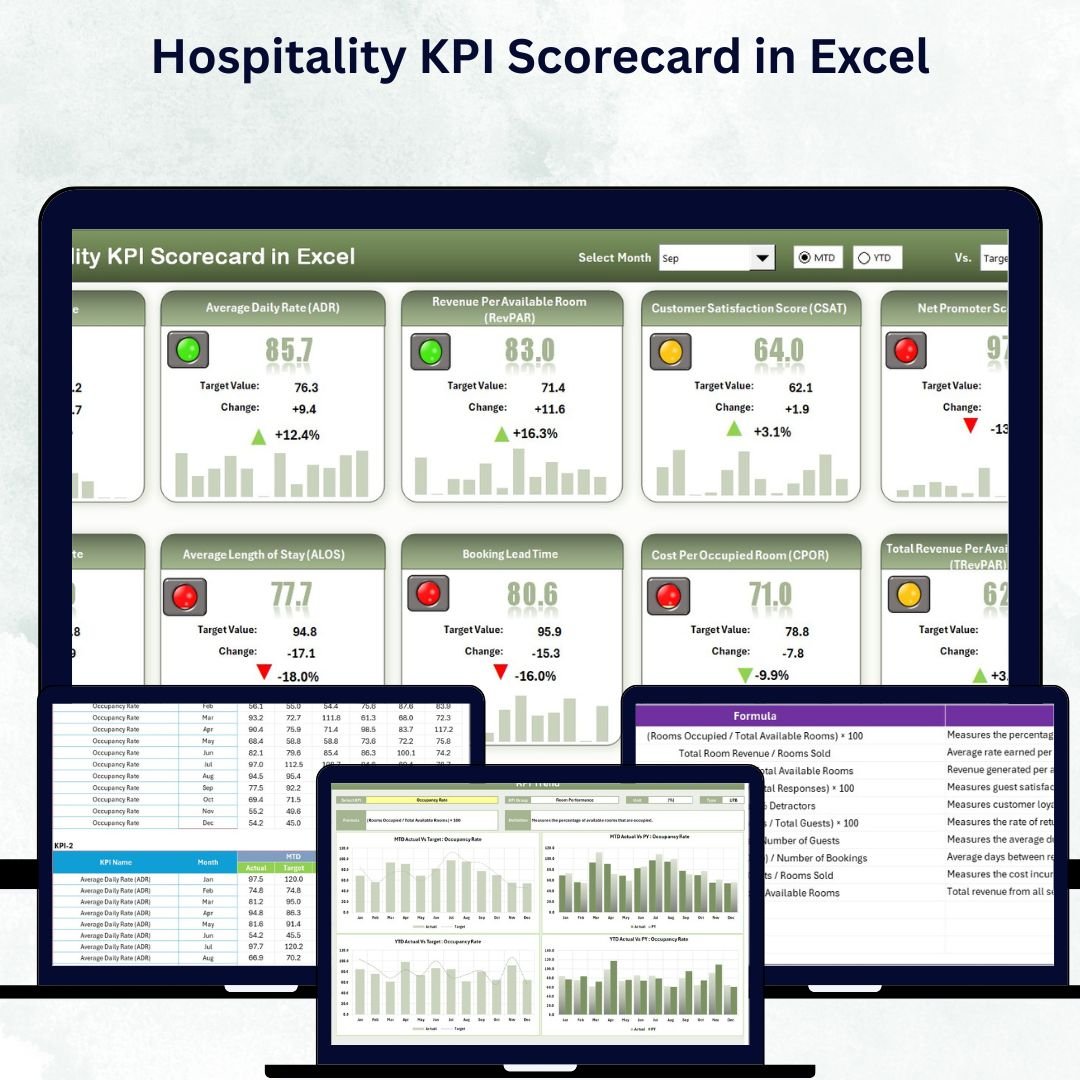
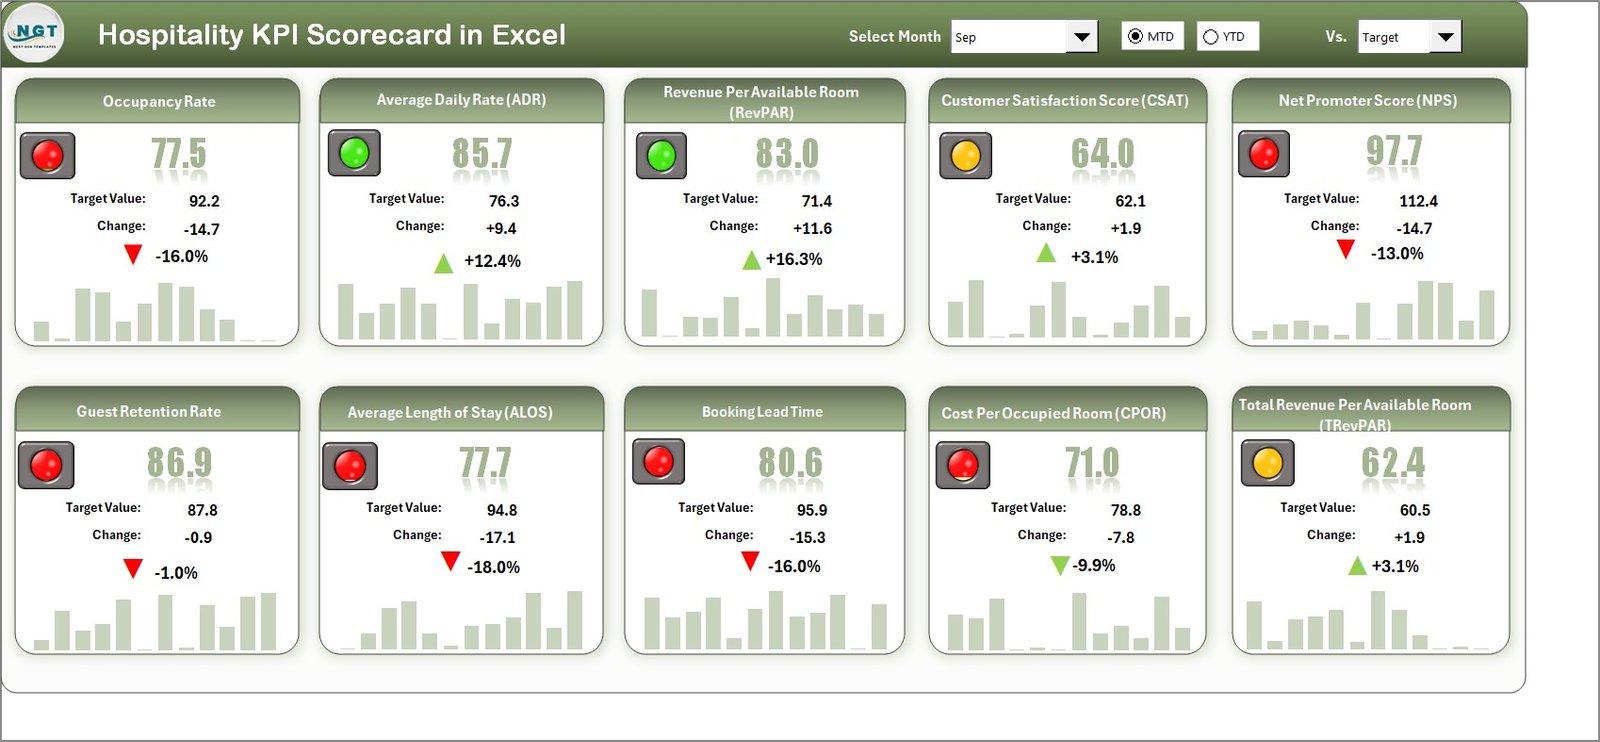
📈 Scorecard Sheet:
The main performance dashboard where all KPIs are displayed together. It provides dropdown filters, visual indicators, and a quick snapshot of up to 10 KPIs.
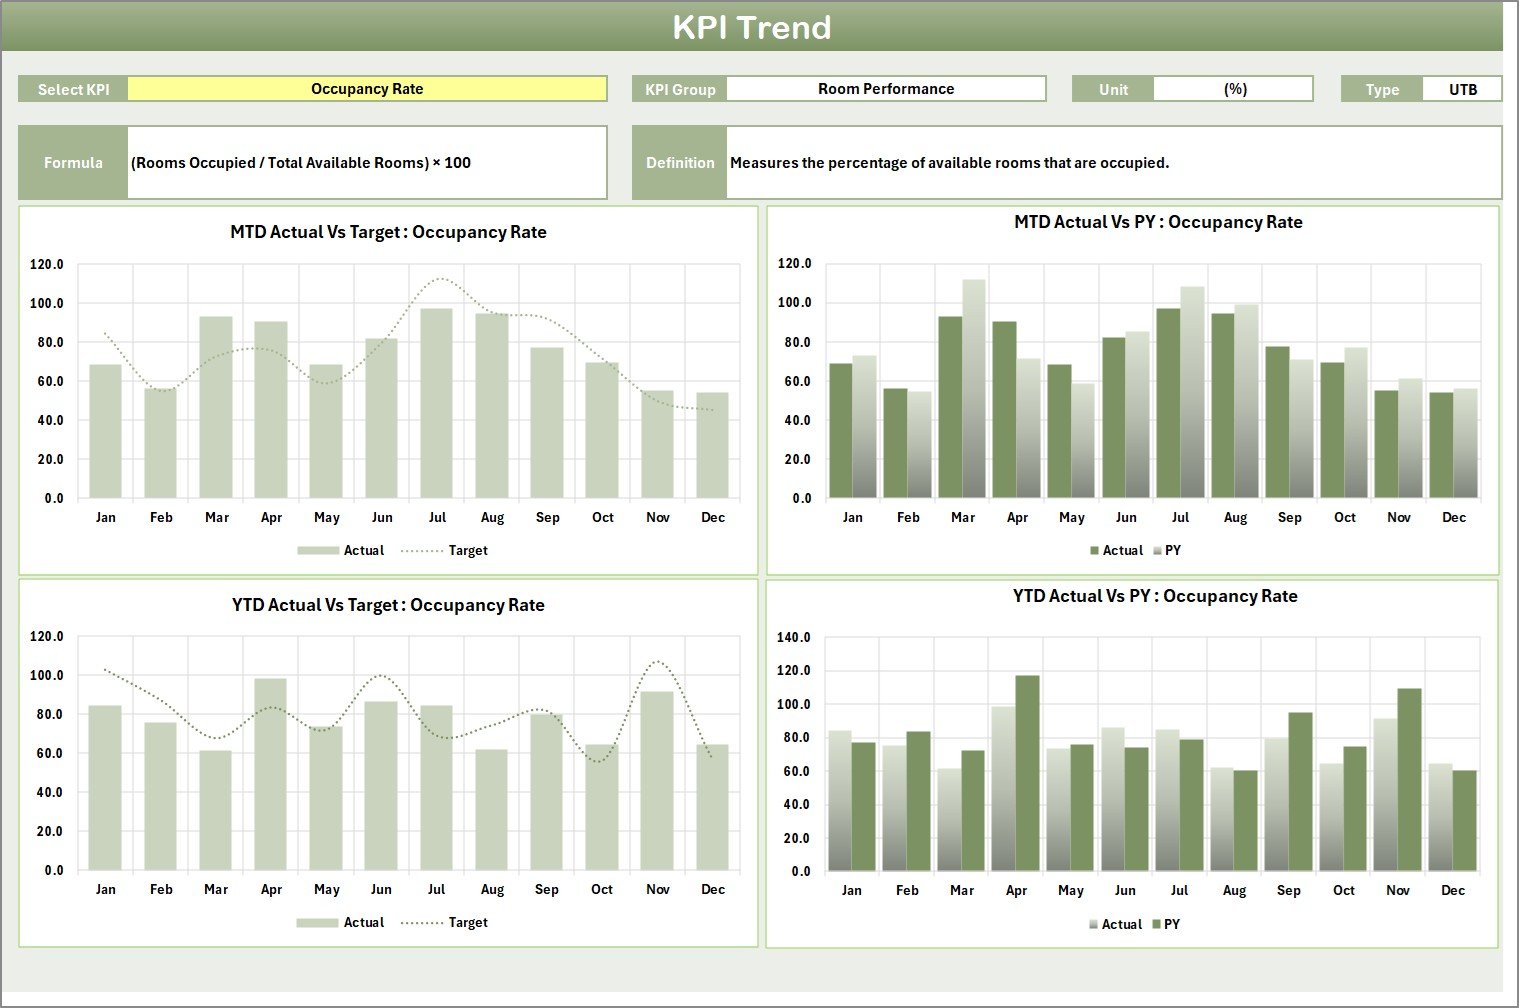
📉 KPI Trend Sheet:
Dive deeper into each KPI. Select any KPI from a dropdown to view its formula, type (UTB/LTB), and trend charts comparing Actual, Target, and Previous Year data.
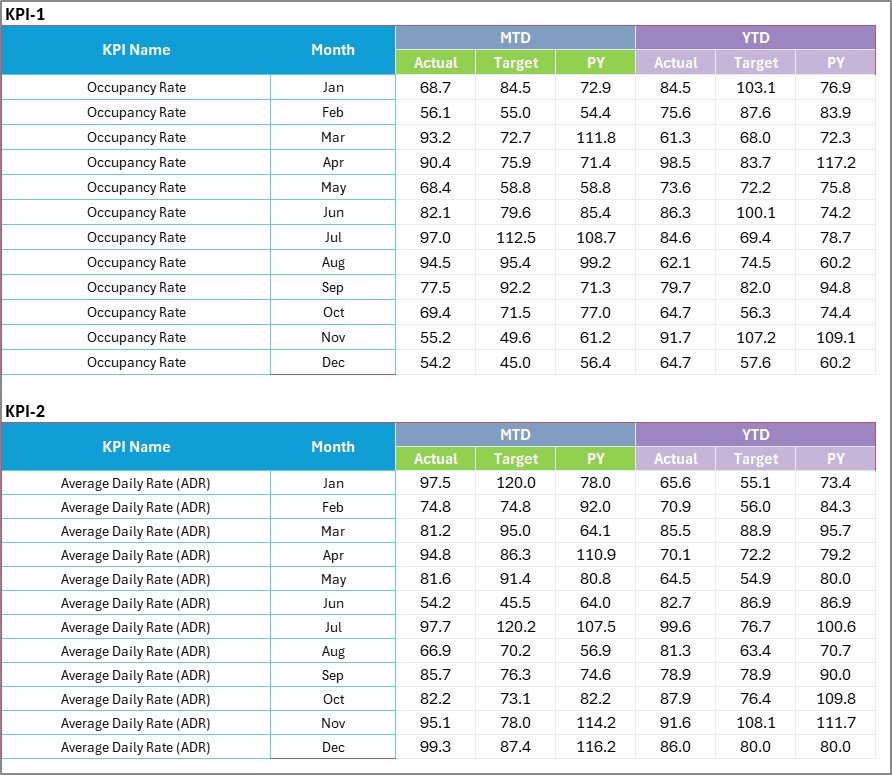
🗂️ Input Data Sheet:
The backbone of the system — record Actual, Target, and Previous Year values here. The scorecard and charts update automatically.
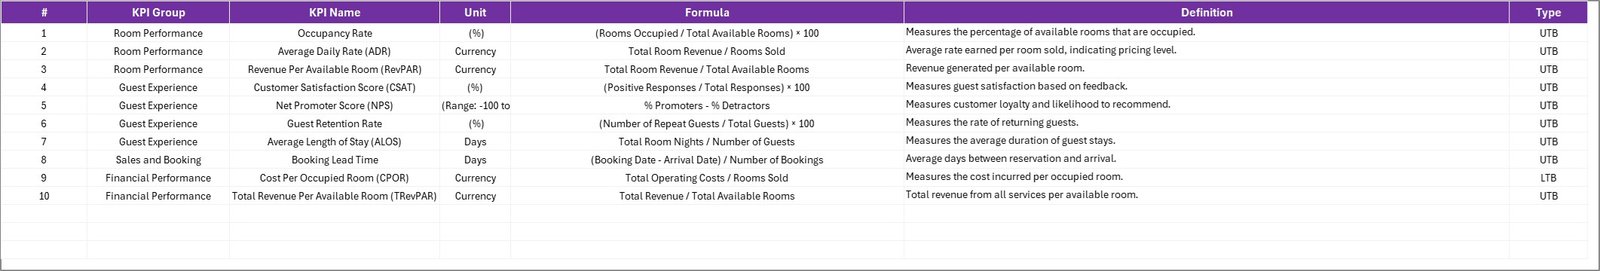
📘 KPI Definition Sheet:
Maintain transparency with KPI names, groups, formulas, units, and clear definitions. Everyone interprets the data the same way.
⚙️ How to Use the Hospitality KPI Scorecard in Excel
1️⃣ Enter Your Data:
Go to the Input Data Sheet and fill in your KPIs for each month.
2️⃣ Select the Month:
Choose the desired month and MTD/YTD from the dropdown menu on the Scorecard Sheet.
3️⃣ View Performance:
The dashboard auto-updates to show Actual vs Target and Previous Year comparisons.
4️⃣ Analyze Trends:
Use the KPI Trend Sheet to see how each KPI performs over time and identify growth opportunities.
5️⃣ Customize if Needed:
Add new KPIs or departments using the KPI Definition Sheet — the template adapts instantly.
👥 Who Can Benefit from This Hospitality KPI Scorecard
🏨 Hotel Managers: Monitor occupancy, revenue, and guest satisfaction in one glance.
🍽️ Restaurant Owners: Track average check value, service time, and customer ratings.
🏢 Hospitality Executives: Get a high-level overview of MTD and YTD progress.
📊 Operations Analysts: Identify trends and propose actionable improvements.
🧑💼 Franchise Owners: Manage multiple branches and compare performance across locations.
Whether you’re managing a boutique hotel or a large hospitality chain, this Excel scorecard makes performance tracking effortless, insightful, and impactful.


Reviews
There are no reviews yet.