In the healthcare manufacturing industry, precision and performance are everything ⚙️.
Each machine, instrument, or component you produce directly affects patient care, safety, and hospital operations — meaning quality can’t be left to chance.
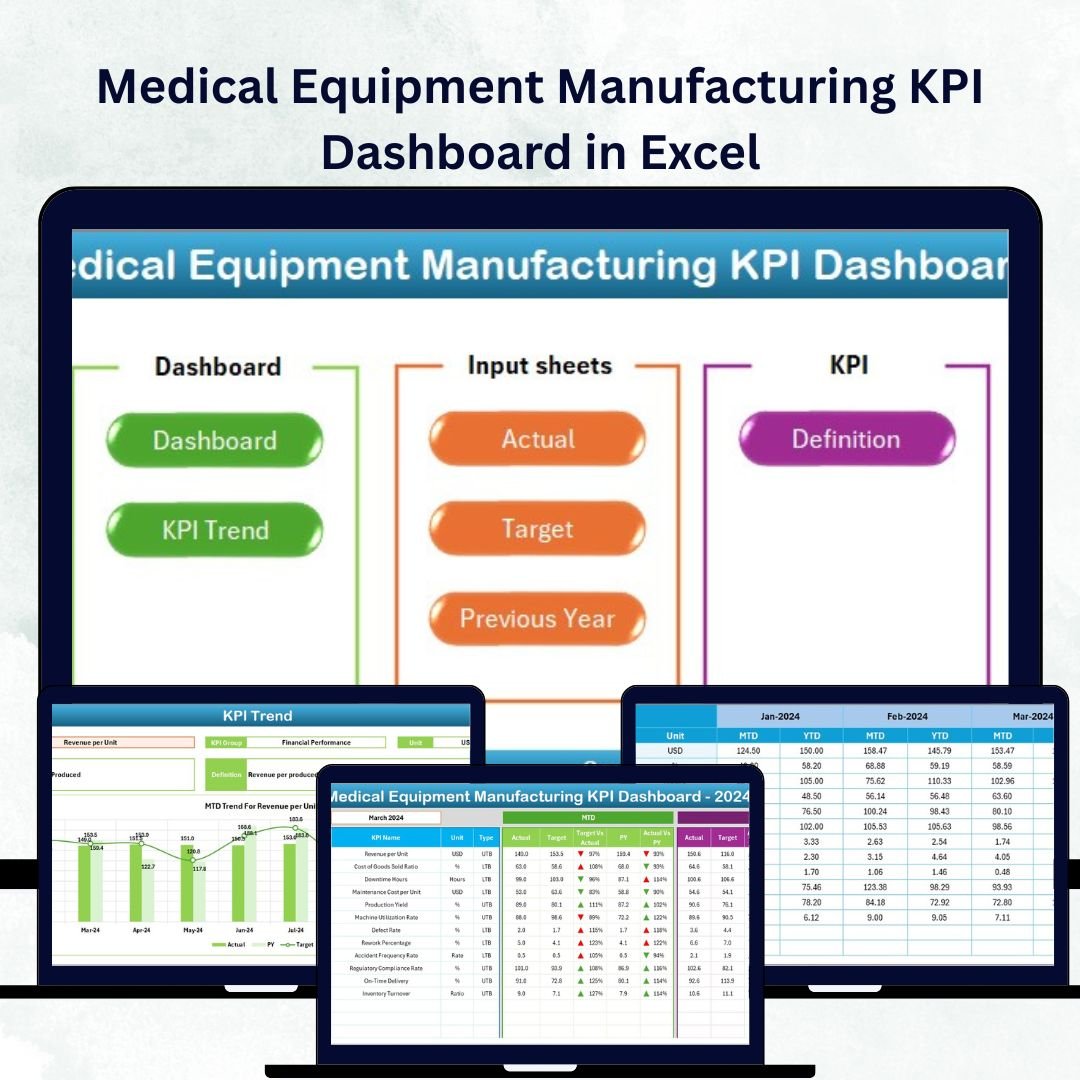
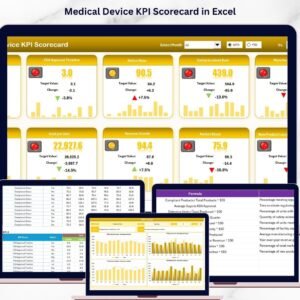
That’s where the Medical Equipment Manufacturing KPI Dashboard in Excel comes in.
This ready-to-use, data-driven Excel template helps manufacturers track, measure, and visualize key performance indicators (KPIs) such as production efficiency, defect rate, on-time delivery, and cost per unit — all in one interactive dashboard.
It transforms raw factory data into actionable insights, helping you enhance compliance, minimize downtime, and optimize resource utilization.
Built entirely in Excel, it’s the perfect solution for small to mid-sized medical manufacturers seeking powerful analytics without investing in complex ERP or BI tools. 🧠📊
⚙️ Key Features of Medical Equipment Manufacturing KPI Dashboard in Excel
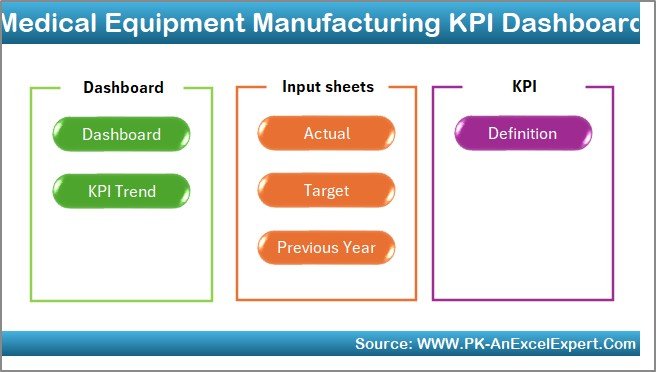
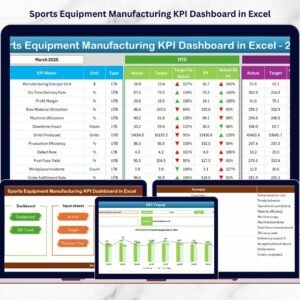
🏠 7 Organized Worksheets – Home, Dashboard, KPI Trend, Actual, Target, Previous Year, and KPI Definition.
📈 MTD & YTD Tracking – Compare Month-to-Date and Year-to-Date performance in real time.
🎯 Actual vs Target Comparisons – Instantly see whether goals are being achieved or missed.
🟢 Conditional Formatting – Green ▲ for improvement, Red ▼ for decline.
📅 Month Selector – Choose the reporting period dynamically.
💡 Historical Comparison – Review progress vs previous year for long-term insights.
📘 Comprehensive KPI Definitions – Transparent formulas and standardized units.
💰 100% Excel-Based – No macros or add-ins required — fast, lightweight, and editable.
📦 What’s Inside the Dashboard
1️⃣ Home Sheet – Navigation Hub
Easily jump to Dashboard, KPI Trend, Input, Target, or Definition sections.
Add your logo and colors for a branded, professional look.
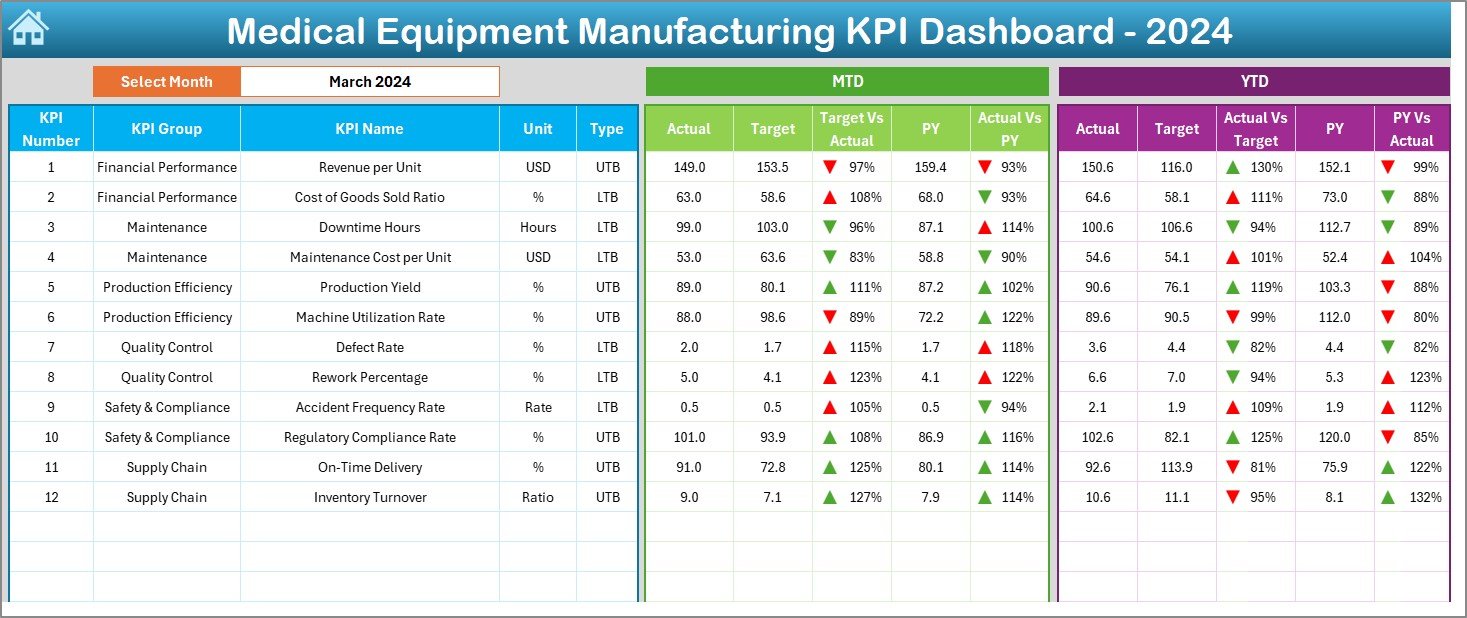
2️⃣ Dashboard Sheet – Performance Overview
The heart of your manufacturing insights ❤️.
Choose the reporting month (Cell D3) and view updated MTD/YTD charts automatically.
Analyze Actual vs Target, Actual vs Previous Year, and visualize trends with colored arrows.
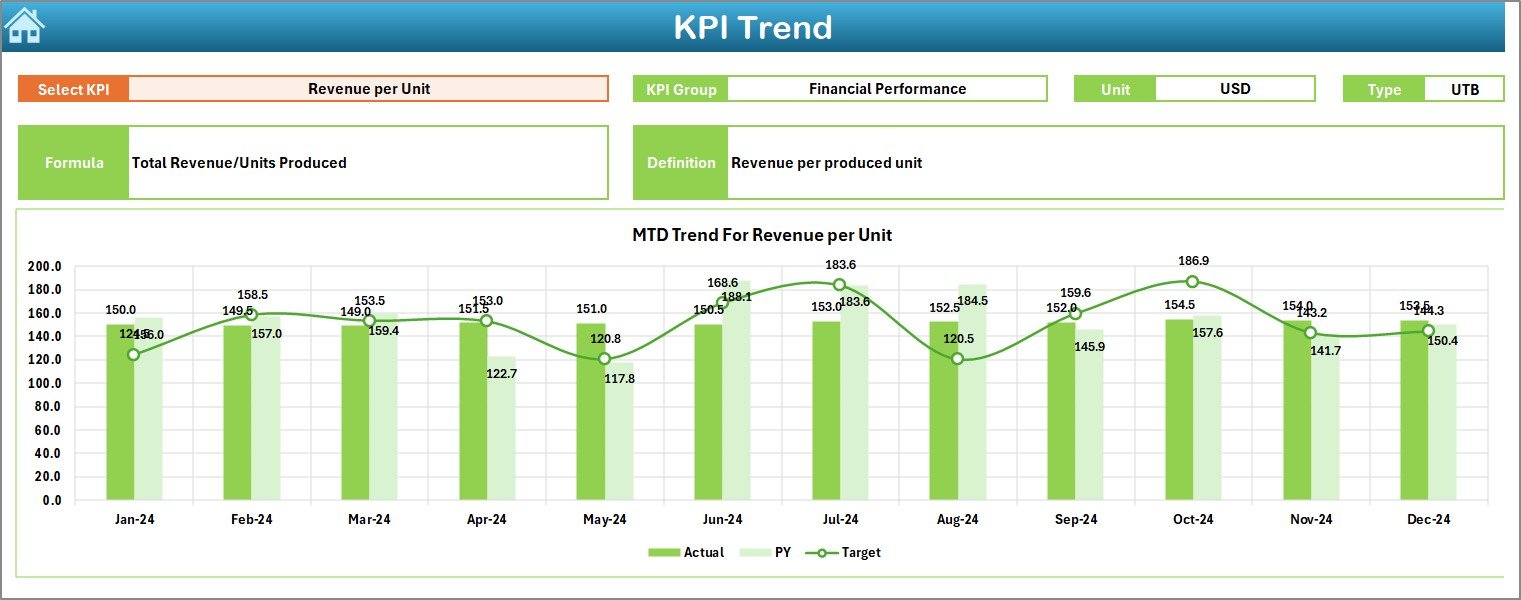
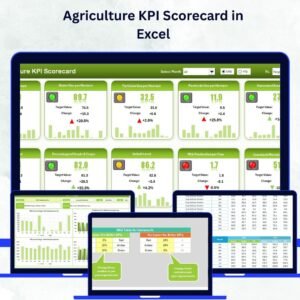
3️⃣ KPI Trend Sheet – Time-Series Analysis
Select a KPI (Cell C3) to explore its historical performance.
View KPI Group, Unit, Formula, and Definition alongside dual MTD/YTD trend charts.
Perfect for identifying cost spikes, quality issues, or process delays.
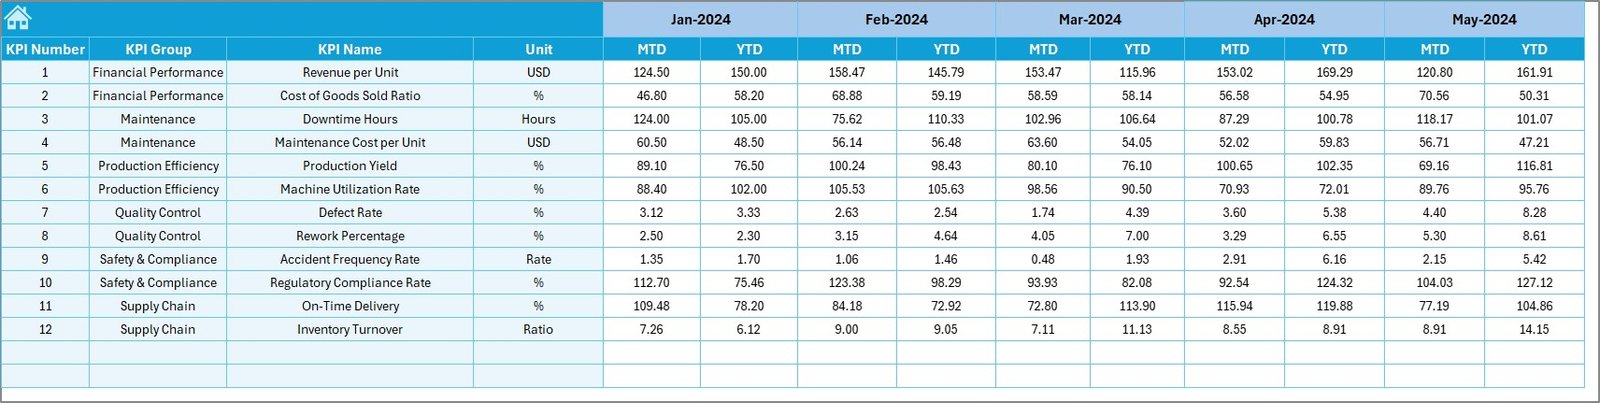
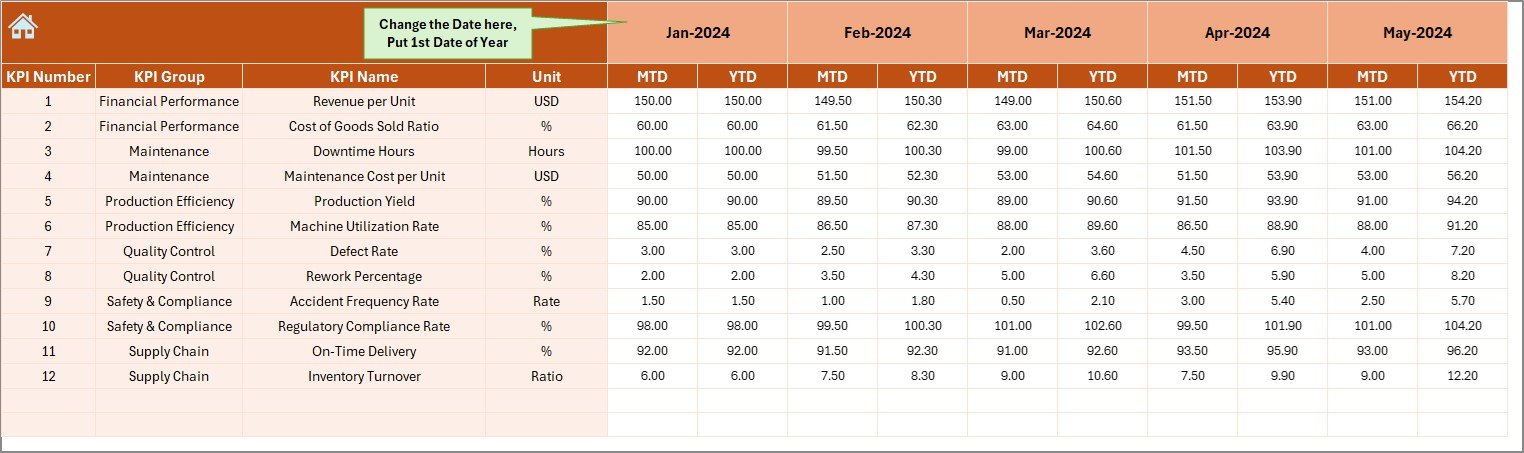
4️⃣ Actual Numbers Input Sheet – Data Entry Simplified
Enter monthly Actuals (MTD & YTD) — formulas auto-update the dashboard.
Use Cell E1 to set your fiscal start month.
5️⃣ Target Sheet – Goal Setting
Define monthly targets for every KPI.
Includes MTD and YTD columns for precise benchmarking.
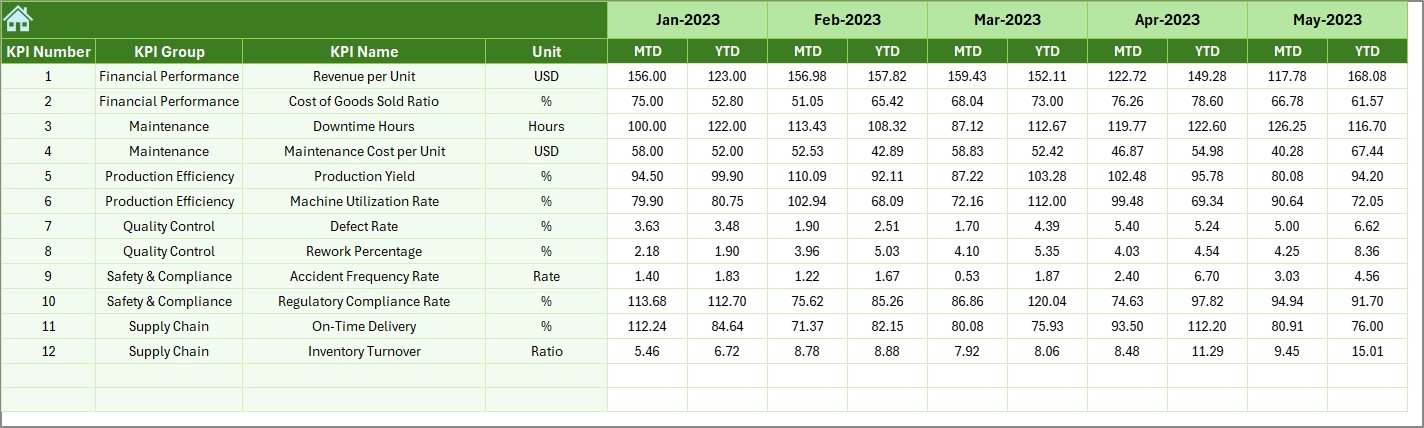
6️⃣ Previous Year Numbers Sheet – Contextual Analysis
Maintain previous-year records to track improvements or recurring challenges.
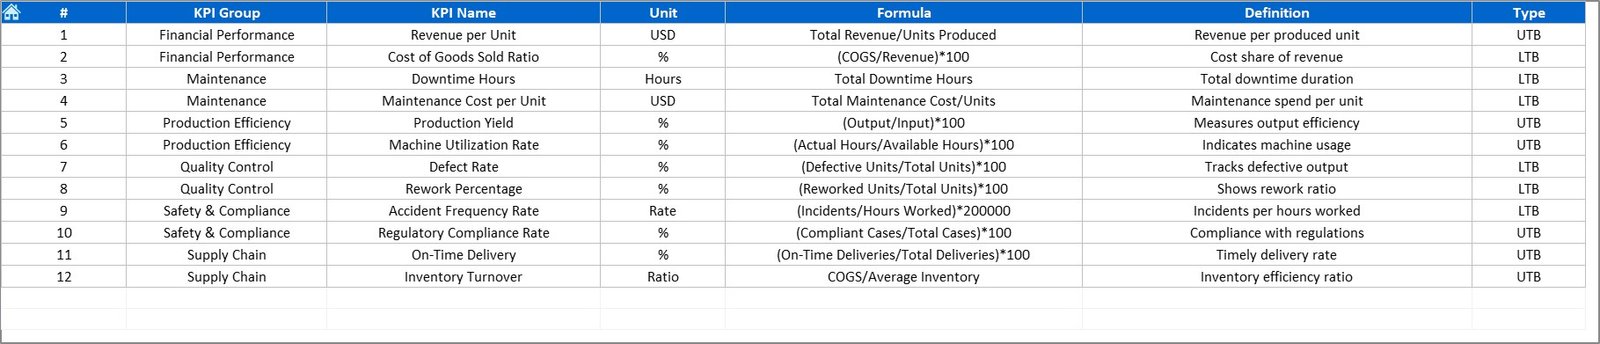
7️⃣ KPI Definition Sheet – Transparency & Alignment
Lists every KPI with Group, Unit, Formula, and Definition so teams stay on the same page.
🧭 How to Use the Dashboard
1️⃣ Define KPIs: Finalize the metrics you want to track.
2️⃣ Input Data: Fill in Actual, Target, and Previous Year values monthly.
3️⃣ Select Month: Choose a month in the Dashboard for automatic updates.
4️⃣ Analyze Trends: Use the KPI Trend Sheet for deeper performance review.
5️⃣ Review Results: Share insights in management meetings and take corrective action.
With these simple steps, you’ll gain real-time visibility into your manufacturing performance — from the factory floor to top management. 🏭
👥 Who Can Benefit from This Dashboard
🏭 Production Managers: Track equipment utilization and output per shift.
🔧 Quality Teams: Monitor defect rates, rework percentages, and audit scores.
📦 Supply Chain Leaders: Analyze supplier performance and lead-time trends.
💰 Finance Teams: Measure cost per unit and material waste reduction.
🧑💼 Executives: Get a holistic, visual snapshot of organizational performance.
Whether you produce surgical tools or diagnostic devices, this Excel dashboard helps ensure consistent quality, regulatory compliance, and profitability.


Reviews
There are no reviews yet.