The fashion business moves at lightning speed ⚡ — from sketches to runways, every step counts.
To stay ahead of the curve, fashion brands need more than creativity — they need data-driven clarity.
That’s where the Fashion KPI Scorecard in Excel comes in.
This ready-to-use Excel template helps fashion designers, retailers, and manufacturers track the metrics that truly matter — from production efficiency and on-time delivery to sales growth, inventory turnover, and quality performance.
It transforms everyday numbers into actionable insights, empowering you to make faster, smarter business decisions.
No expensive software. No coding. Just Excel — simple, visual, and powerful. 💡
⚙️ Key Features of Fashion KPI Scorecard in Excel
📊 Four Integrated Sheets – Scorecard, KPI Trend, Input Data, and KPI Definition — each serving a focused purpose.
🎯 Actual vs Target Comparison – Instantly see whether each KPI meets expectations.
📈 MTD & YTD Analysis – Evaluate Month-to-Date and Year-to-Date performance in one click.
🟢 Visual Indicators – Color-coded icons (green for success, red for improvement needed).
📅 Dropdown Selections – Choose months or toggle between MTD/YTD easily.
💡 Fully Customizable – Add or edit KPIs, formulas, and visuals to suit your brand’s operations.
💰 Cost-Effective Excel Tool – Avoid complex BI tools; manage everything in one spreadsheet.
👥 Cross-Department Clarity – Standardize KPI definitions across design, production, and sales.
📦 What’s Inside the Fashion KPI Scorecard
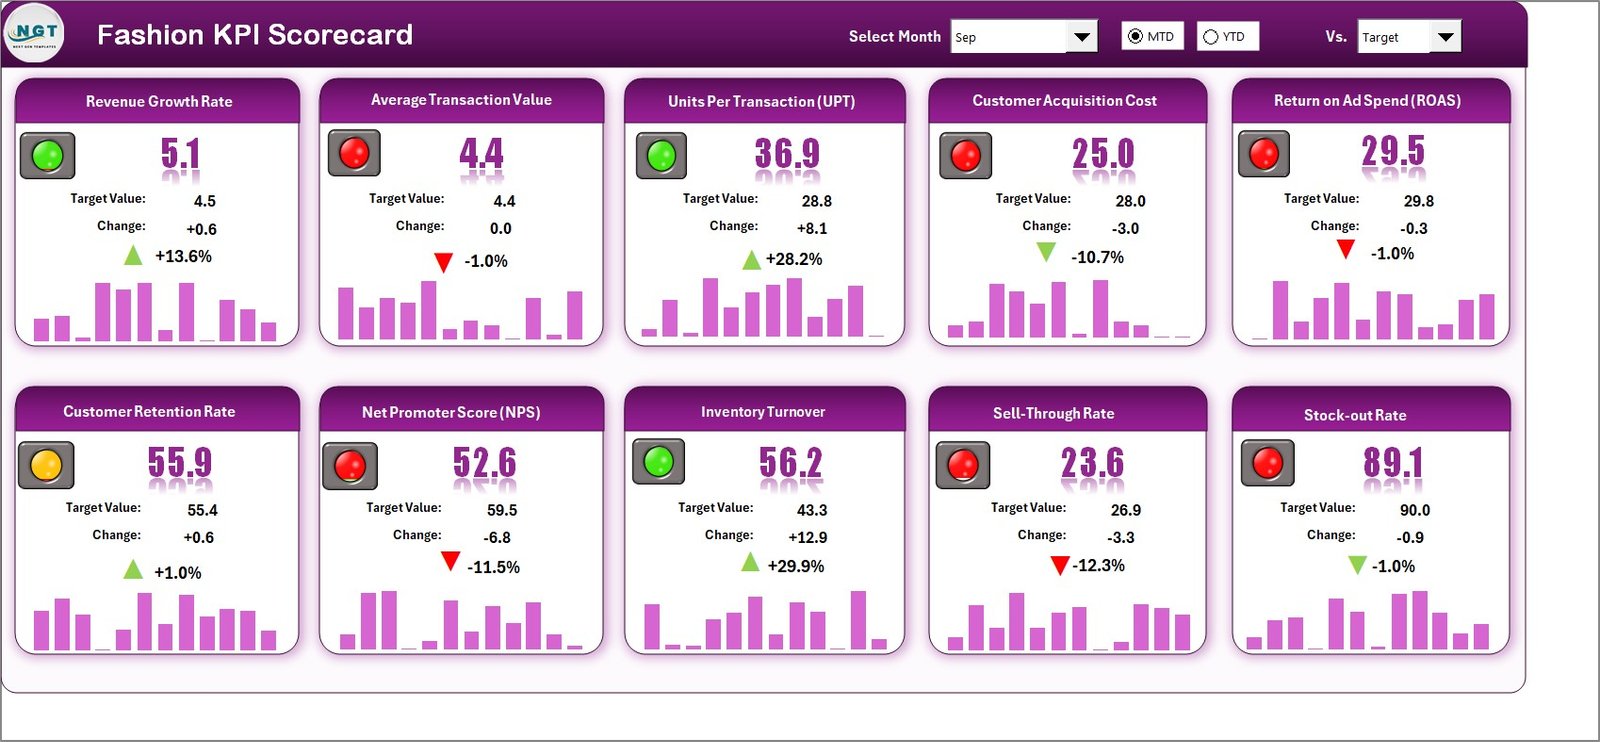
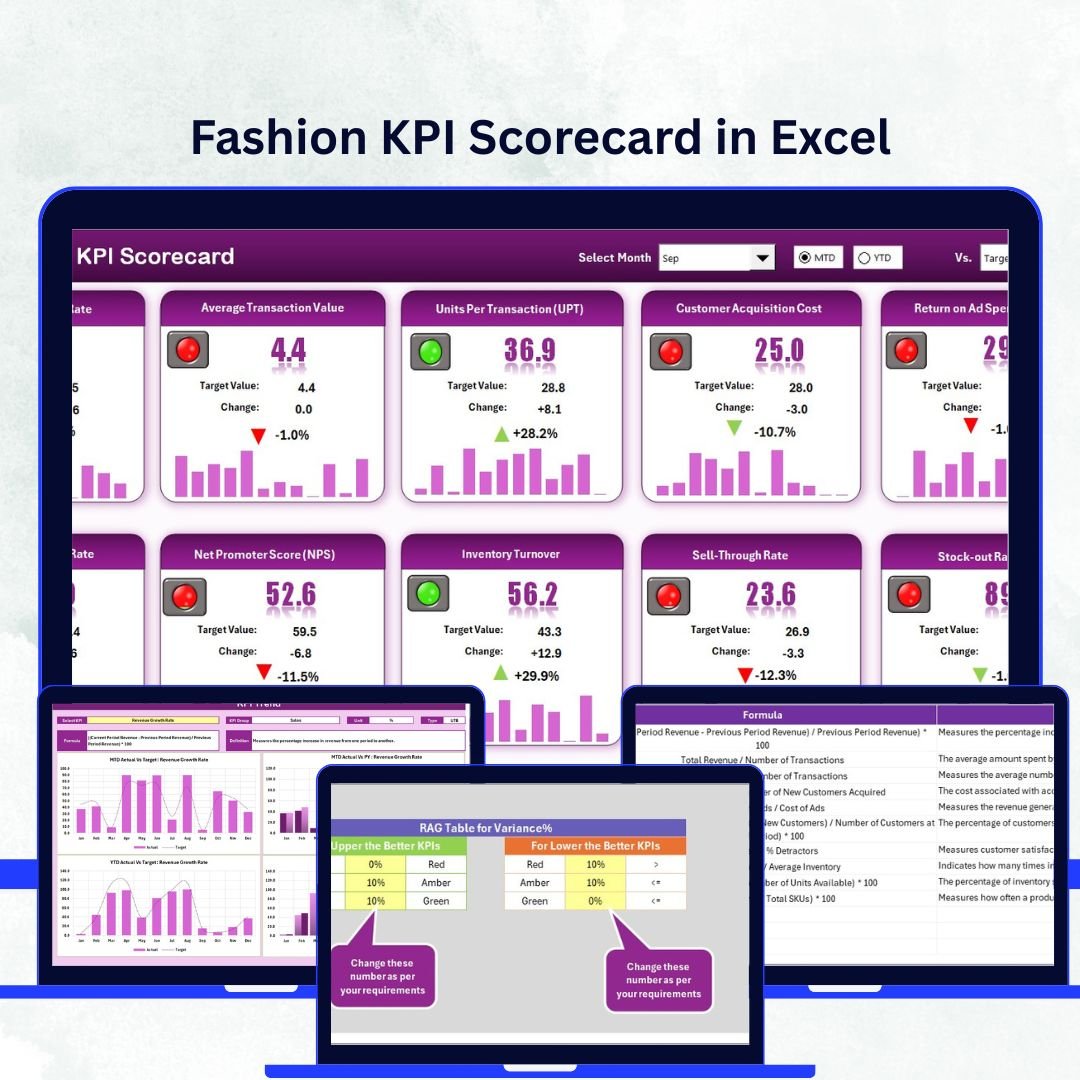
1️⃣ Scorecard Sheet – The Main Dashboard
Your all-in-one control panel for fashion performance.
View all KPIs, Actual vs Target results, and visual status icons instantly.
Dropdown menus let you switch between months and MTD/YTD modes effortlessly.
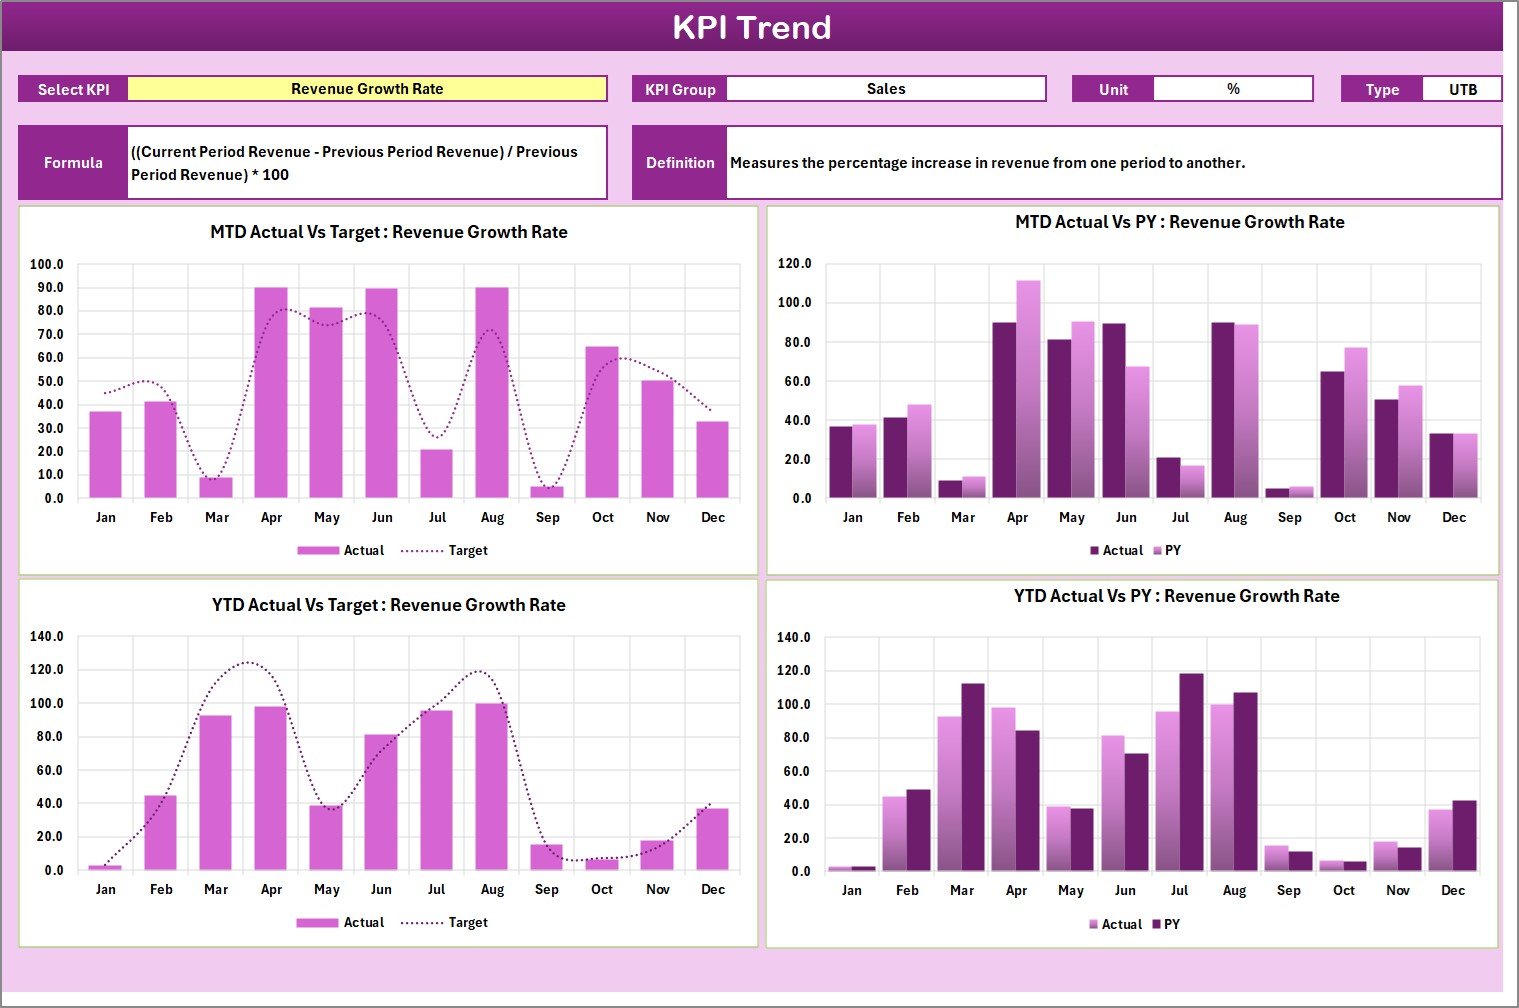
2️⃣ KPI Trend Sheet – Analyze Patterns Over Time
Select a KPI from the dropdown (cell C3) to see detailed metrics and trend charts.
Displays KPI Group, Unit, Type (UTB/LTB), Formula, and Definition.
Perfect for spotting seasonal trends or recurring performance gaps.
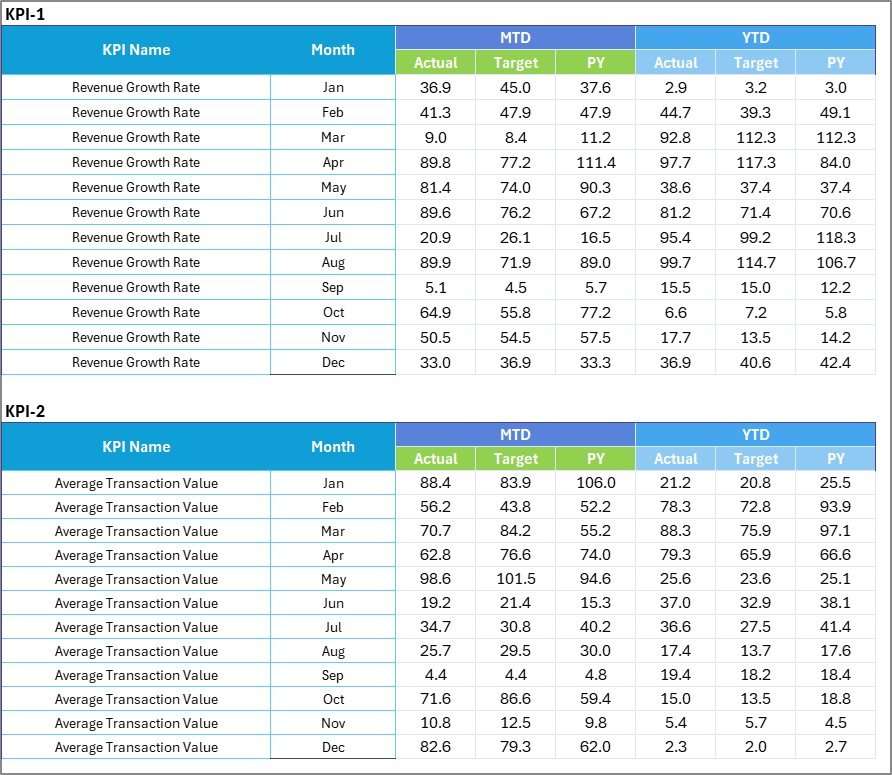
3️⃣ Input Data Sheet – Your Data Engine
Input monthly Actual and Target values.
Clean structure ensures accuracy and automatic updates across sheets.
Reduce manual errors with validated data entry.
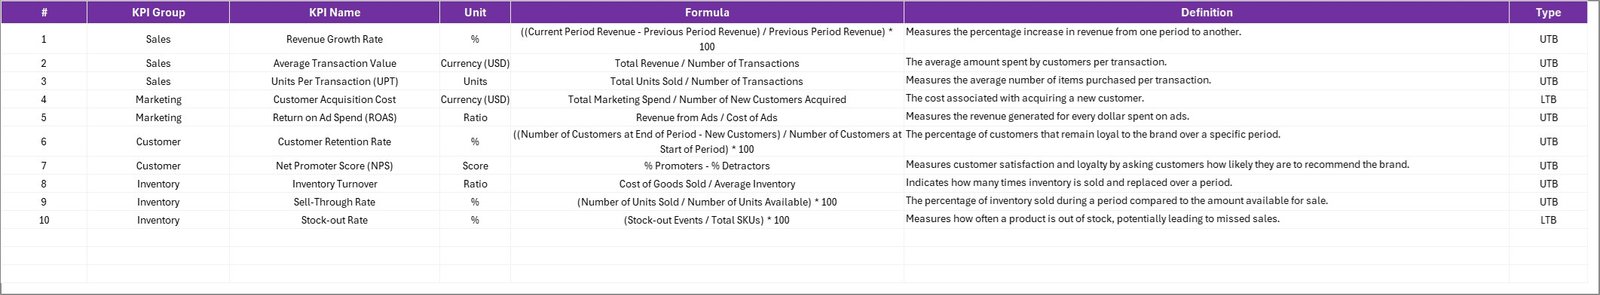
4️⃣ KPI Definition Sheet – Standardized Metrics Library
Lists all KPIs with Groups, Units, Formulas, and Definitions.
Guarantees consistency across departments, from designers to merchandisers.
🧭 How to Use the Fashion KPI Scorecard in Excel
1️⃣ Define Your KPIs: Start by listing key metrics in the KPI Definition Sheet.
2️⃣ Input Data Monthly: Enter Actuals and Targets in the Input Data Sheet.
3️⃣ Review the Scorecard: Use dropdowns to visualize MTD/YTD comparisons instantly.
4️⃣ Analyze Trends: Open the KPI Trend Sheet to understand performance shifts.
5️⃣ Share & Act: Discuss insights in meetings and implement targeted improvements.
Within minutes, you’ll have a real-time performance snapshot of your fashion business — from design to retail. 👗📈
👥 Who Can Benefit from This Scorecard
👩🎨 Design Teams: Track new-collection success and design-to-market speed.
🏭 Production Managers: Monitor on-time delivery, efficiency, and defect rates.
🛍️ Retail Teams: Analyze conversion rates, AOV, and return trends.
📦 Supply Chain Leaders: Evaluate inventory turnover and supplier reliability.
💰 Finance Teams: Measure cost control, revenue, and profitability.
🌿 Sustainability Officers: Track eco-friendly metrics and waste reduction goals.
Whether you manage a boutique label or a global brand, this Excel scorecard helps you turn creative passion into measurable performance.
🔗 Click here to read the Detailed Blog Post
🎥 Visit our YouTube channel to learn step-by-step video tutorials
Watch the step-by-step video tutorial:


Reviews
There are no reviews yet.