Managing payroll efficiently is critical for every organization — accuracy, timeliness, and compliance directly impact employee satisfaction and business performance. 💼 That’s why the Payroll Management KPI Dashboard in Excel is your one-stop solution for tracking, analyzing, and optimizing payroll operations — all within a single, automated Excel workbook.
This ready-to-use dashboard empowers HR and finance professionals to monitor payroll metrics such as processing time, accuracy rate, compliance percentage, and total payroll cost — turning complex data into clear, actionable insights. 📊
⚙️ Key Features of Payroll Management KPI Dashboard in Excel
✨ Automated Calculations: No manual updates! Once you enter data, all metrics — including MTD and YTD — update automatically.
📈 Dynamic Charts: Visualize payroll trends using clean, interactive graphs and conditional formatting indicators.
📋 Customizable KPIs: Add or modify payroll KPIs to suit your organization’s unique requirements.
🔄 Integrated Data Flow: Every worksheet is interlinked to maintain data consistency and accuracy.
🧮 Comprehensive Reporting: Track payroll cost, compliance rate, and accuracy — all in one place.
📅 MTD/YTD Toggle: Analyze monthly and yearly performance with just one selection.
🎨 Color-Coded Indicators: Identify performance gaps instantly through visual cues.
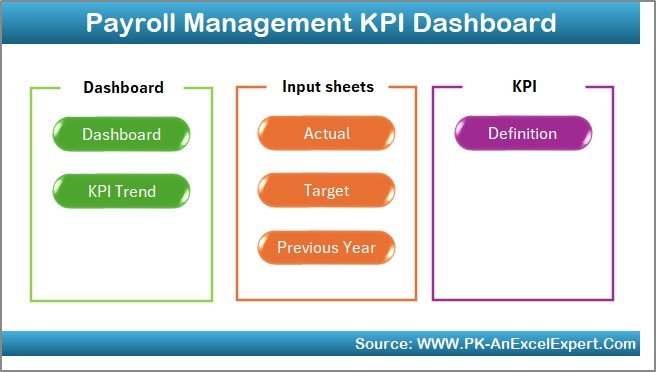
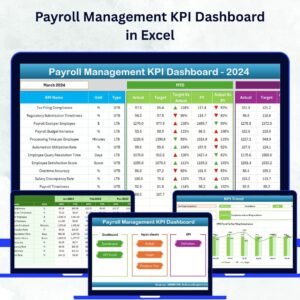
📦 What’s Inside the Payroll Management KPI Dashboard
This Excel dashboard consists of 7 well-structured worksheets, each serving a unique purpose:
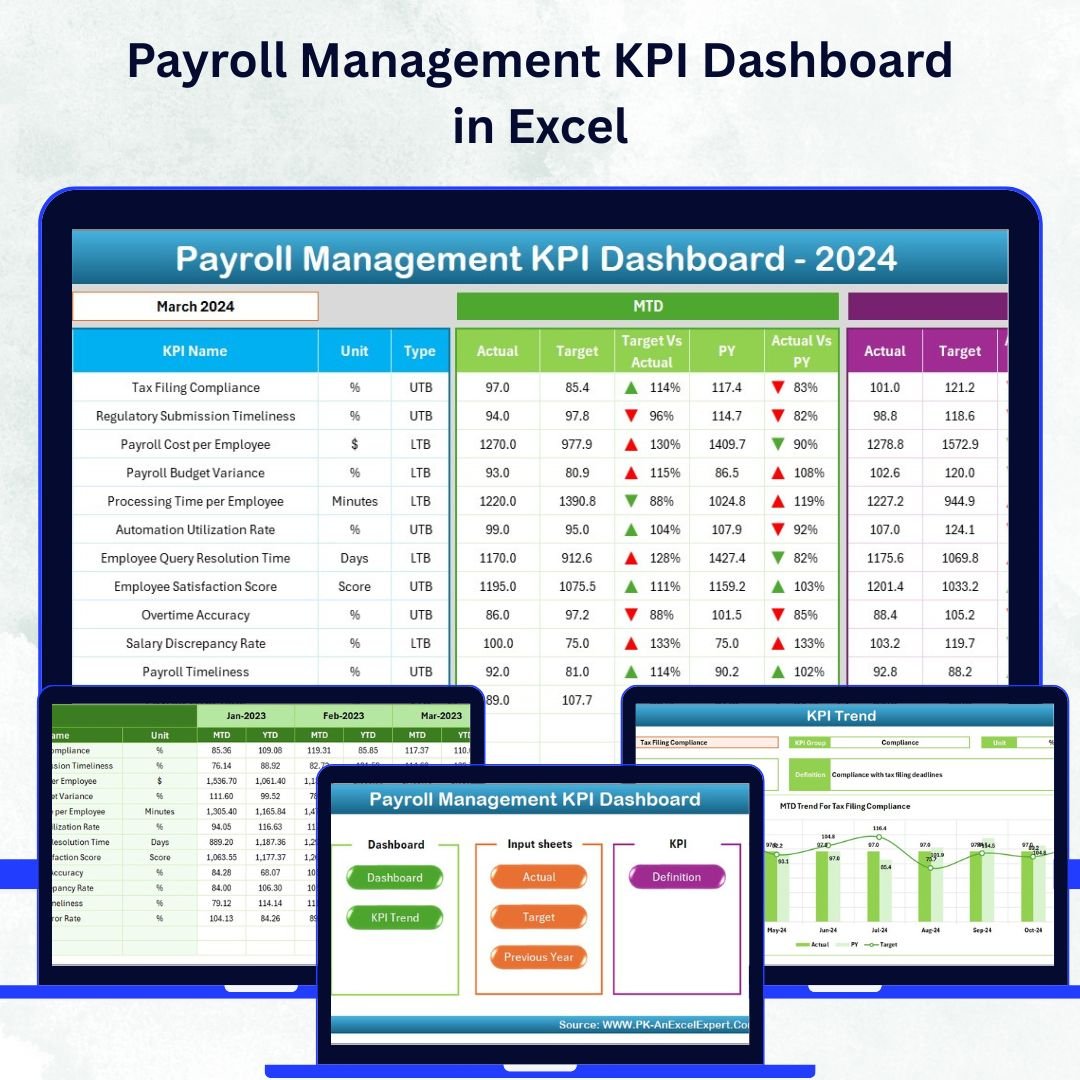
1️⃣ Home Sheet: Acts as your navigation hub with quick buttons to access all sheets easily.
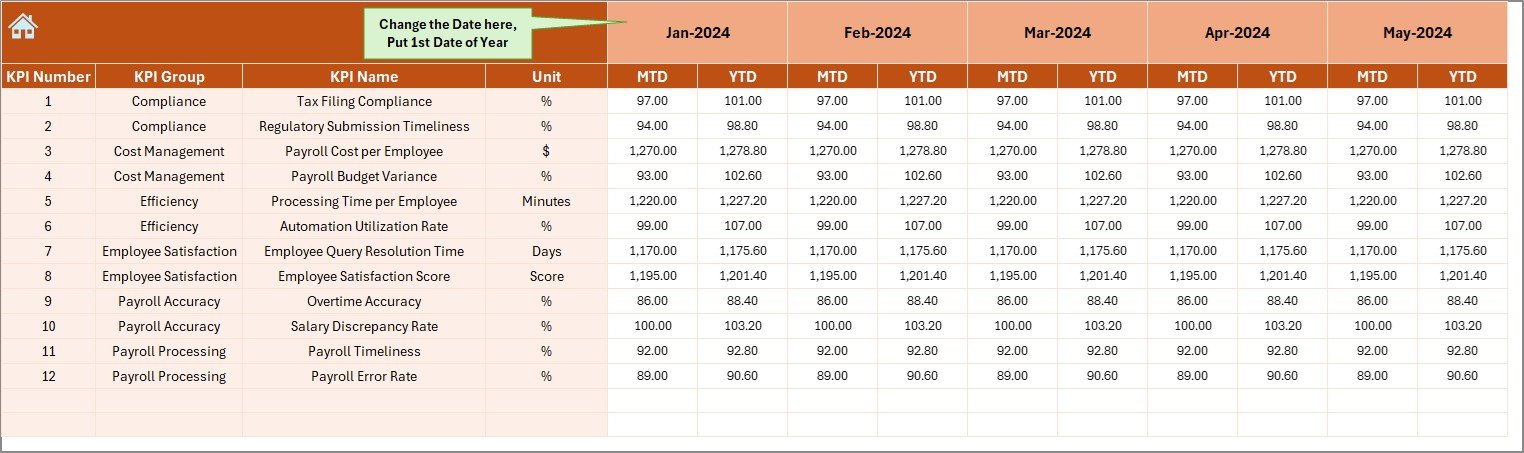
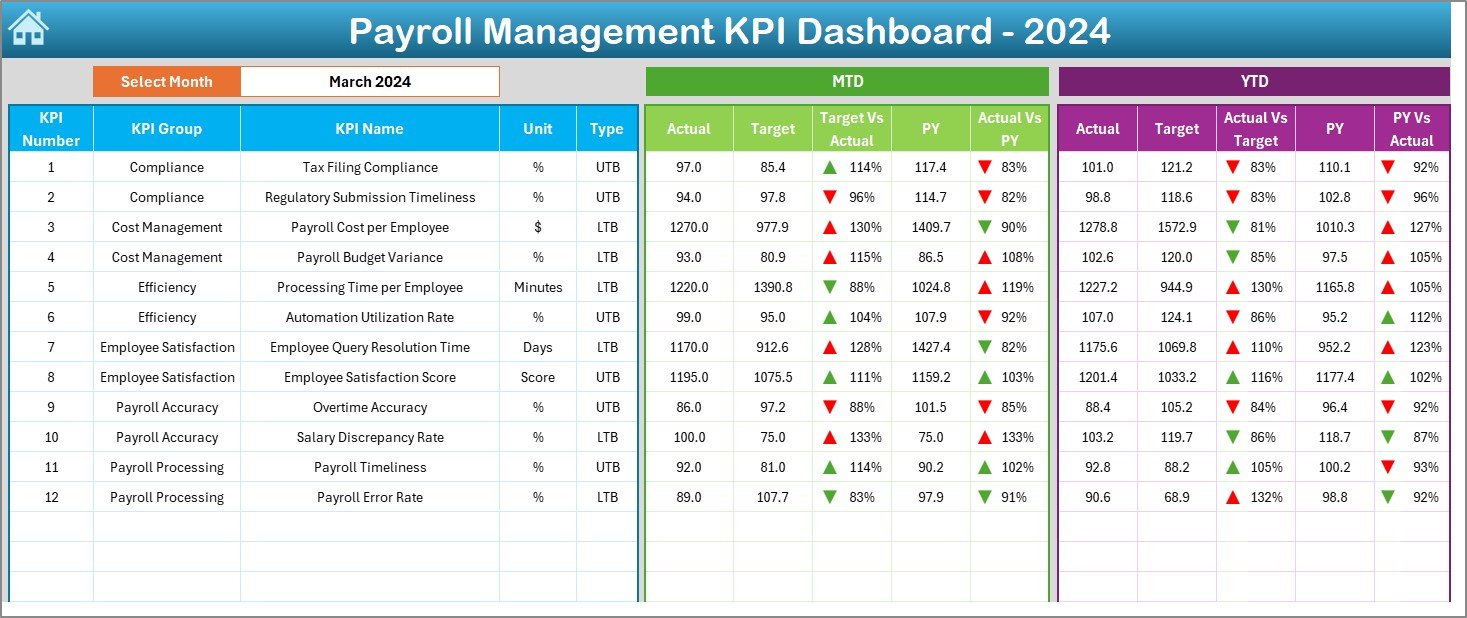
2️⃣ Dashboard Sheet: The visual centerpiece showing MTD and YTD data, Actual vs Target, and Previous Year comparisons with trend arrows.
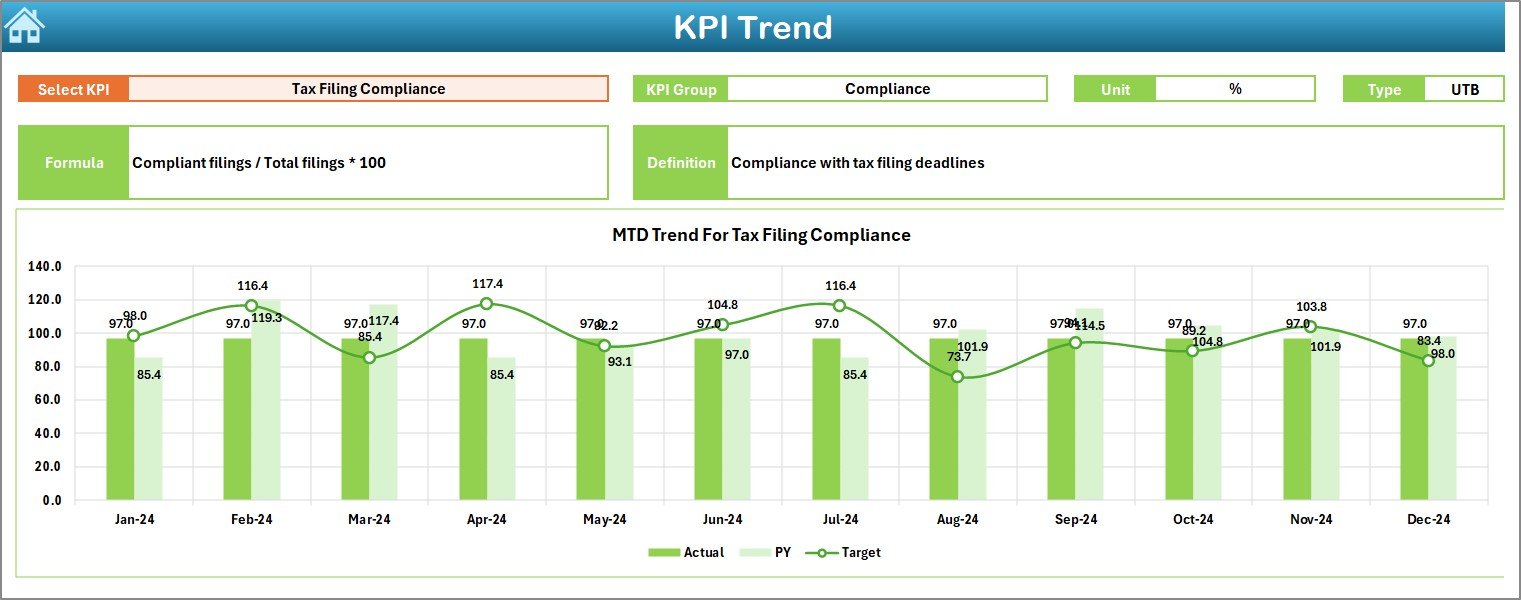
3️⃣ KPI Trend Sheet: Drill into each KPI’s performance across time with detailed trend charts.
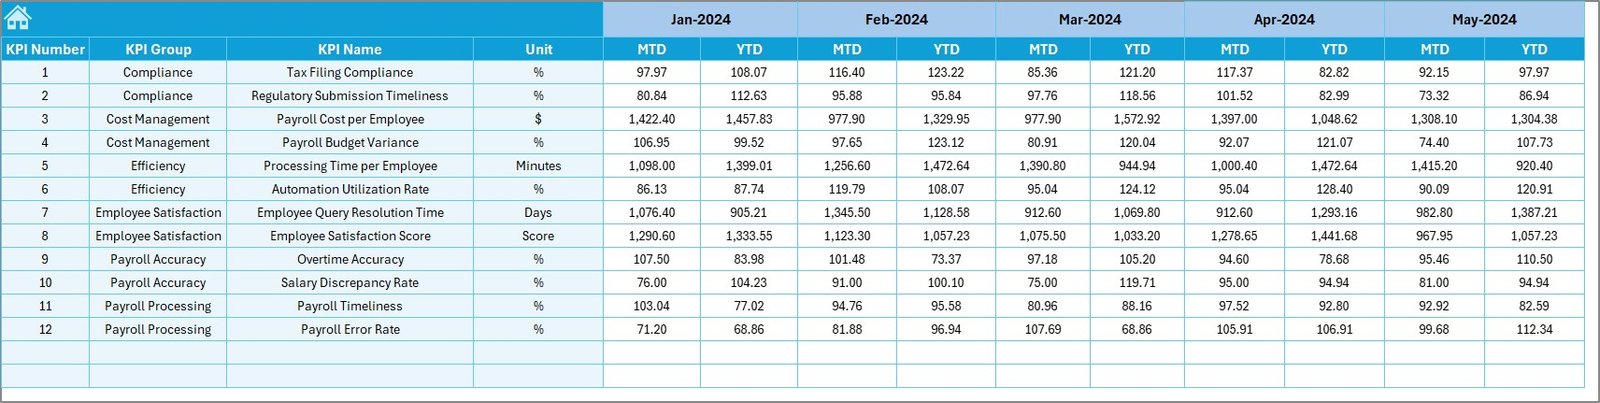
4️⃣ Actual Numbers Input Sheet: Enter real-time payroll data for seamless updates.
5️⃣ Target Sheet: Set your monthly or annual goals for every KPI.
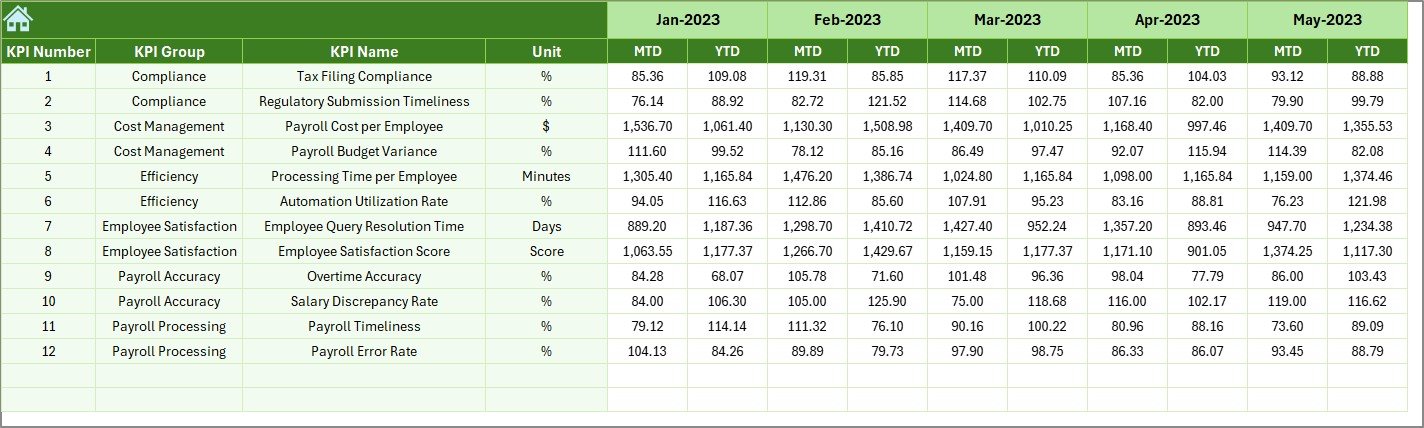
6️⃣ Previous Year Sheet: Compare performance year-over-year to identify improvements or declines.
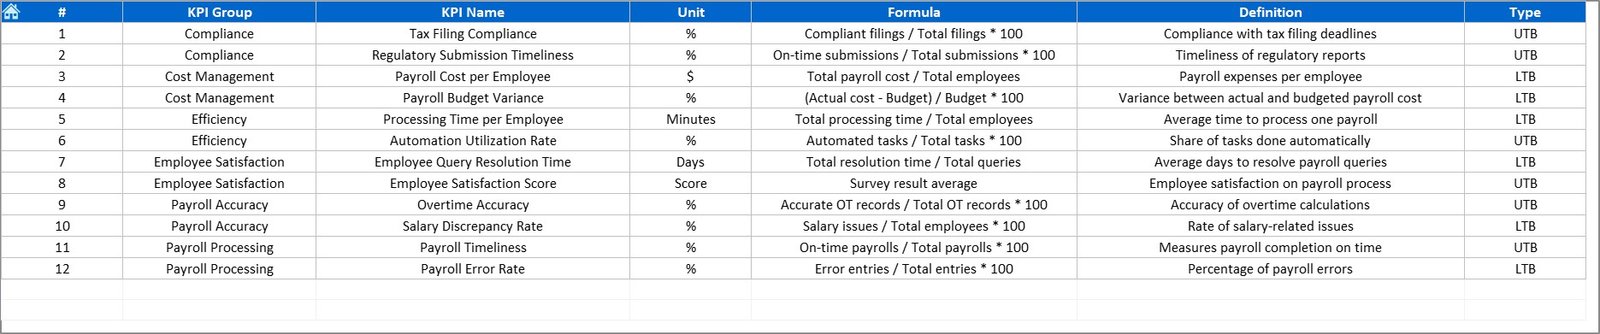
7️⃣ KPI Definition Sheet: Includes all KPI details — group, formula, unit, and type — ensuring clarity and standardization.
Every component is designed to make payroll tracking intuitive and fully transparent for users at any level.
🧭 How to Use the Payroll Management KPI Dashboard
🪄 Step 1: Start on the Home Sheet and use the navigation buttons to explore.
📊 Step 2: Enter your data for each month in the Actual Numbers Input sheet.
🎯 Step 3: Define your performance targets in the Target sheet.
📆 Step 4: Use the Dashboard tab to view automatic calculations, comparisons, and charts.
📉 Step 5: Analyze trends in the KPI Trend sheet and make data-driven payroll decisions.
That’s it — no coding, no macros setup, and no complex formulas needed! The entire system works seamlessly within Excel.
👥 Who Can Benefit from This Payroll KPI Dashboard
🏢 HR Departments: Track payroll accuracy, compliance, and employee satisfaction effortlessly.
💰 Finance Teams: Analyze payroll cost trends and improve budgeting efficiency.
📊 Payroll Outsourcing Firms: Deliver accurate performance reports and meet SLAs effectively.
🏛️ Government Agencies: Ensure payroll compliance and timely processing.
🧑💼 Small Business Owners: Manage payroll without investing in expensive HRMS tools.
📈 Auditors & Consultants: Evaluate process performance for strategic recommendations.
Whether you handle payroll for a handful of employees or thousands, this Excel-based dashboard ensures accuracy, transparency, and efficiency — all in a single, easy-to-use file.


Reviews
There are no reviews yet.