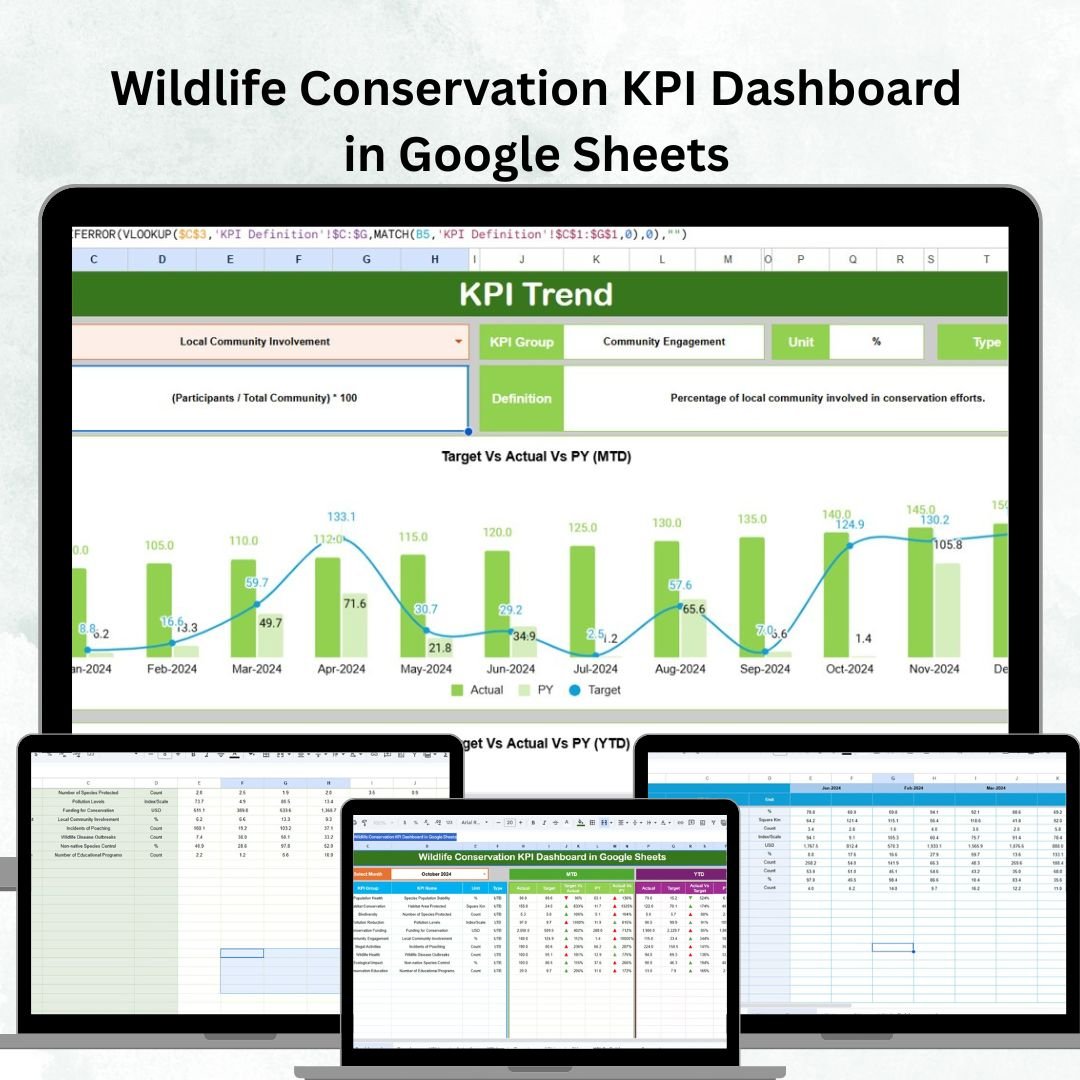

Managing wildlife conservation programs requires precision, teamwork, and real-time data insights. The Wildlife Conservation KPI Dashboard in Google Sheets is a ready-to-use, interactive tool designed to help organizations, NGOs, and research institutions track performance indicators related to biodiversity, habitat restoration, and species protection — all in one centralized dashboard.Wildlife Conservation KPI Dashboard in Google Sheets
With this professional Google Sheets template, you can transform scattered data into meaningful insights and make faster, smarter conservation decisions. 🌍
🧭 Key Features of Wildlife Conservation KPI Dashboard in Google Sheets
✅ All-in-One Dashboard View – Access Month-to-Date (MTD) and Year-to-Date (YTD) data instantly and compare Actual vs Target vs Previous Year (PY).
✅ Smart Drop-Down Filters – Choose any month from the drop-down menu to see real-time results update automatically.
✅ Dynamic Trend Charts – Visualize KPI movement over time with easy-to-read graphs and arrows showing performance improvements or declines.
✅ Collaborative & Cloud-Based – Work together with multiple team members in real time from anywhere in the world.
✅ Easy Customization – Add or edit KPIs effortlessly in the KPI Definition sheet based on your unique conservation goals.
✅ Data Transparency – Maintain consistency and clarity with standardized KPI definitions and formulas.
✅ Automatic Comparisons – Instantly measure progress against targets and the previous year to identify gaps and growth areas.
📊 What’s Inside the Wildlife Conservation KPI Dashboard in Google Sheets
This Google Sheets file includes six structured worksheets, each designed for a specific function:
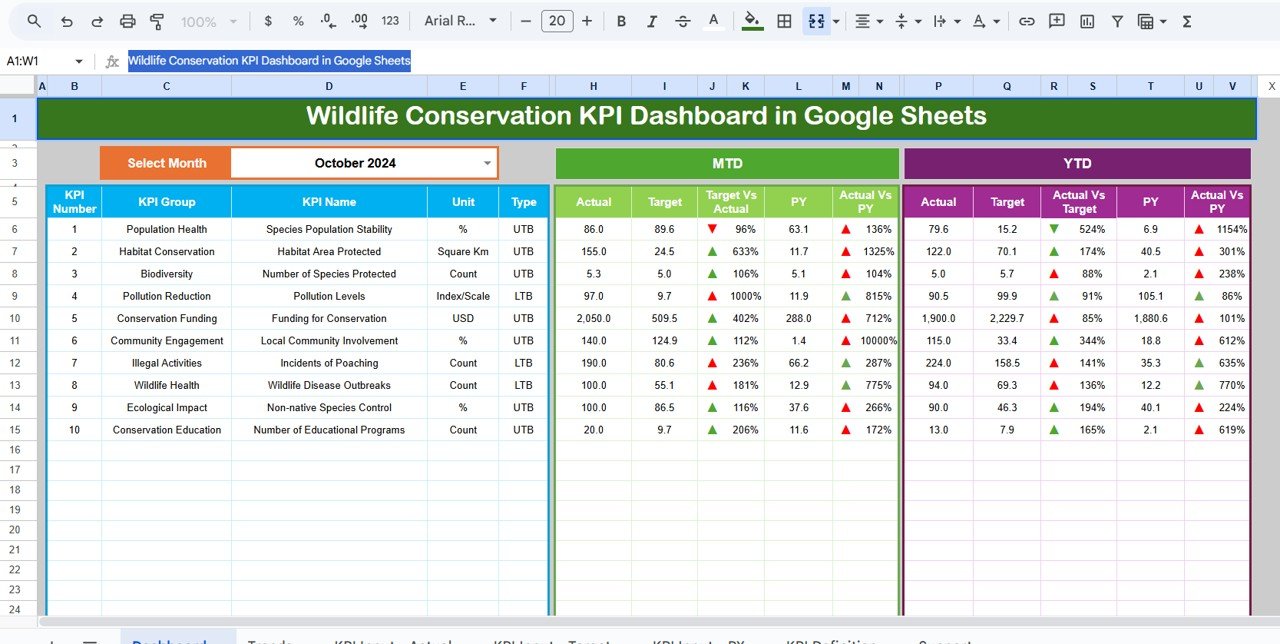
1️⃣ Dashboard Sheet Tab – The heart of the template, offering a snapshot of overall conservation performance. View MTD and YTD metrics, target comparisons, and color-coded arrows to spot quick wins or problem areas.
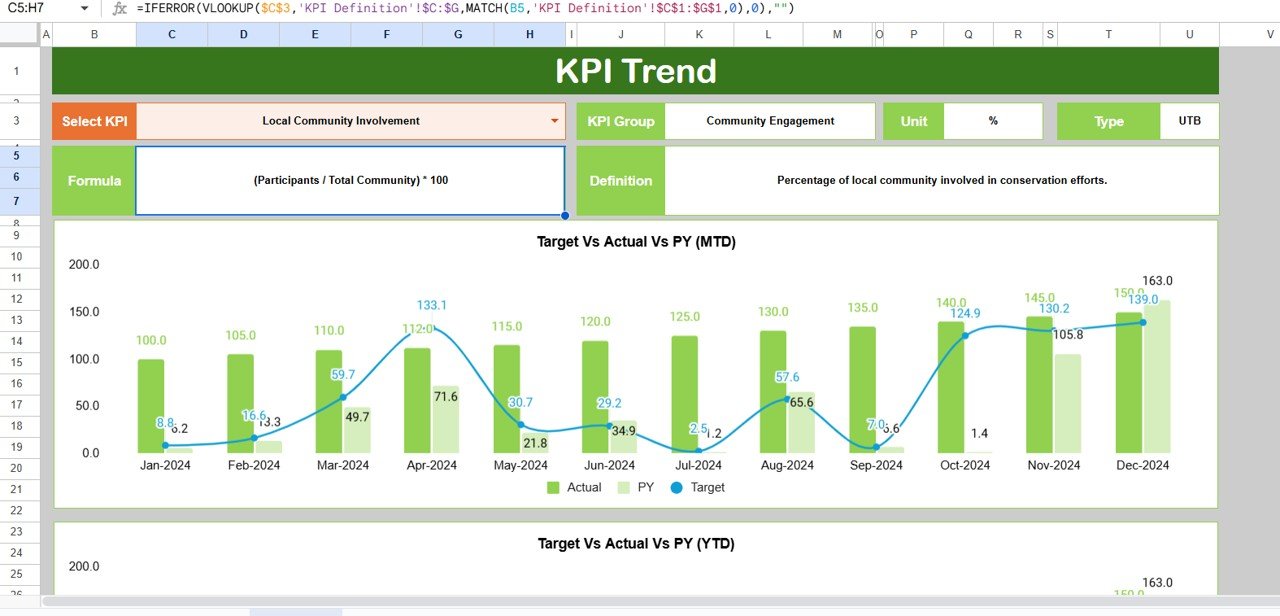
2️⃣ Trend Sheet Tab – Analyze trends for each KPI using dropdown selection. Visual charts show how metrics evolve month by month for deeper insight.
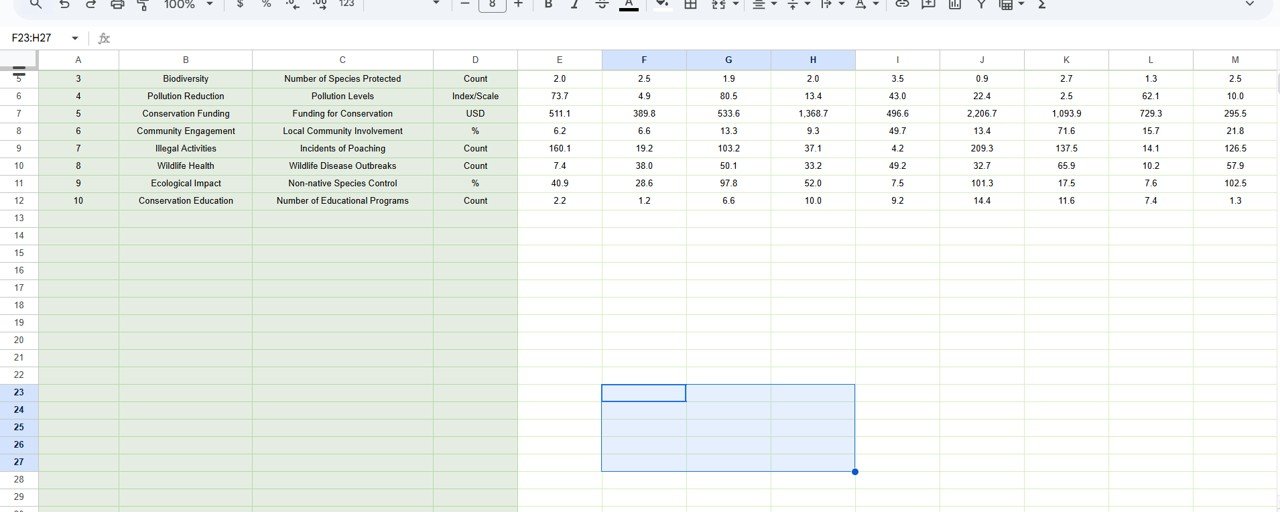
3️⃣ Actual Numbers Input Sheet – Enter your project’s real-world data here. The sheet automatically updates your visuals and calculations.
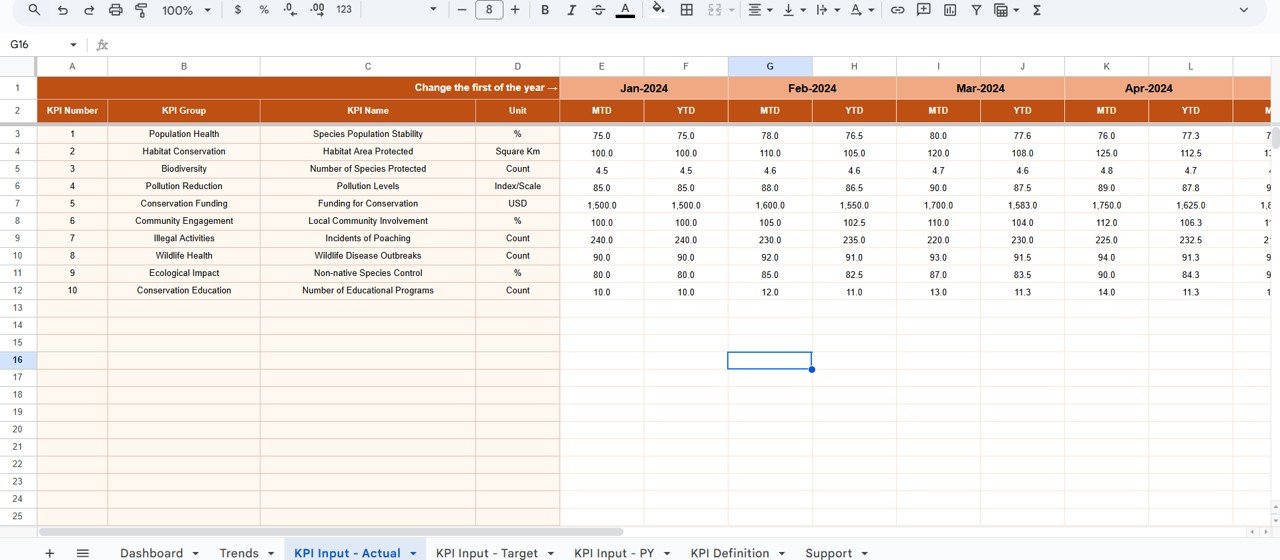
4️⃣ Target Sheet Tab – Set realistic monthly and yearly goals for each KPI to measure performance accurately.
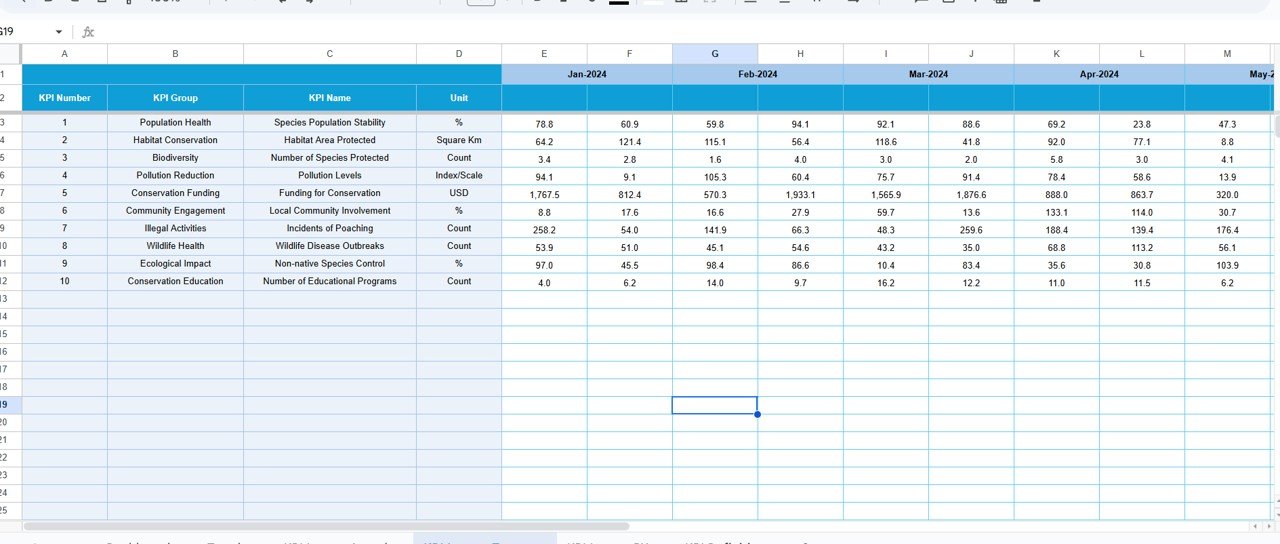
5️⃣ Previous Year Numbers Sheet – Compare historical results with current progress to evaluate long-term effectiveness.
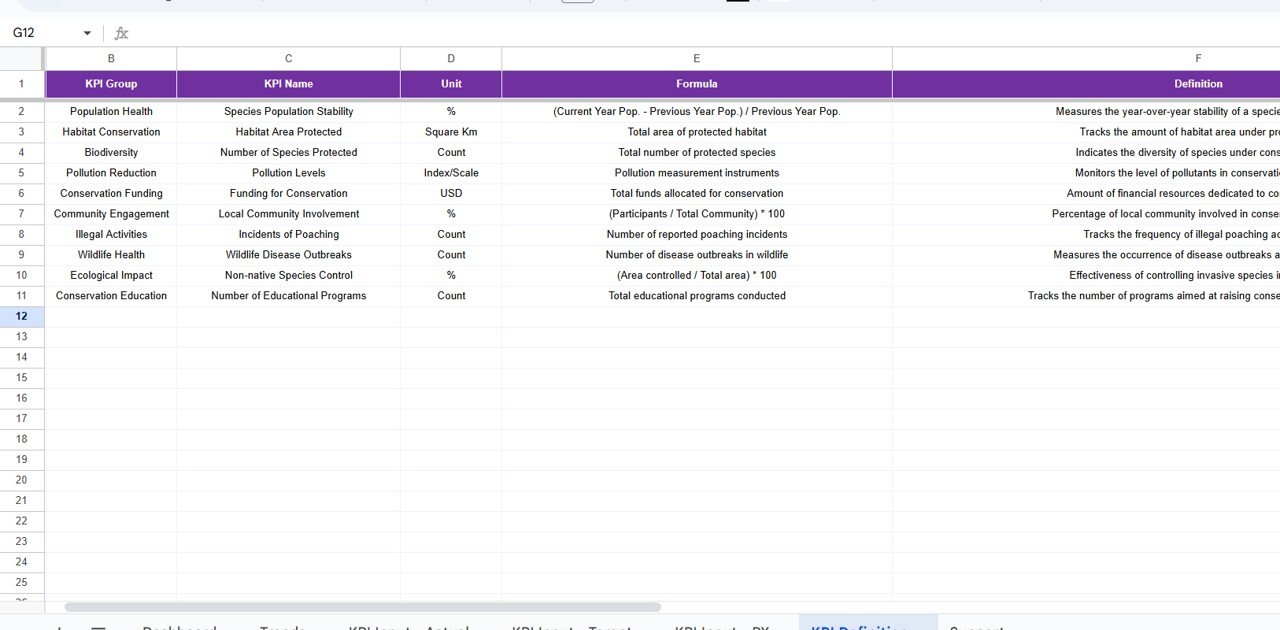
6️⃣ KPI Definition Sheet Tab – Maintain clarity by defining each KPI’s name, formula, unit, and type (UTB/LTB).
This complete structure ensures your conservation data stays organized, comparable, and actionable.
🦓 How to Use the Wildlife Conservation KPI Dashboard
💡 Step 1: Open the dashboard and select the desired month from the drop-down (cell D3).
💡 Step 2: Enter your actual data in the “Actual Numbers Input” sheet.
💡 Step 3: Fill in your targets in the “Target Sheet” and update the previous year’s data.
💡 Step 4: Navigate to the “Dashboard” tab to see real-time visuals and progress metrics.
💡 Step 5: Review trends in the “Trend Sheet” to analyze performance over time.
With just a few clicks, your team can identify what’s working, what’s lagging, and where to focus next — all without needing any coding or advanced BI tools! ⚡Wildlife Conservation KPI Dashboard in Google Sheets
🦋 Who Can Benefit from This Wildlife Conservation KPI Dashboard
🌱 Wildlife NGOs – Monitor species recovery and conservation outcomes effectively.
🏛️ Government Departments – Track biodiversity metrics and policy implementation results.
🔬 Research Institutions – Analyze species population trends and ecosystem health indicators.
🤝 Donors & Sponsors – Evaluate funding utilization and conservation return on investment (ROI).
🌿 Community Programs – Assess local awareness campaigns and habitat restoration initiatives.
This template bridges the gap between data and decision-making, helping every stakeholder work toward measurable conservation success.Wildlife Conservation KPI Dashboard in Google Sheets


Reviews
There are no reviews yet.