
Delivering exceptional client experiences is the foundation of building strong business relationships. Yet, without a structured system, it’s difficult to capture, analyze, and act on client feedback effectively. The Client Satisfaction Survey Dashboard in Excel is a ready-to-use solution designed to simplify client feedback management, helping organizations track satisfaction scores, monitor trends, and identify areas for improvement.
This dashboard transforms raw survey data into actionable insights through visual reports, KPIs, and analysis sheets. Whether you’re a service provider, consultant, or corporate team, this Excel-based dashboard ensures you can monitor client experiences in real-time, segment insights by region or service, and make data-driven improvements to boost retention and loyalty.
🔑 Key Features of the Client Satisfaction Survey Dashboard
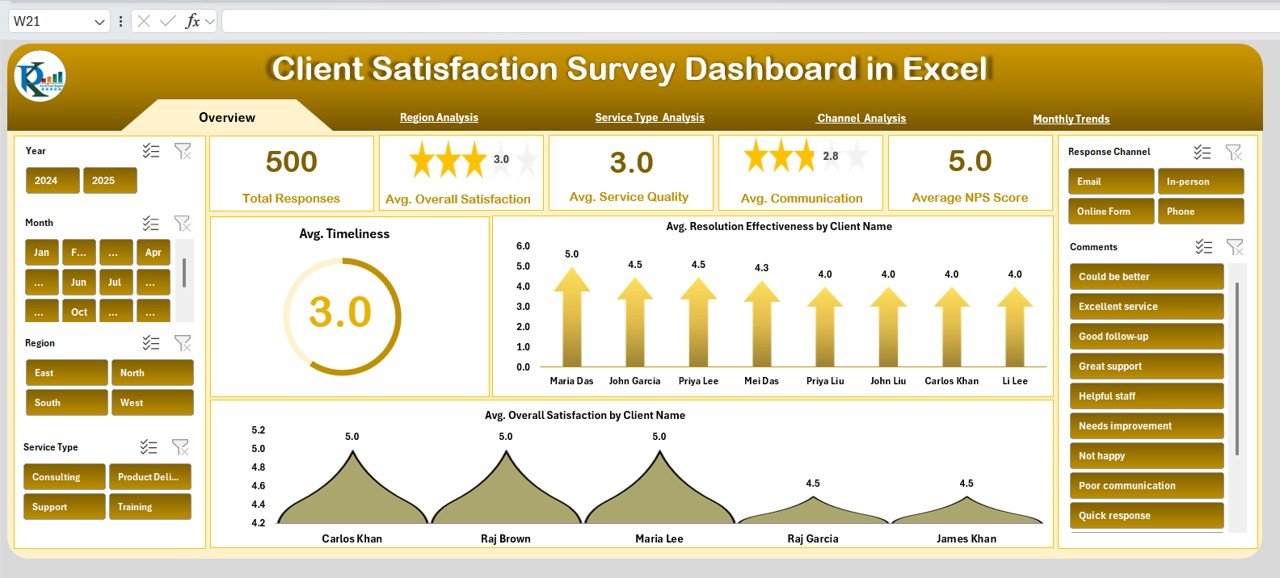
📌 Overview Dashboard
-
Cards showing Total Responses, Avg. Overall Satisfaction, Avg. Service Quality, Avg. Communication, and Avg. NPS Score
-
Charts for Timeliness, Resolution Effectiveness by Client, and Satisfaction by Client
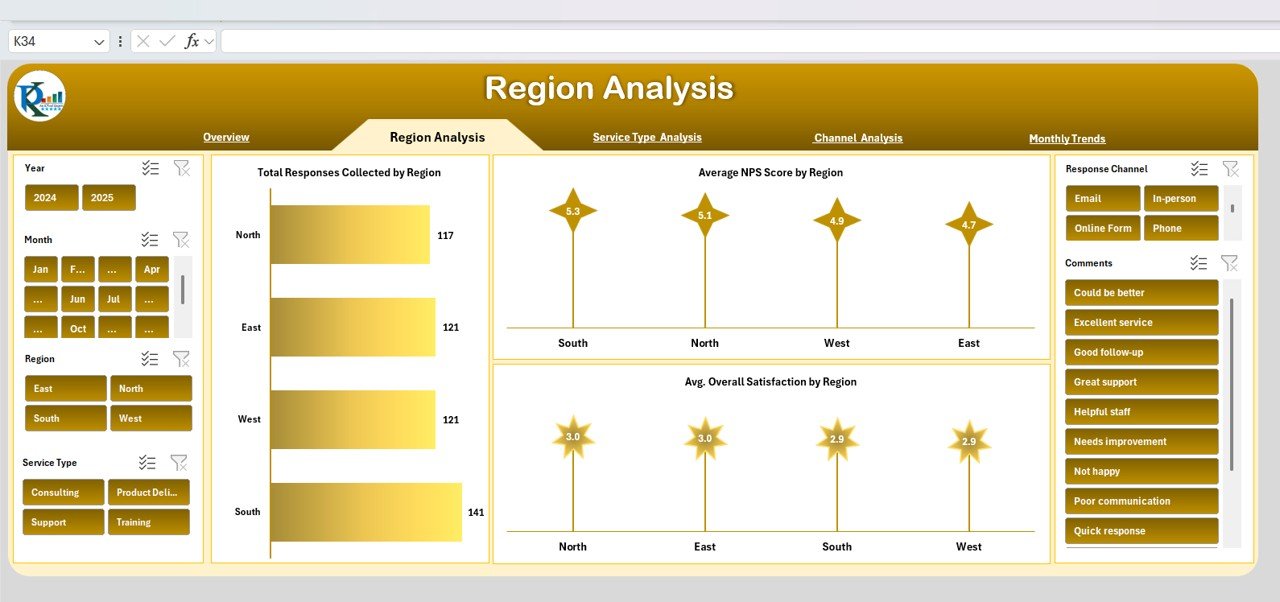
🌍 Region Analysis
-
Total responses and average satisfaction segmented by region
-
Compare loyalty (NPS) and overall satisfaction across locations
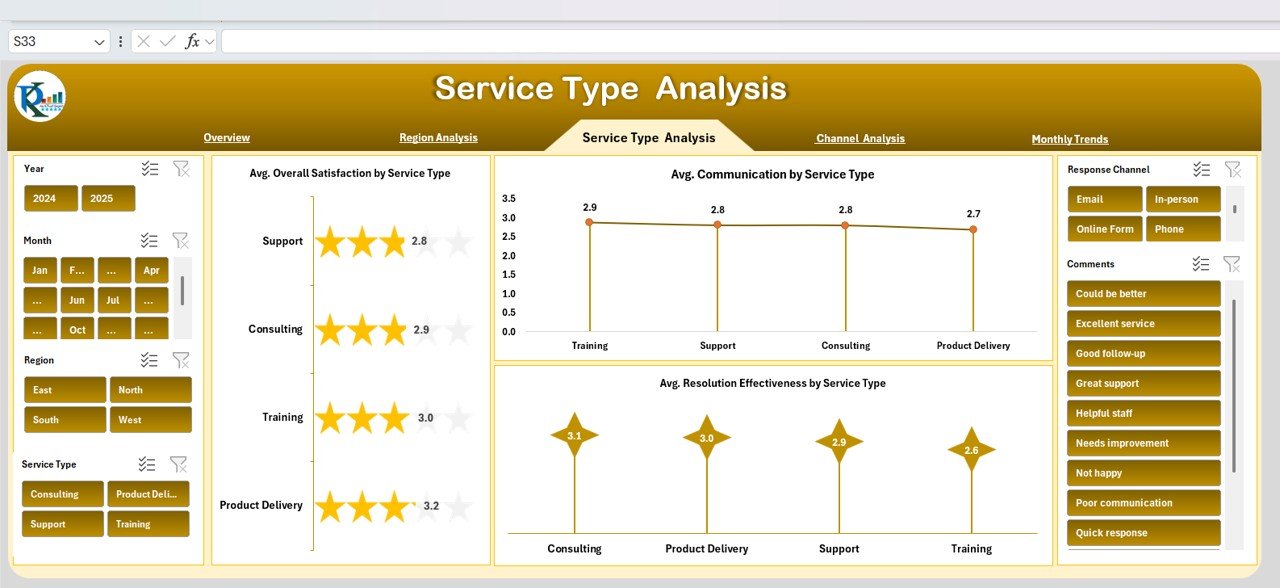
🛠 Service Type Analysis
-
Satisfaction and communication insights by type of service offered
-
Identify which services delight clients and which need improvement
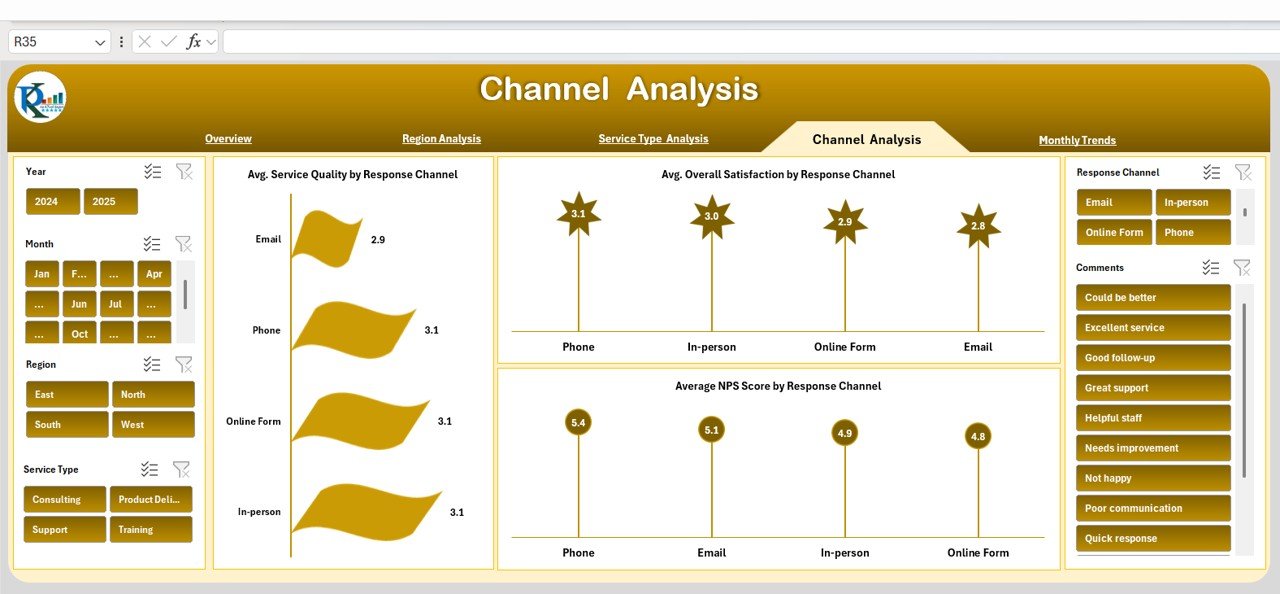
💬 Channel Analysis
-
Track performance across communication channels
-
Monitor NPS and service quality by survey response channel
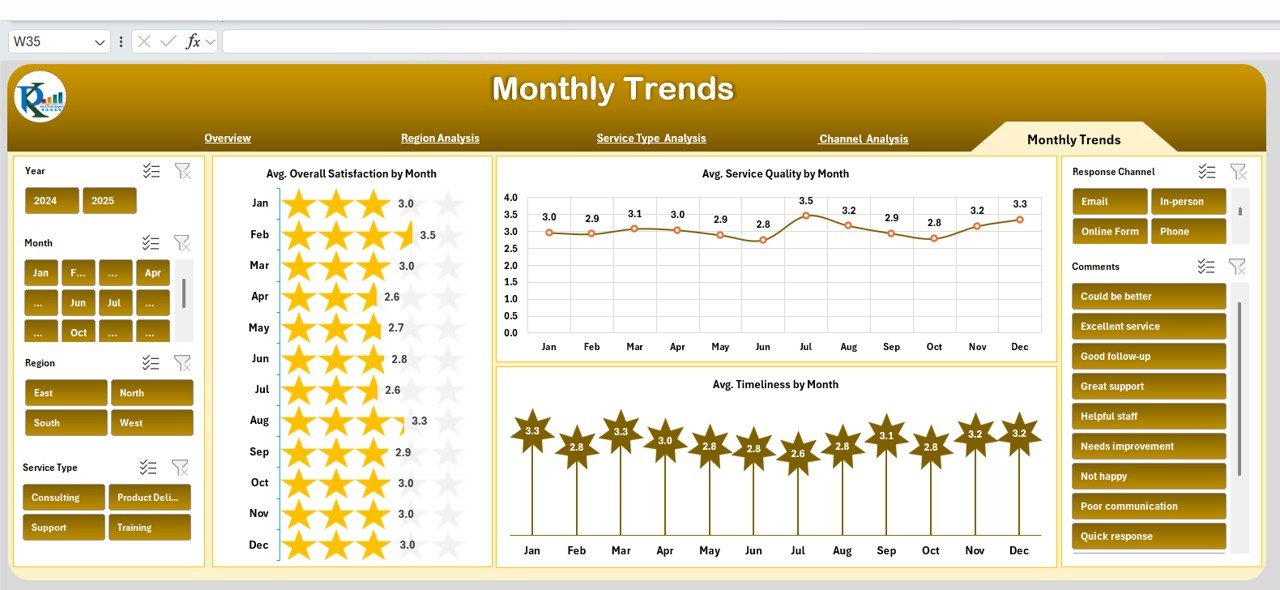
📅 Monthly Trends
-
Visualize satisfaction progress over time
-
Track Service Quality, Timeliness, and Overall Satisfaction by month
📊 Data Sheet (Input Hub)
-
Enter raw client survey responses (client name, region, service type, channel, NPS, and satisfaction scores)
-
Automatic updates across all dashboard sheets
📦 What’s Inside?
✅ Overview Dashboard – Quick KPIs & visuals
✅ Region Analysis Dashboard – Compare across geographies
✅ Service Type Dashboard – Track satisfaction by services
✅ Channel Analysis Dashboard – Evaluate client feedback channels
✅ Monthly Trends Dashboard – Monitor performance over time
✅ Data Entry Sheet – Easy-to-use structured input hub
👩💼 Who Can Benefit?
-
💼 Consultants & Service Providers – Track feedback from multiple clients
-
📊 Customer Success Teams – Improve service quality with real-time data
-
🏢 Corporate Organizations – Monitor satisfaction across regions and services
-
🎯 SMEs & Startups – Gain insights without expensive survey platforms
-
📈 Management Teams – Use insights for strategy and reporting
🧪 How to Use the Dashboard
-
Collect Feedback – Gather survey responses from clients
-
Input Data – Enter responses into the Data Sheet
-
Monitor KPIs – Review Overview Dashboard for instant insights
-
Segment Analysis – Dive into Region, Service, or Channel sheets
-
Track Progress – Use Monthly Trends to measure improvements
-
Take Action – Share findings with teams to improve client experience
🌟 Advantages
-
📊 Centralized Feedback – All survey data in one place
-
🚦 Real-Time Updates – Instant refresh when new data is added
-
🔍 Trend Analysis – Spot satisfaction patterns over time
-
🌍 Segmented Insights – Compare by client, service, region, or channel
-
📈 Actionable Data – Identify weaknesses and improve service delivery
-
🛠 Customizable – Add new KPIs or adapt to your business process
🚀 Why Choose This Dashboard?
Unlike generic survey tools, this Excel-based dashboard is:
✔ Easy to use – no technical expertise required
✔ Collaborative – share and update across teams
✔ Cost-effective – professional reporting without expensive software
✔ Flexible – customize metrics, services, and client segments
By using this dashboard, you can enhance client experience, boost loyalty, and align service improvements with real customer feedback.
Click to read detailed blog post
Watch the step-by-step video Demo:


Reviews
There are no reviews yet.