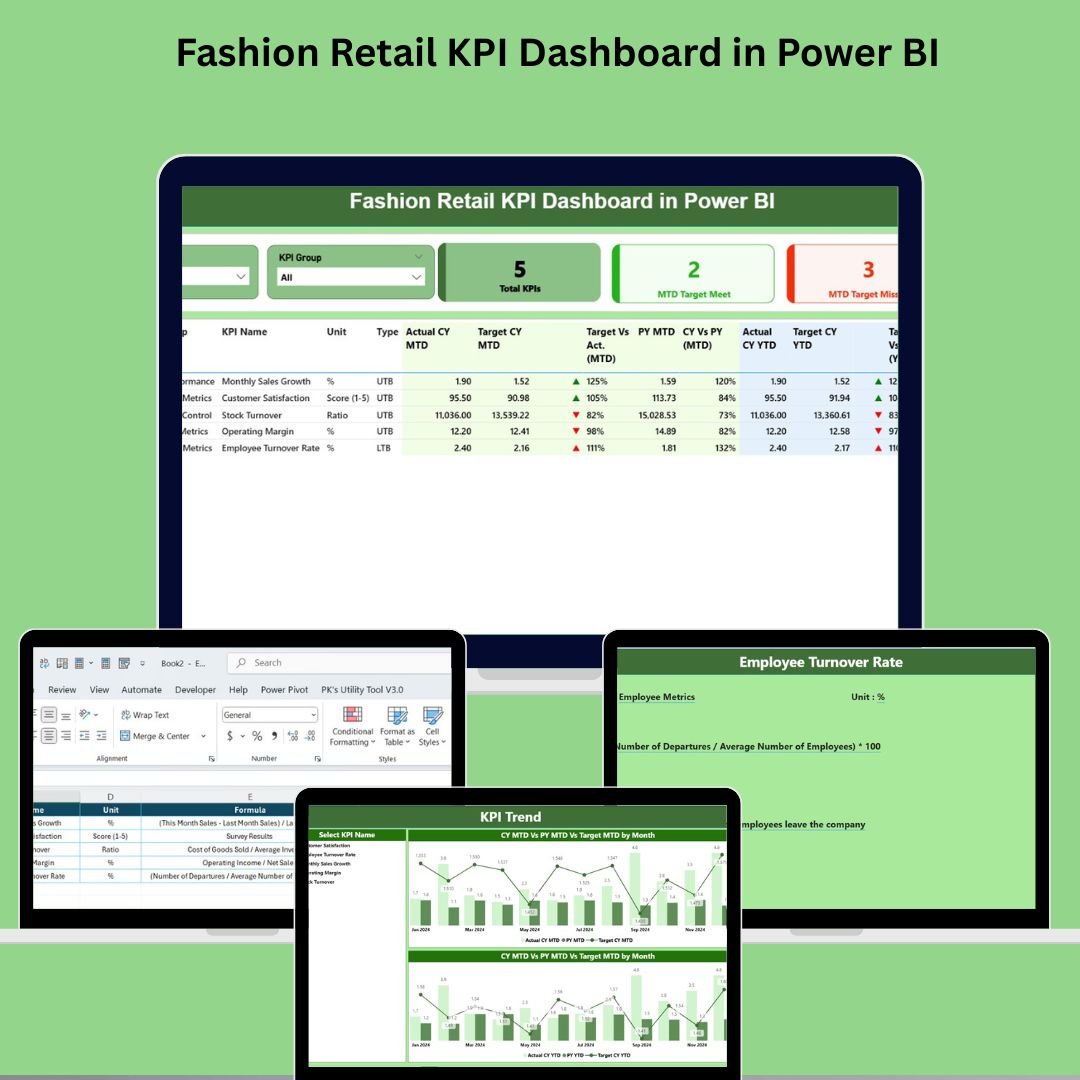
In the ever-evolving world of fashion retail, staying on top of performance metrics is the key to staying competitive. The Fashion Retail KPI Dashboard in Power BI is a powerful business intelligence solution designed to give retail professionals the insights they need—at a glance and in real time.
From tracking Sales Revenue and Gross Margin % to monitoring Inventory Turnover, Customer Return Rate, and more, this ready-to-use dashboard centralizes and visualizes all your critical KPIs, offering a dynamic view into both short-term trends and long-term business performance.
With seamless Excel integration and an intuitive Power BI interface, this dashboard empowers store managers, regional leaders, and analysts to make informed decisions that directly impact profitability and customer satisfaction.
🧰 Key Features of the Fashion Retail KPI Dashboard
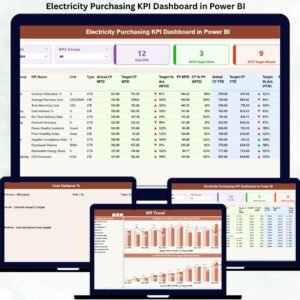
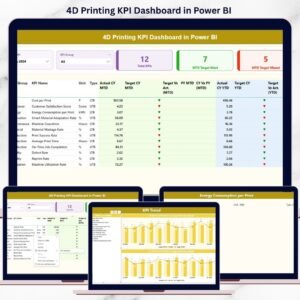
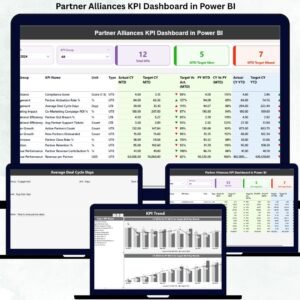
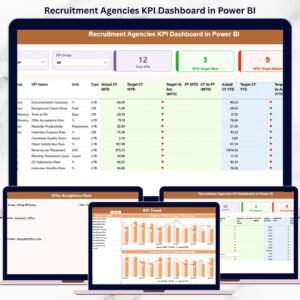
This template includes three interactive pages in Power BI Desktop, each with unique functionality:
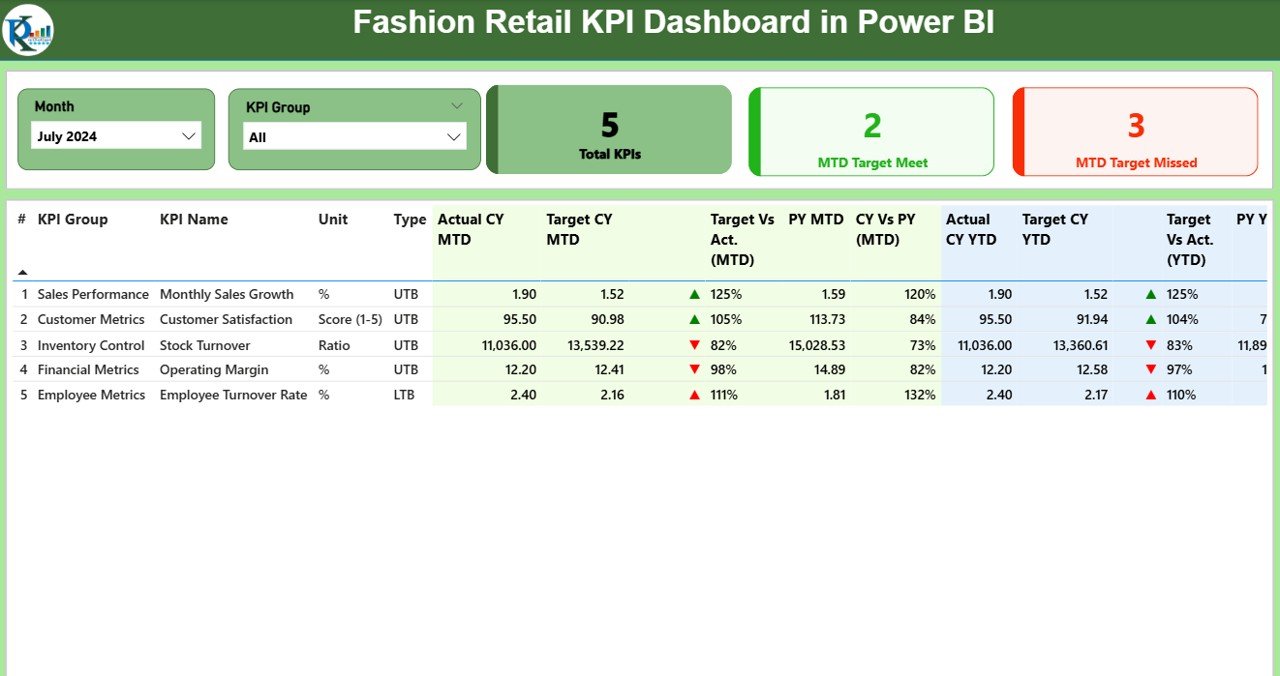
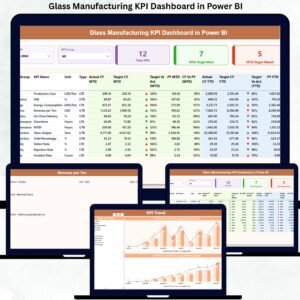
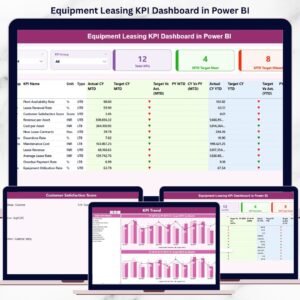
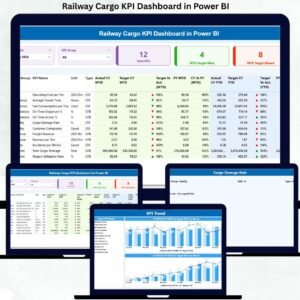
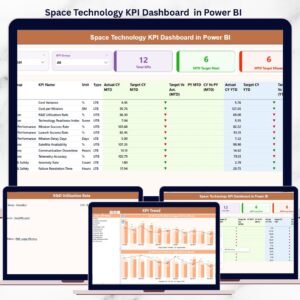
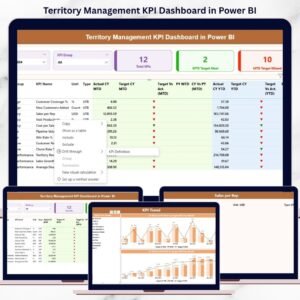
📊 1. Summary Page – Interactive KPI Overview
-
🎛 Month and KPI Group slicers for dynamic filtering
-
📌 KPI Cards for:
-
Total KPI Count
-
MTD Target Met Count
-
MTD Target Missed Count
-
-
📋 Detailed KPI Table with insights such as:
-
KPI Group, Name, and Type (LTB/UTB)
-
Actual vs Target (MTD & YTD)
-
Previous Year comparisons
-
Up/down trend icons (green ▲ or red ▼)
-
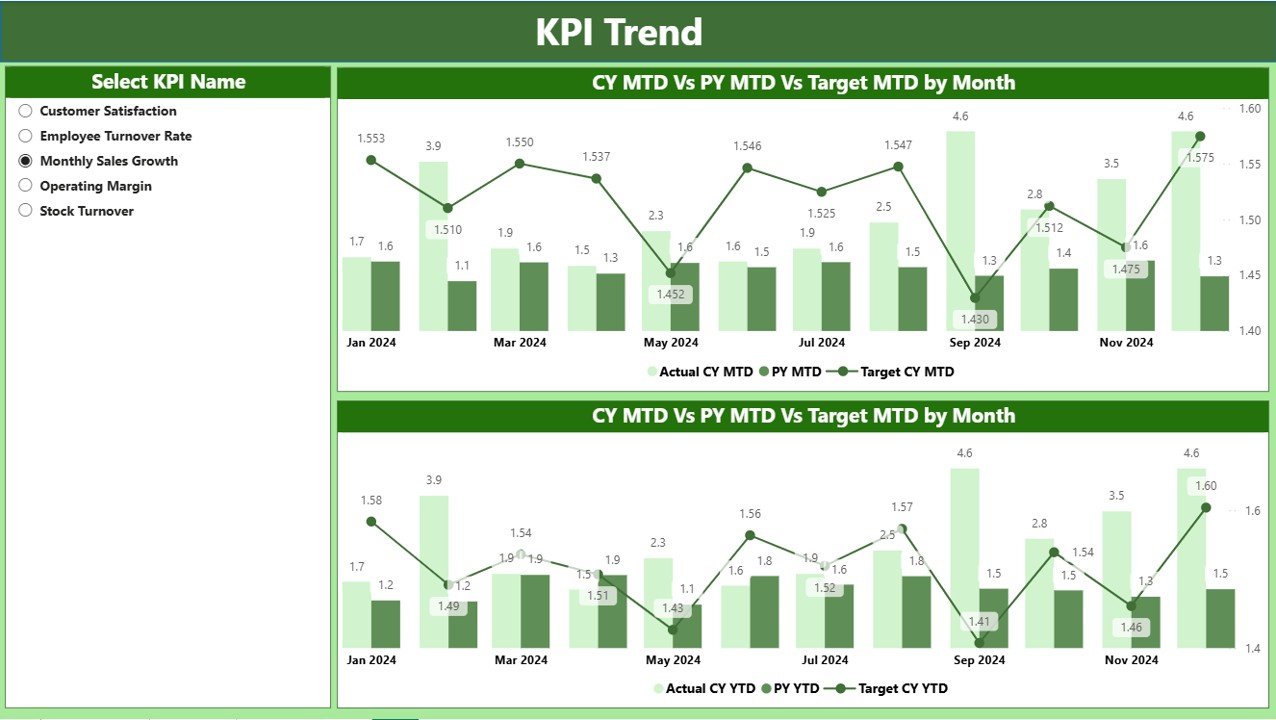
📈 2. KPI Trend Page – Visualize MTD & YTD Trends
-
📅 Tracks KPI performance over time
-
🔄 Combo charts for CY, PY, and Target values
-
🎯 Separate MTD and YTD trend lines
-
🔍 KPI slicer for focused analysis
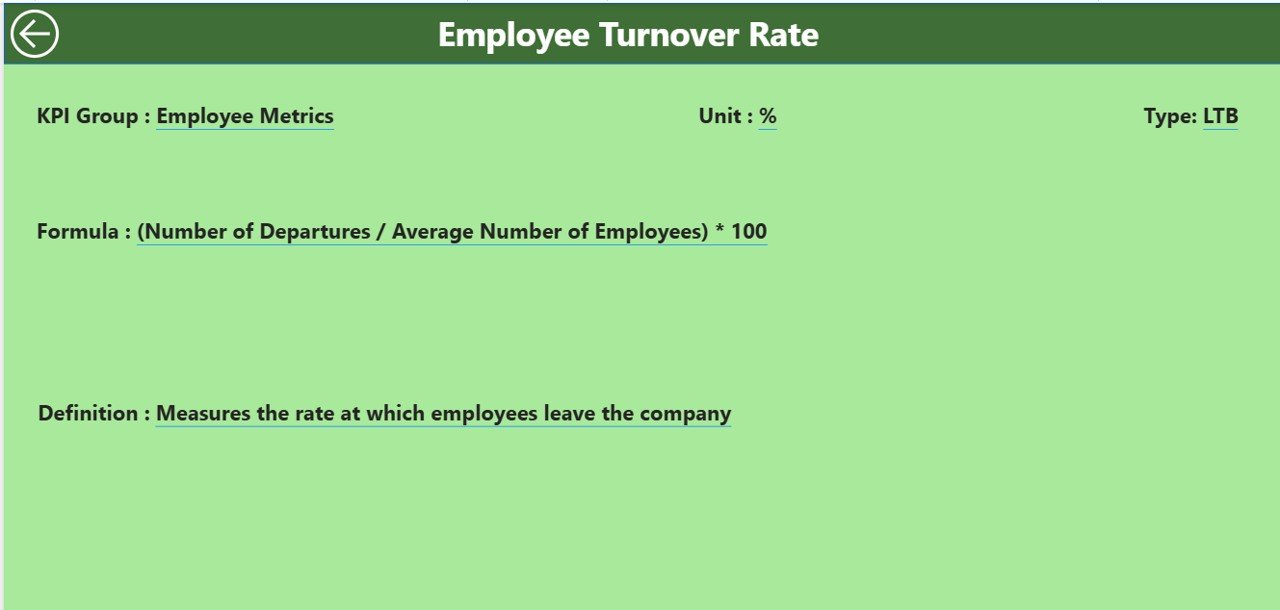
📘 3. KPI Definition Page – Drill-through Insights
-
📌 Hidden drill-through page with KPI Formula and Definition
-
🔁 Right-click from any KPI in Summary to view more details
-
⬅️ Click Back to return to Summary
📂 Excel-Based Data Source
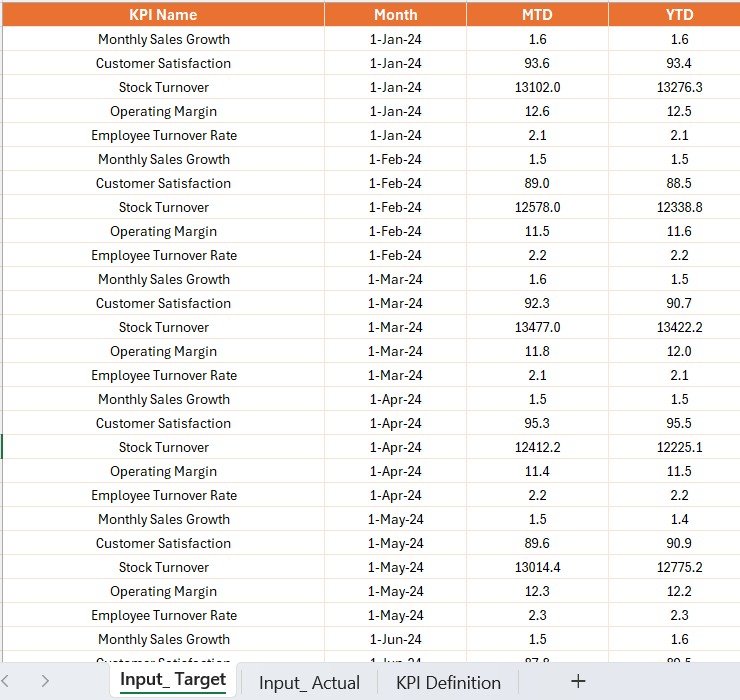
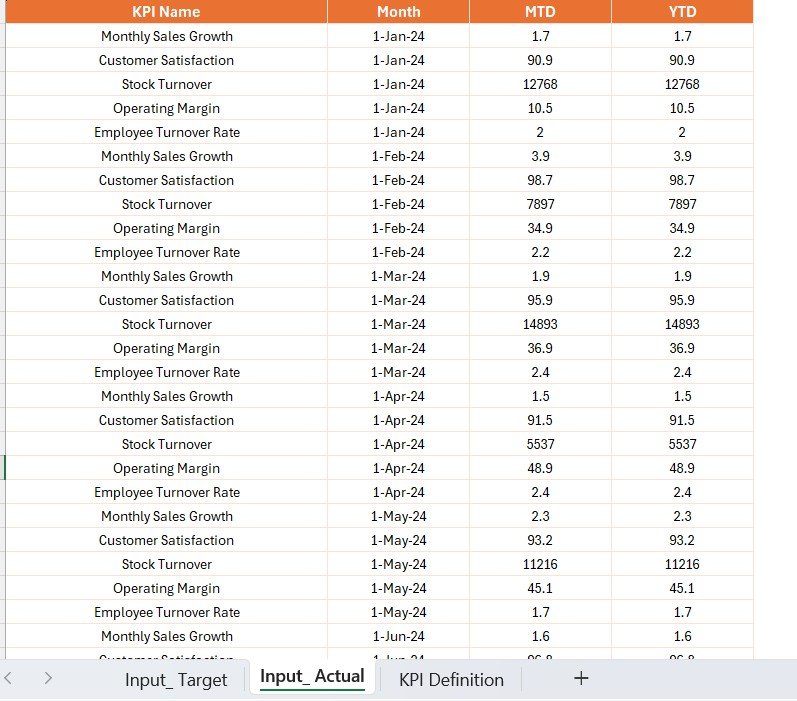
The dashboard connects to an Excel file with 3 sheets:
-
Input_Actual – Actual MTD and YTD values
-
Input_Target – Target MTD and YTD values
-
KPI Definition – Group, Name, Unit, Formula, Type
✅ This makes the dashboard easy to update, manage, and customize.
📊 Common KPIs Tracked
-
Sales Revenue
-
Gross Margin %
-
Inventory Turnover
-
Customer Return Rate
-
Average Transaction Value (ATV)
-
Conversion Rate
-
Sell-Through %
-
Online vs In-Store Sales Split
🚀 Advantages of the Fashion Retail KPI Dashboard
-
✅ Centralized Insights – View all key KPIs in one place
-
🧠 Intelligent Visuals – Easily interpret trends and gaps
-
📅 MTD & YTD Focus – Track current vs long-term progress
-
🔁 Historical Comparisons – Analyze performance over time
-
📉 Instant Visibility – Know which KPIs are underperforming
-
🔗 Excel-Driven – Simple data entry and customization
📈 Opportunities for Improvement
-
🔄 Automate refresh for real-time syncing
-
🔮 Add forecasting or benchmarking options
-
🧑🤝🧑 Expand to include staffing or supplier KPIs
-
📱 Optimize visuals for mobile viewing
📌 Best Practices
✔ Update Excel data monthly
✔ Train users for KPI literacy
✔ Use slicers and trend icons effectively
✔ Keep KPI names, units, and ranges consistent
✔ Prioritize high-impact KPIs
🎓 How to Get Started
1️⃣ Download the Power BI file and Excel template
2️⃣ Input your Actual, Target, and KPI Definition data
3️⃣ Open Power BI and refresh the data model
4️⃣ Explore insights using slicers, cards, and tables
5️⃣ Use the drill-through feature for deep analysis
🛍️ Real-World Use Cases
-
🏪 Retail Store Chains – Compare across store locations
-
🧥 Seasonal Sales – Track holiday/festival promotions
-
📦 Inventory Optimization – Monitor sell-through and turnover
-
🌐 Online vs Offline – Measure digital vs in-store performance
🎥 Bonus
Watch full video walkthroughs on our YouTube channel:
👉 youtube.com/@PKAnExcelExpert
🔗 Click here to read the Detailed blog post









Reviews
There are no reviews yet.