

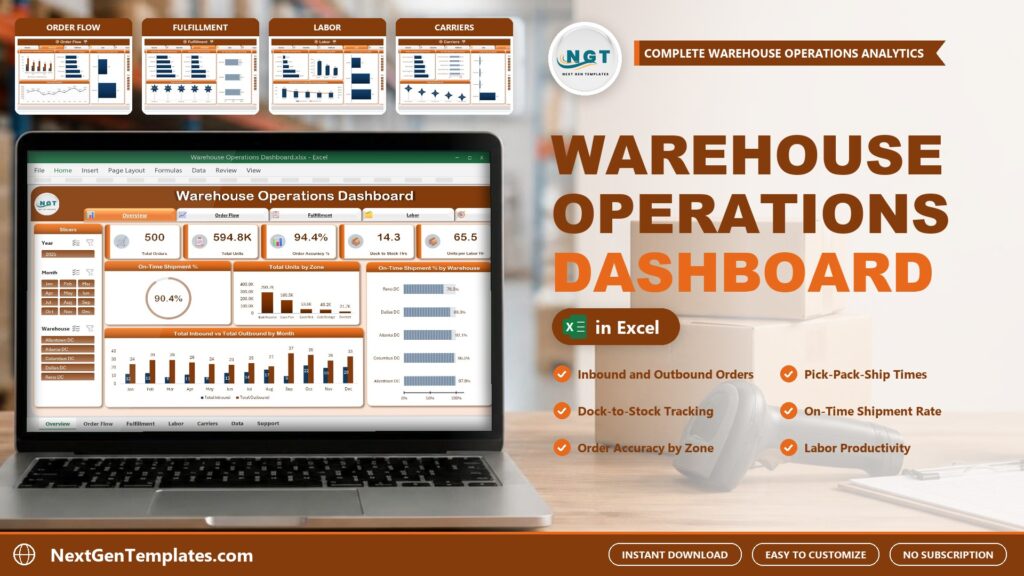
Late shipments and slow receiving rarely show up in a plain order list. The Warehouse Operations Dashboard in Excel puts every inbound and outbound order into five clickable pages, so you can see which warehouse, zone or carrier needs attention.
Watch the Warehouse Operations Dashboard in Excel: Orders, Shipping and Labor walkthrough
 Launch offer
From your first Pivot Table to the Data Model, DAX, Power Query and a one-page KPI dashboard. 11h 51m of video by PK, with practice files, quizzes and a capstone.
What Is a Warehouse Operations Dashboard?
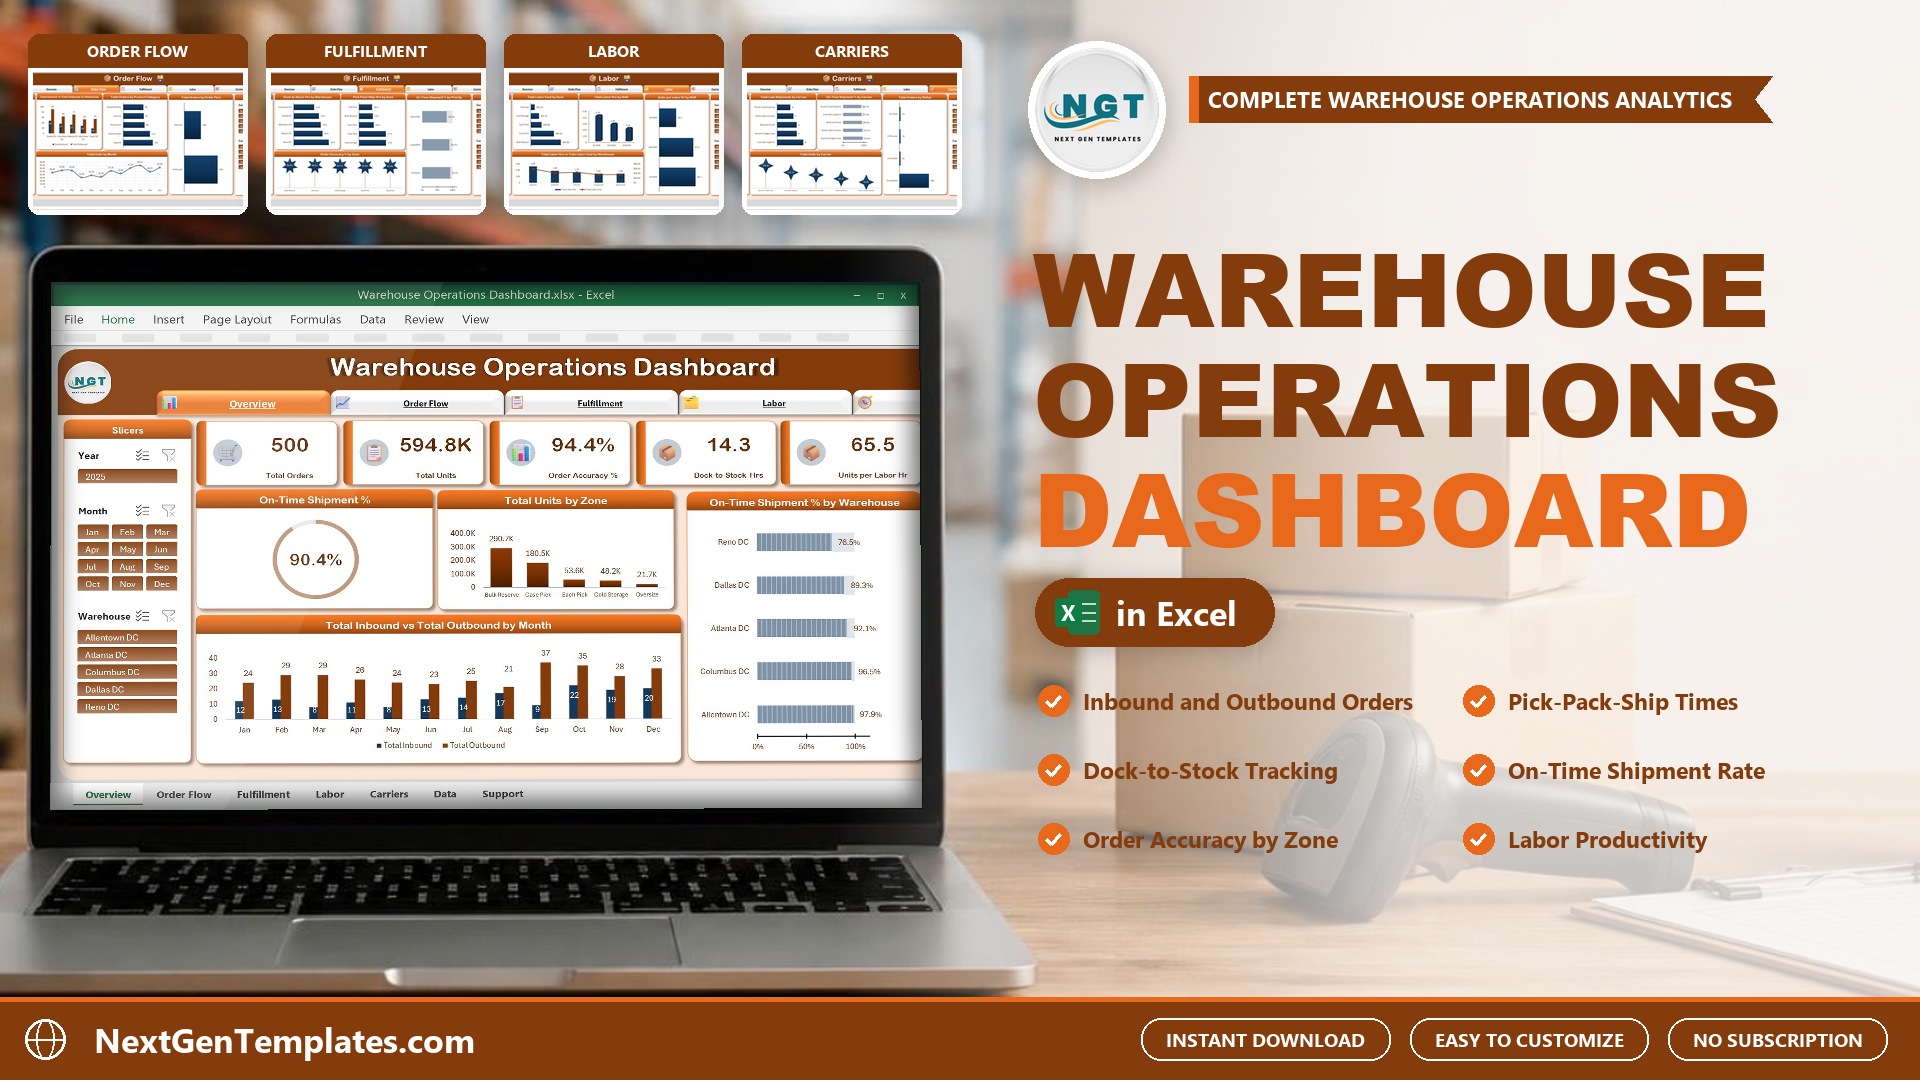
A warehouse operations dashboard shows how orders move through your building: how many came in, how many went out, how fast they were picked, packed and shipped, how accurate they were and how productive your labor was. This one is an Excel workbook with five pages. You keep your orders on a Data tab, click Refresh All, and the pivot tables behind the charts update the Overview, Order Flow, Fulfillment, Labor and Carriers pages. It works as a warehouse kpi dashboard excel file you can reuse every month.
Inside the Dashboard
Overview Page
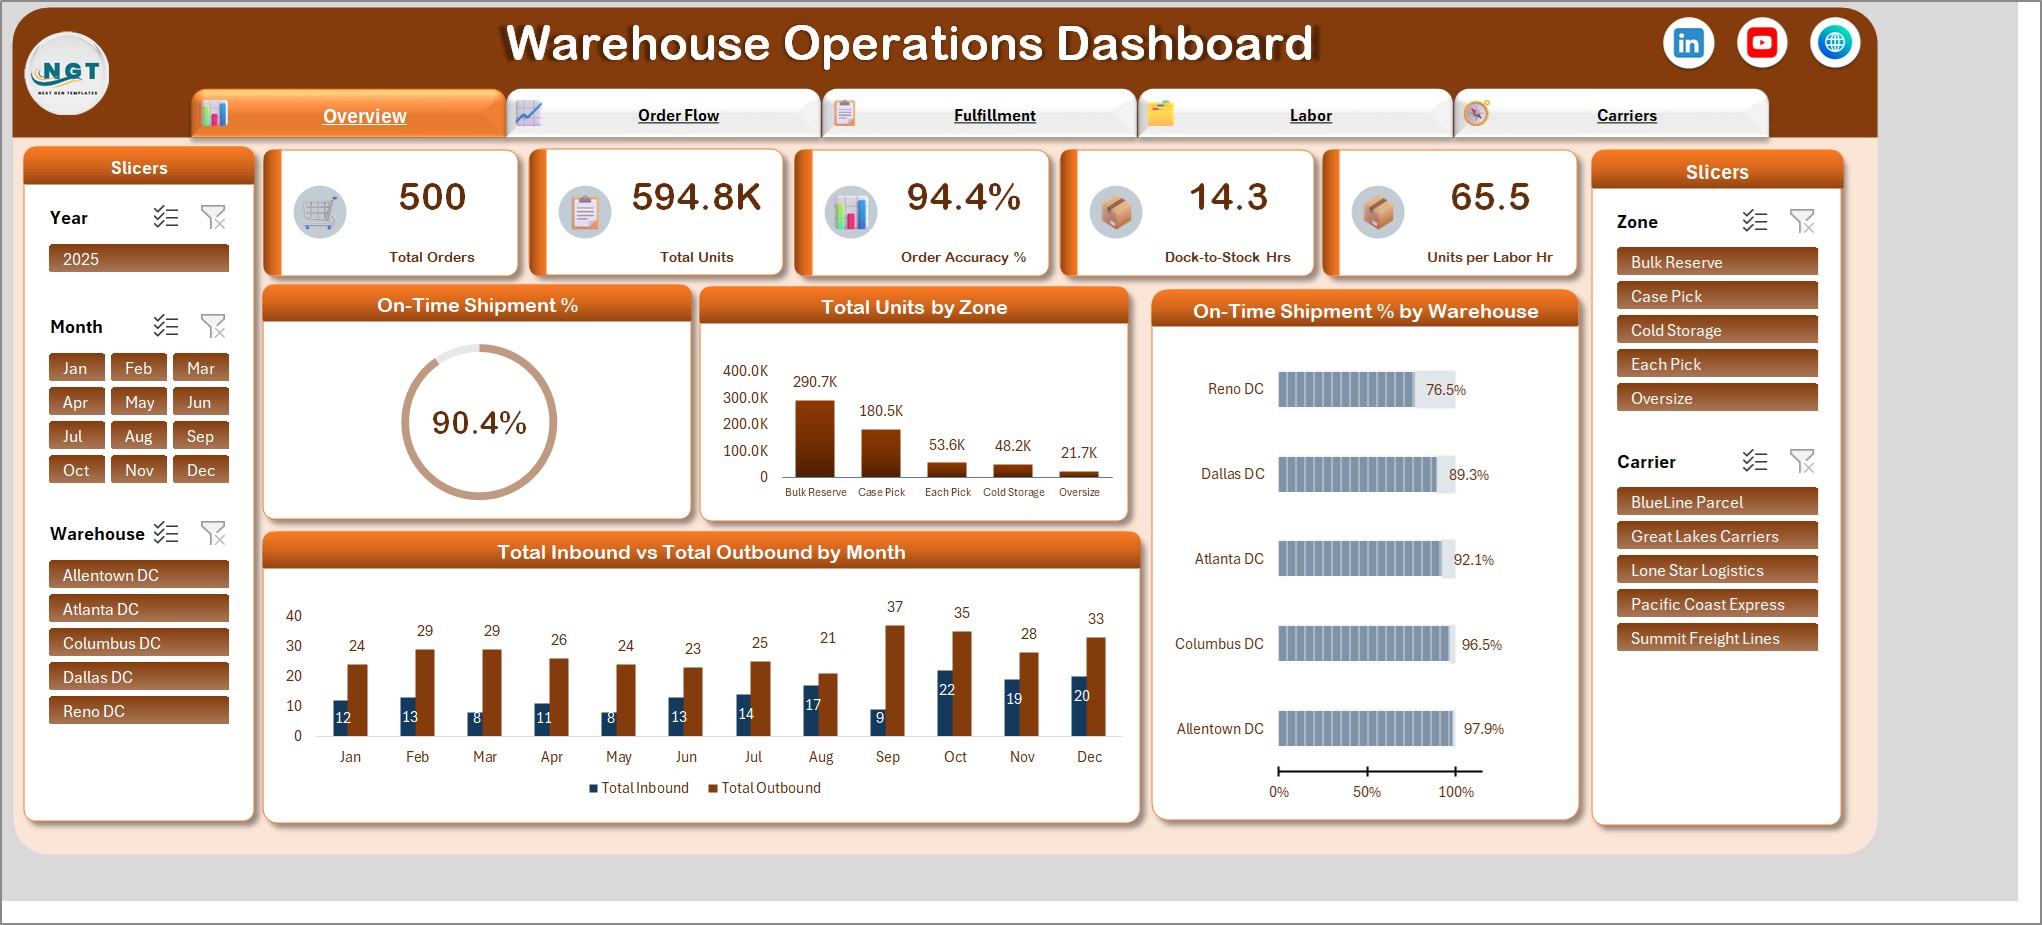
Five KPI cards sit across the top: Total Orders, Total Units, Order Accuracy %, Dock-to-Stock Hrs and Units per Labor Hr. Below them, a circle shows On-Time Shipment %, and charts show total units by zone, on-time shipment % by warehouse and total inbound vs total outbound by month.
Order Flow Page
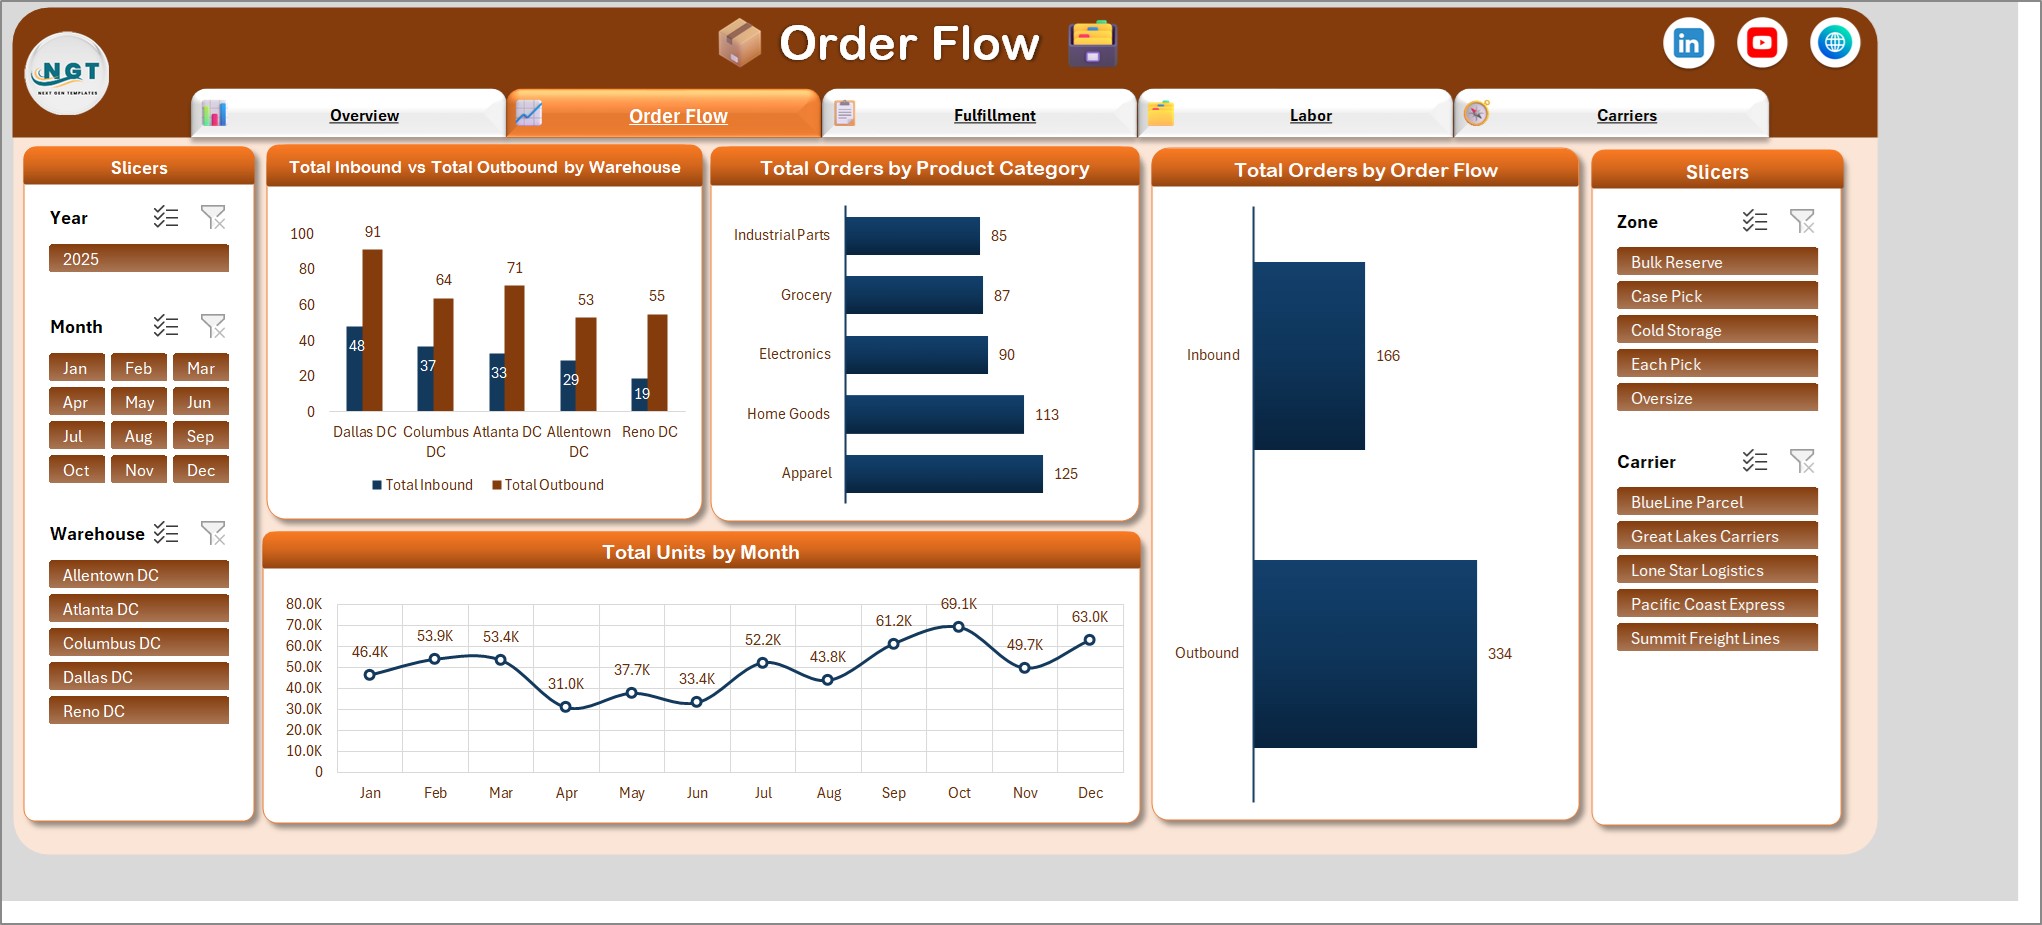
Total inbound vs total outbound by warehouse, total orders by product category, total orders by order flow (the inbound and outbound split) and total units by month.
Fulfillment Page
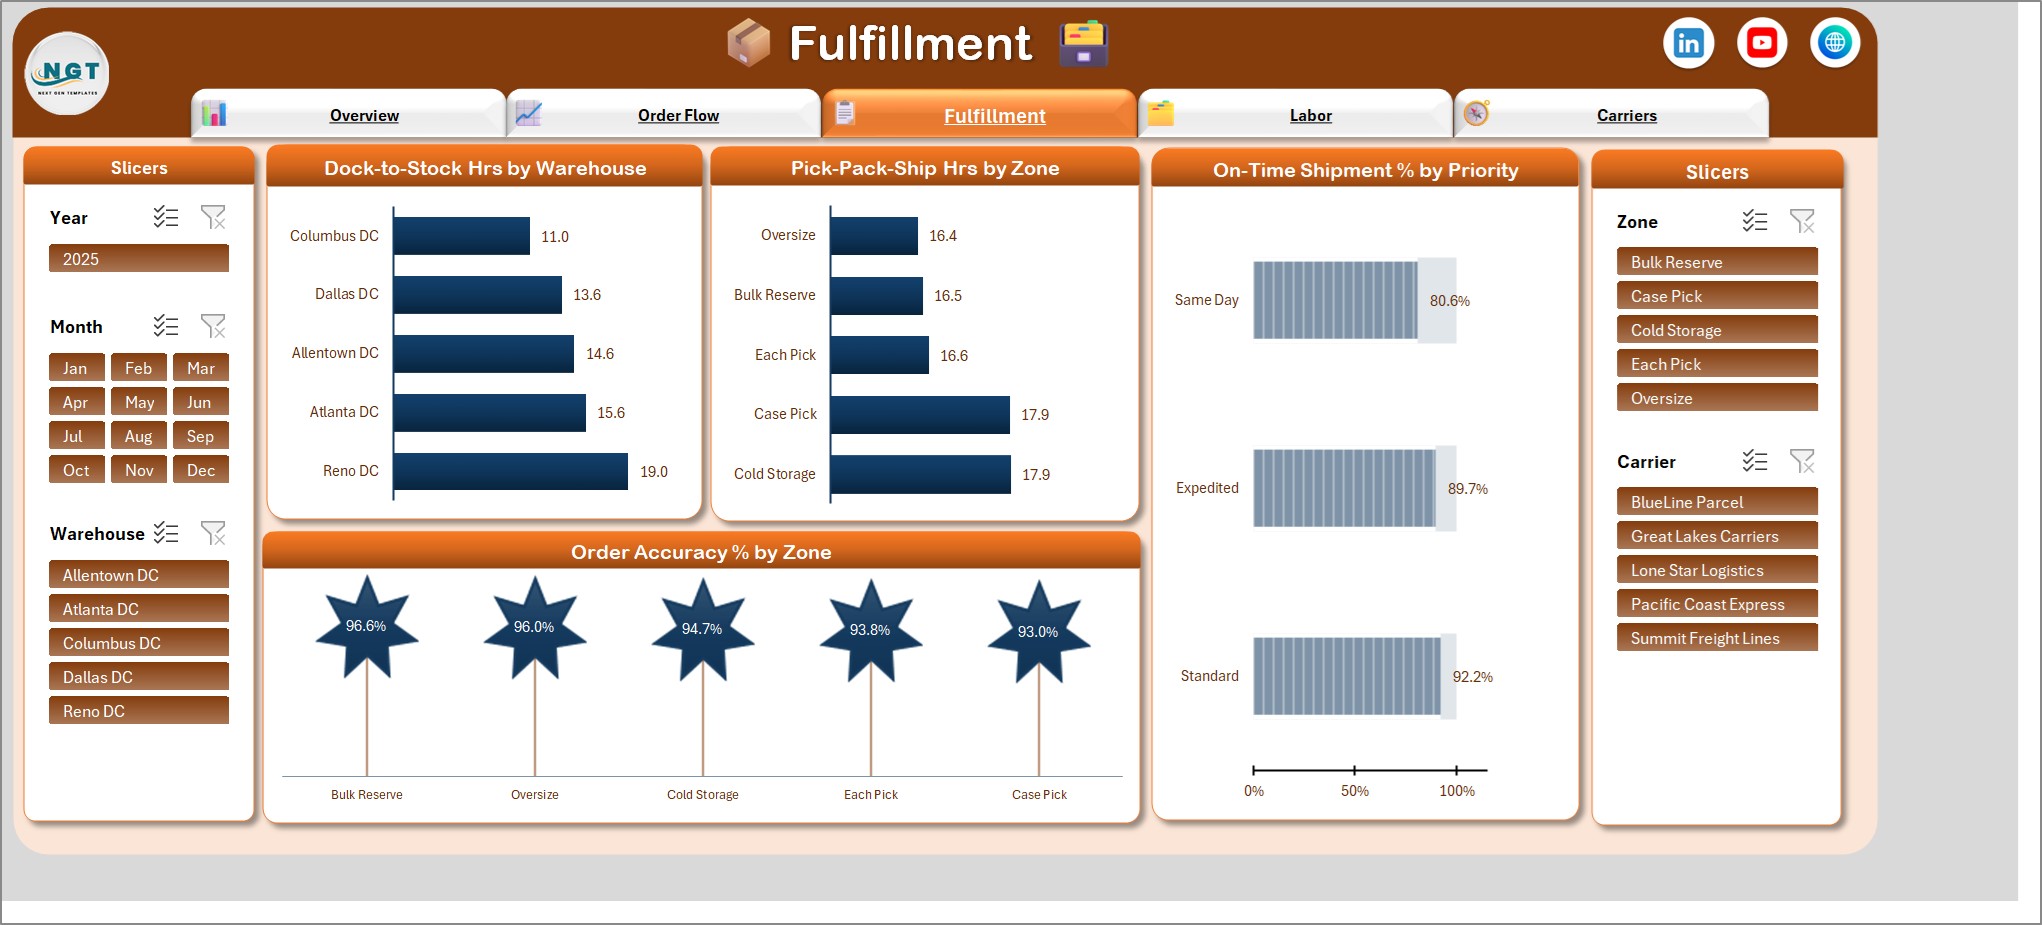
Dock-to-stock hours by warehouse, pick-pack-ship hours by zone, on-time shipment % by priority and order accuracy % by zone.
Labor Page
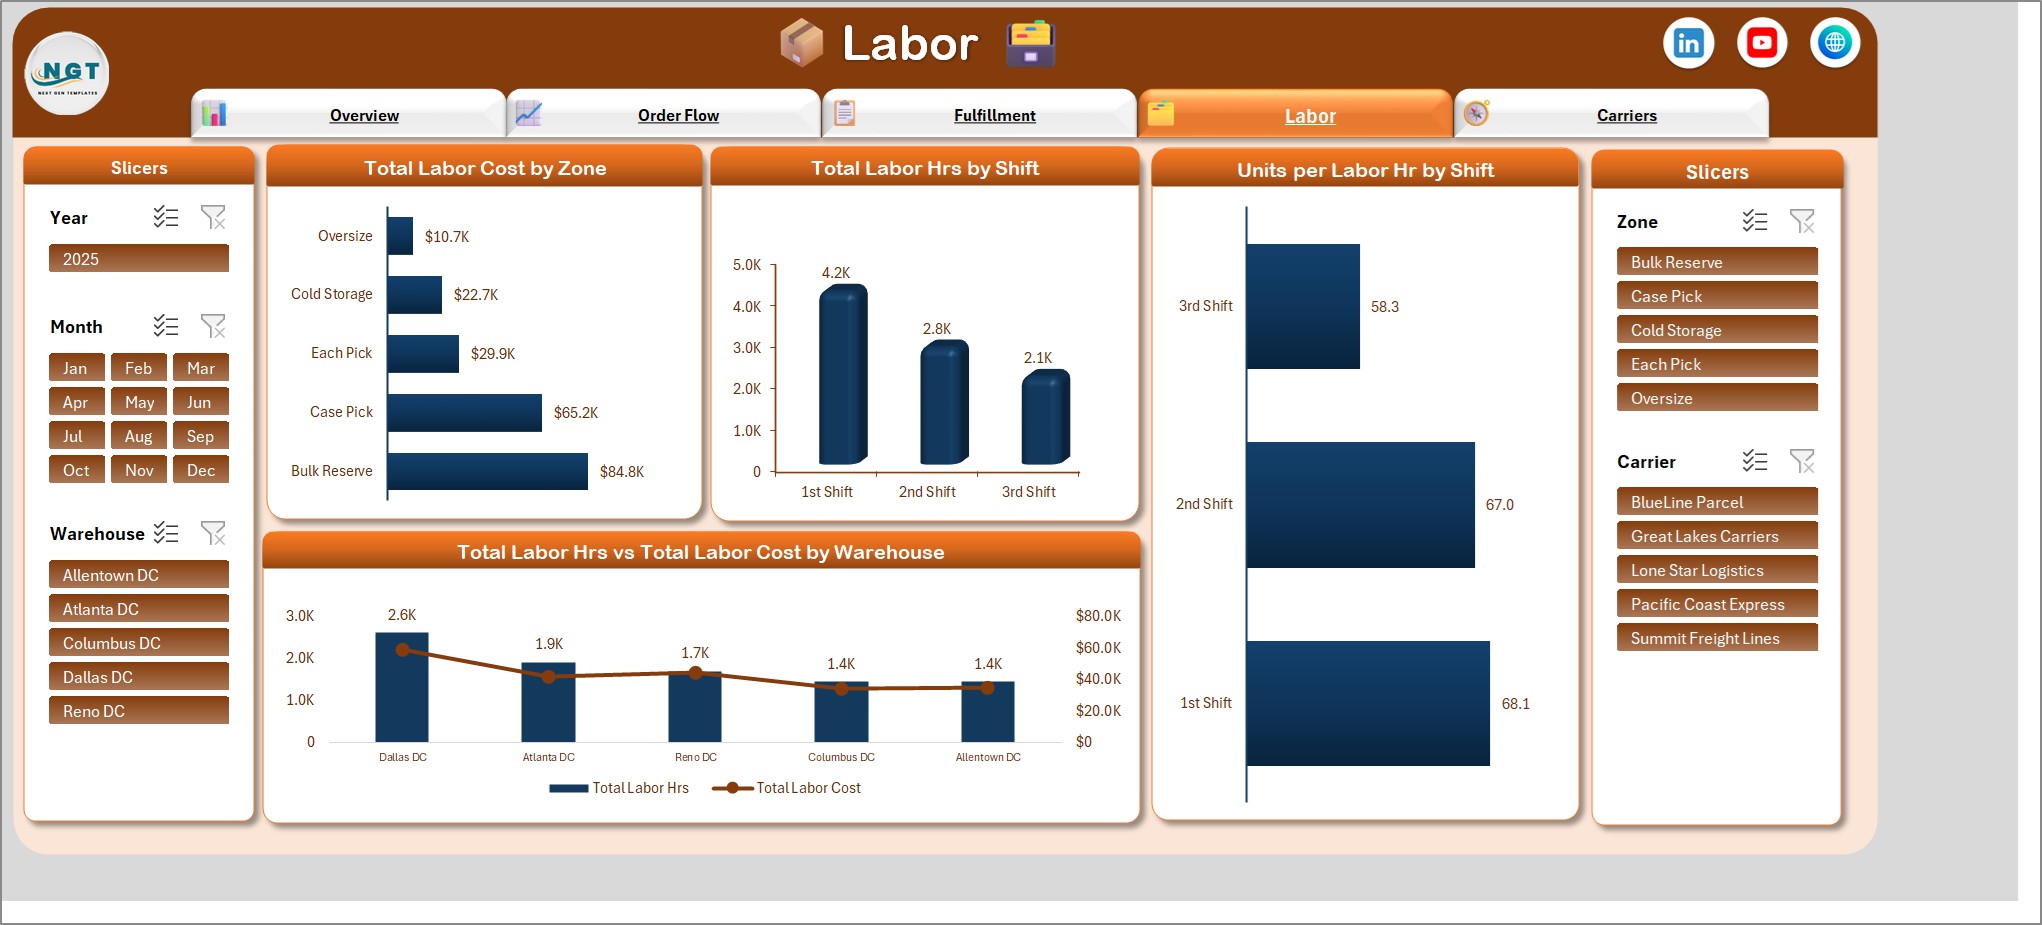
Total labor cost by zone, total labor hours by shift, units per labor hour by shift and total labor hours vs total labor cost by warehouse.
Carriers Page
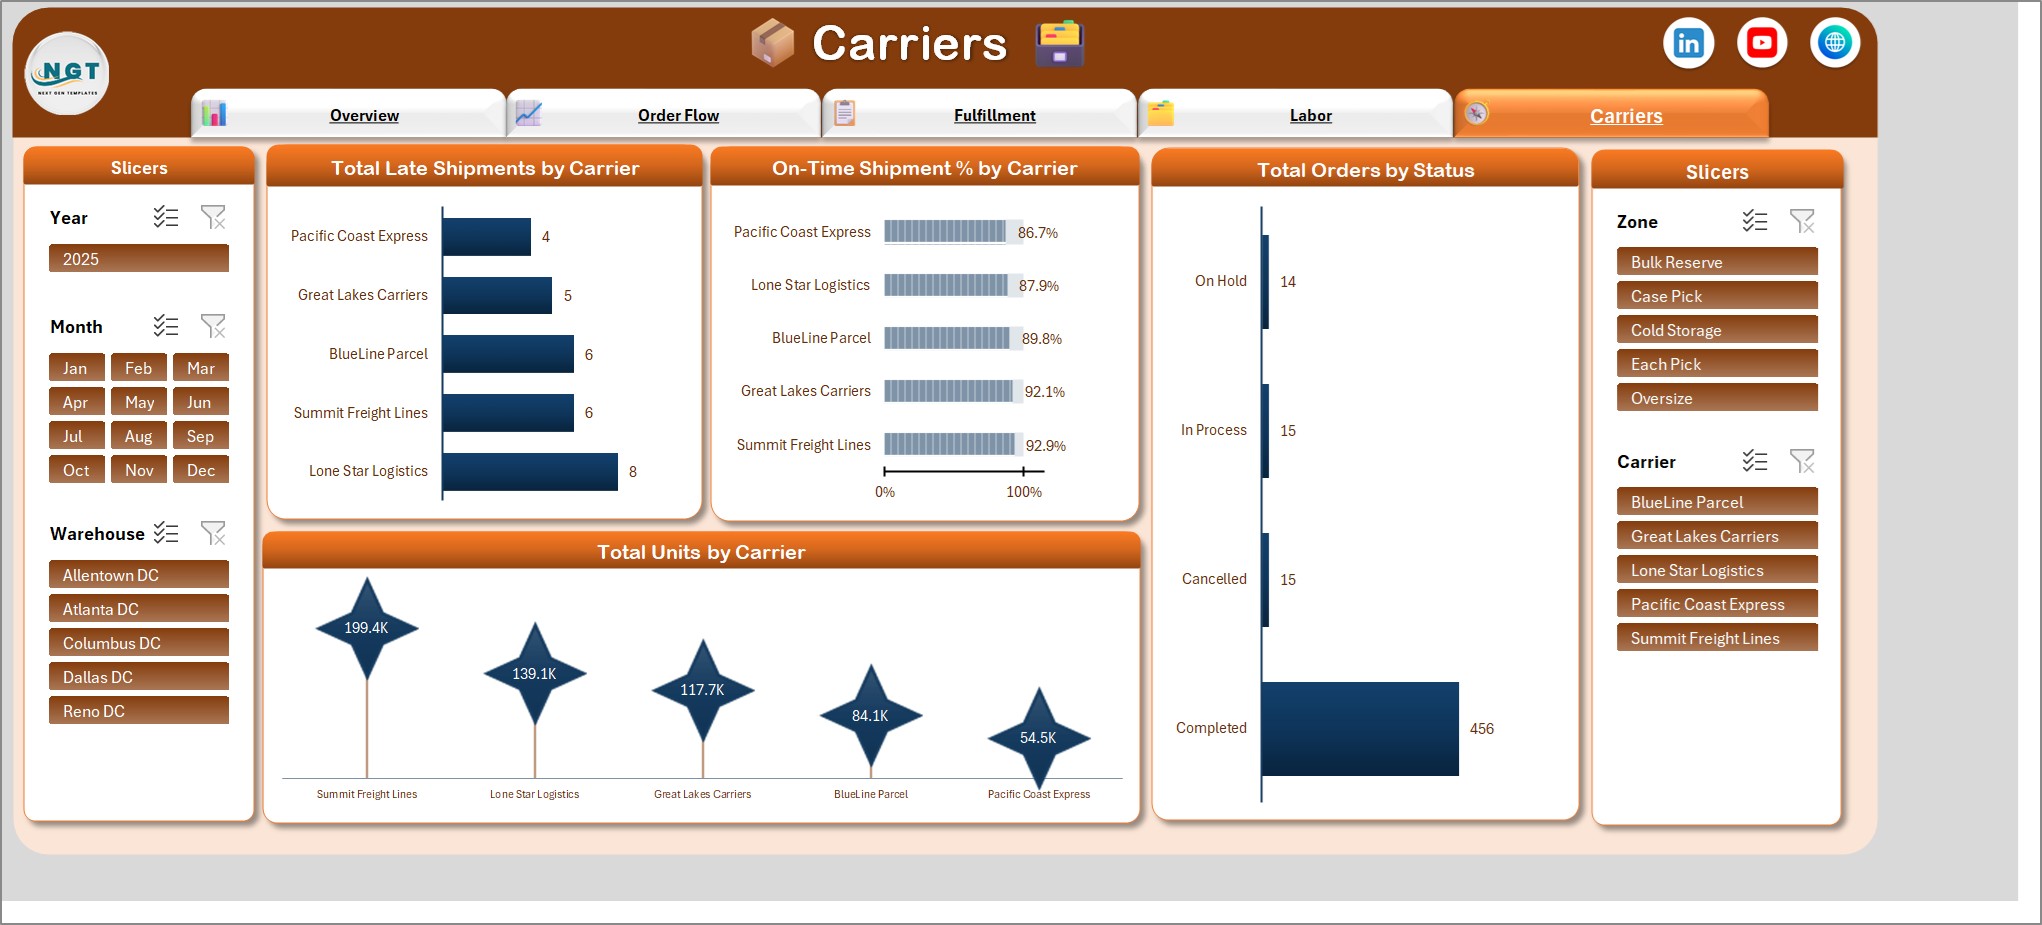
Total late shipments by carrier, on-time shipment % by carrier, total orders by status and total units by carrier.
How It Works
The Data tab holds one row per inbound or outbound order, with 500 fictional sample orders for one full year. Formula columns work out the month, year, inbound and outbound counts, shipped orders, on-time count, late shipments and accuracy. A Support tab holds the pivot tables that feed the charts. Five slicers (Year, Month, Warehouse, Zone and Carrier) filter all five pages at once, so you can look at one warehouse or one carrier in a click. Together the pages work as a logistics dashboard excel teams can read at a glance.
Pros and Limits
- One screen for orders, units, order accuracy, dock-to-stock hours and units per labor hour
- No macros, no add-ins, no subscription
- Works for any order list you can paste into the Data tab
- It is not a live connector to WMS or ERP software, so you refresh it yourself
- Built for desktop Excel on Windows, Excel 2016 or later, or Microsoft 365
Frequently Asked Questions
Does it connect to my warehouse management system?
No. It is an add-data-and-refresh workbook. Type or paste your orders on the Data tab, click Refresh All, and every card, chart and slicer updates. There is no live link to a WMS, ERP or any other system.
Is this a warehouse KPI dashboard in Excel?
Yes. It tracks on-time shipment %, order accuracy %, dock-to-stock hours, pick-pack-ship hours and units per labor hour, and breaks them down by warehouse, zone, shift, priority and carrier.
Does it need macros or add-ins?
No. It uses formulas, pivot tables, charts and slicers only, so there is nothing to enable beyond opening the file.
Which Excel version do I need?
Desktop Excel for Windows, Excel 2016 or later, or Microsoft 365. The slicers and pivot tables do not work fully in Excel for the web.
How do I add new orders?
Add a row on the Data tab for each inbound or outbound order and enter 1 in the Total Records column. The formula columns work out the month, year, shipped orders, on-time count, late shipments and accuracy. Then click Refresh All.
Which slicers are included?
Five slicers: Year, Month, Warehouse, Zone and Carrier. They filter all five pages at once.
Get the Warehouse Operations Dashboard
Get the dashboard here: Warehouse Operations Dashboard in Excel. For a wider KPI view, try the Warehouse Management KPI Dashboard in Excel.