

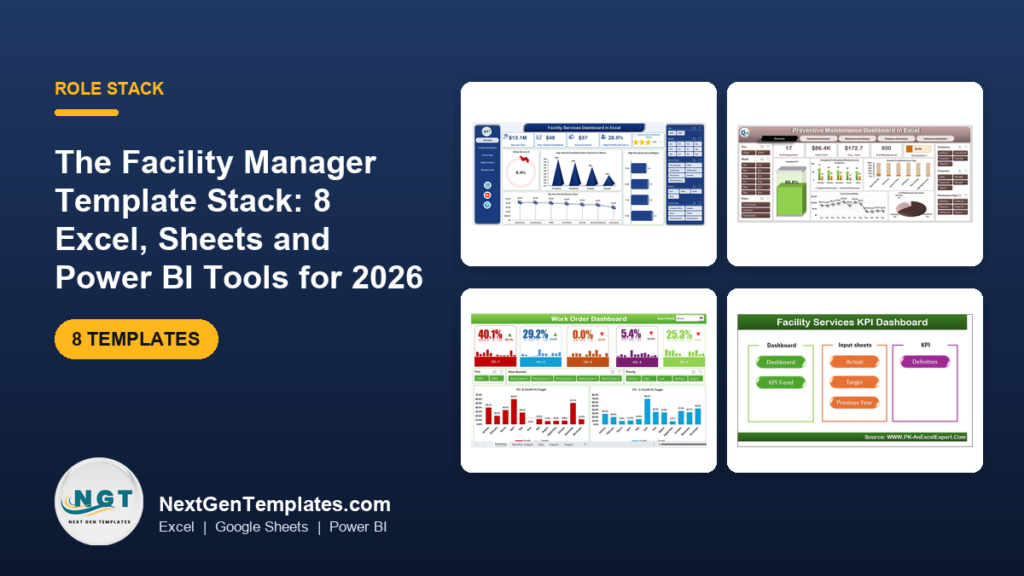
The best facility manager Excel templates cover four jobs: plan, track, report and present. Start with the Facility Services Dashboard in Excel ($13.99), add the Maintenance Work Order Data Entry System ($5.99) for logging jobs, and grow to eight tools for $121.92 in total, with no subscription.
Last updated: November 2026
Key takeaways
- The Facility Services Dashboard in Excel ($13.99) is the best first buy because it puts delay %, completion hours, service cost and priority services on one screen.
- The Maintenance Work Order Data Entry System ($5.99) is the best-value tool: a 7-field VBA form and 3 live KPI cards, set up in under 10 minutes.
- All eight tools together cost $121.92 one-time across Excel, Google Sheets and Power BI formats.
- The Equipment Maintenance Management System Web App ($24.99) is the only multi-user option, with 21 screens, 12 dashboard KPIs and automatic preventive maintenance work orders.
- A 30-day rollout works: contract calendar and work order log in week 1, dashboards in weeks 2 and 3, the Power BI view for leadership in week 4.
 Launch offer
From your first Pivot Table to the Data Model, DAX, Power Query and a one-page KPI dashboard. 11h 51m of video by PK, with practice files, quizzes and a capstone.
Facility manager Excel templates compared
| Template | Format | Best For | Price |
|---|---|---|---|
| Facility Services Dashboard in Excel (Best overall) | Excel | SLA, delay and service cost reporting | $13.99 |
| Equipment Maintenance Management System Web App | Google Sheets web app | Multi-user maintenance teams | $24.99 |
| Preventive Maintenance Dashboard in Excel | Excel | Scheduled vs completed maintenance | $17.99 |
| Maintenance Work Order Data Entry System in Excel (Best value) | Excel with VBA | Logging jobs without a CMMS | $5.99 |
| Work Order Dashboard in Excel | Excel | Work order cost by cost center | $17.99 |
| Facility Services Dashboard in Power BI | Power BI | Leadership presentations | $17.99 |
| Office Energy Consumption Dashboard in Excel | Excel | Energy cost across offices | $17.99 |
| Vendor Contract Renewal Calendar in Excel | Excel | Contract renewal dates | $4.99 |
How we picked these
We searched the Next Gen Templates catalog for facility, maintenance, work order, energy and vendor tools, then kept only paid products with a clear facility manager use. Each one had to fit a single job in the plan, track, report, present cycle so the eight tools do not overlap. We left out generic project trackers, free downloads and anything only loosely tied to facilities. Prices and feature counts come from the product pages.
What does a facility manager actually need in a template stack?
A facility manager answers four recurring questions. What is coming up? What is happening now? How did we do? How do we explain it to the people who approve the budget? Each template below maps to one of those questions, so you can start with the one that hurts most.
- Plan: Vendor Contract Renewal Calendar, Equipment Maintenance Management System.
- Track: Maintenance Work Order Data Entry System, Work Order Dashboard.
- Report: Facility Services Dashboard in Excel, Preventive Maintenance Dashboard, Office Energy Consumption Dashboard.
- Present: Facility Services Dashboard in Power BI.
A stack works better than one big tool because facility work is uneven. Some weeks are all breakdowns, some weeks are contract renewals and some are budget reviews. Separate files let you adopt one at a time and stop using one without breaking the rest.
For a wider view of the category, our facility management templates roundup covers the property side as well.
What does each template replace?
Most facility teams do not start from zero. They already have something: a shared inbox, a paper log, a spreadsheet nobody trusts, or a paid CMMS that only two people open. This table shows what each template usually takes over.
| Template | Job | What it replaces | Price |
|---|---|---|---|
| Vendor Contract Renewal Calendar in Excel | Plan | Renewal dates kept in email reminders or memory | $4.99 |
| Equipment Maintenance Management System Web App | Plan | A paid CMMS subscription for a small team | $24.99 |
| Maintenance Work Order Data Entry System in Excel | Track | Free-text job logs where one machine has three spellings | $5.99 |
| Work Order Dashboard in Excel | Track | Manual cost-center cost summaries | $17.99 |
| Facility Services Dashboard in Excel | Report | Monthly SLA reports built by hand from several files | $13.99 |
| Preventive Maintenance Dashboard in Excel | Report | Scheduled-versus-done checks done by eye | $17.99 |
| Office Energy Consumption Dashboard in Excel | Report | Utility bills filed but never compared | $17.99 |
| Facility Services Dashboard in Power BI | Present | Static slides exported from spreadsheets | $17.99 |
The 8 best facility manager Excel templates for 2026
1. Facility Services Dashboard in Excel: best overall
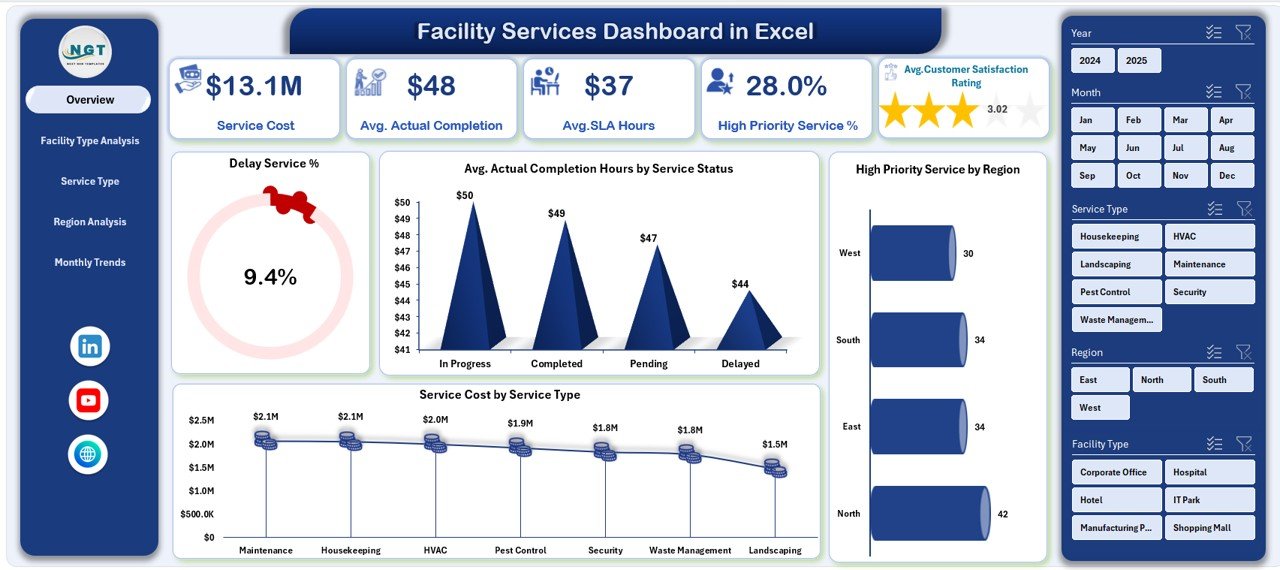
This dashboard turns raw service records into one view of delays, completion time, cost and priority services. It ranks first because it answers the question a facility manager hears most often: are we meeting our service levels, and what does it cost?
Who it is for: facility managers and operations teams who report on SLAs across several sites.
- Overview page with delay service %, completion hours and cost KPIs
- Analysis pages by facility type, service type, region and month
- Interactive slicers and filters, plus a built-in page navigator
- SLA and delay tracking to flag late services
Use cases: compare SLA performance across facility categories, find the region with the highest service cost, spot service types with the most delays, and pull month-wise figures for a review meeting. As an illustration, if 18 of 120 services in a month ran late, the delay rate is 15%, and the region slicer shows where those 18 sit.
Price: $13.99. Get the Facility Services Dashboard in Excel.
Best for: managers who need SLA and cost reporting from one file.
2. Equipment Maintenance Management System Web App: best for teams
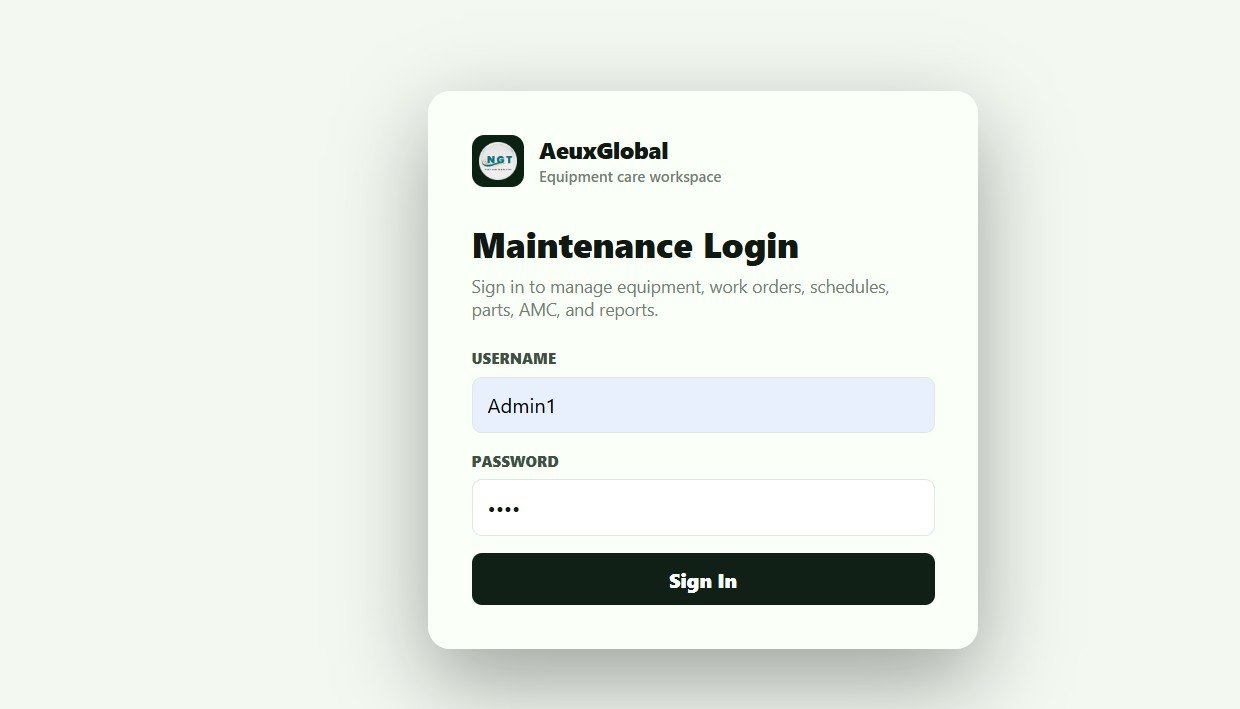
This is a Google Sheets and Apps Script web app with secure login and role-based access. It is the closest thing in this list to a CMMS, and it is the only multi-user tool here.
Who it is for: maintenance teams where technicians and managers both need access and the work happens on phones.
- 21 connected screens, including dashboard, technician view, calendar, equipment master, work orders, spare parts, vendors, AMC and reports
- 12 live KPIs such as open and overdue work orders, PM due, downtime hours, MTTR, MTBF and low-stock parts
- Preventive maintenance schedules that create due work orders on a daily trigger
- Mobile technician view and a breakdown to work order flow
Use cases: let technicians start, hold or complete a job from a phone; link spare-part issues to a work order so cost per asset stays accurate; watch PM overdue counts each morning. MTTR is total repair time divided by the number of repairs, and MTBF is operating time divided by the number of failures, so both improve only if every job is logged.
Price: $24.99. Setup takes under 15 minutes. See the Equipment Maintenance Management System Web App.
Best for: teams that want CMMS-style workflows without a monthly fee.
3. Preventive Maintenance Dashboard in Excel: best for scheduled work
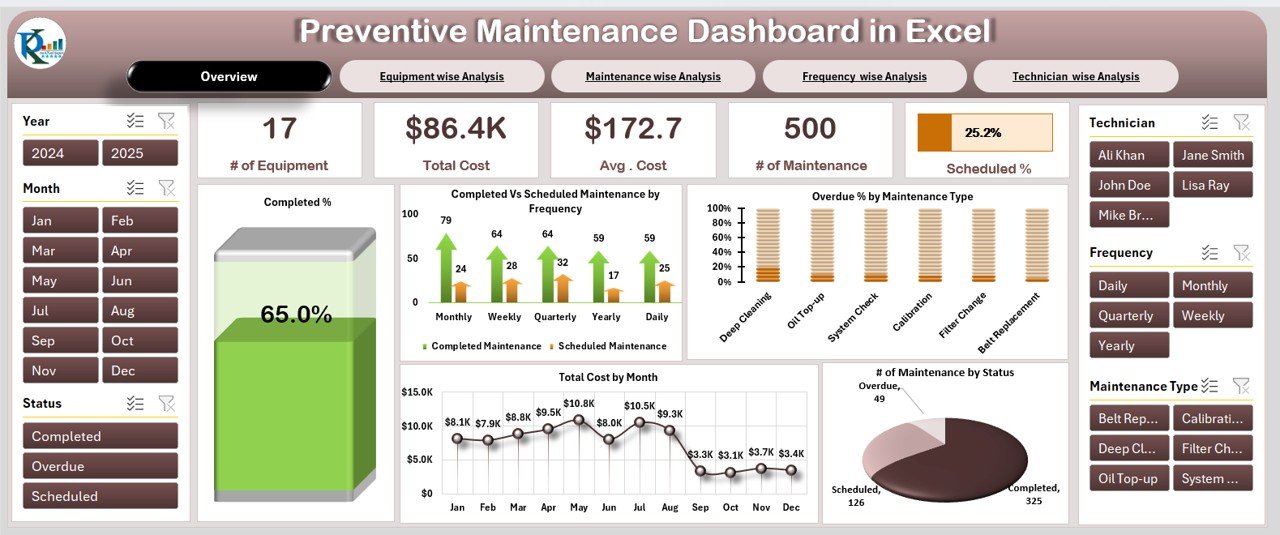
This dashboard shows whether planned maintenance is actually getting done. It brings equipment maintenance, costs and technician performance into one navigable file.
Who it is for: maintenance managers and supervisors who own a schedule and need proof it is being followed.
- Overview sheet with equipment count, total cost, average cost and scheduled % cards
- Charts for completed vs scheduled maintenance (daily, weekly, monthly, yearly)
- Overdue % by maintenance type and status split into completed, pending and overdue
- Equipment-wise and maintenance-wise analysis sheets
Use cases: find the equipment with the highest total cost, see which maintenance type runs overdue most often, and track total cost by month against your budget. If 90 tasks were scheduled and 72 completed, completion is 80%, and the status chart shows how many of the other 18 are pending versus overdue.
Price: $17.99. Get the Preventive Maintenance Dashboard in Excel.
Best for: proving schedule compliance and spotting costly assets.
4. Maintenance Work Order Data Entry System in Excel: best value
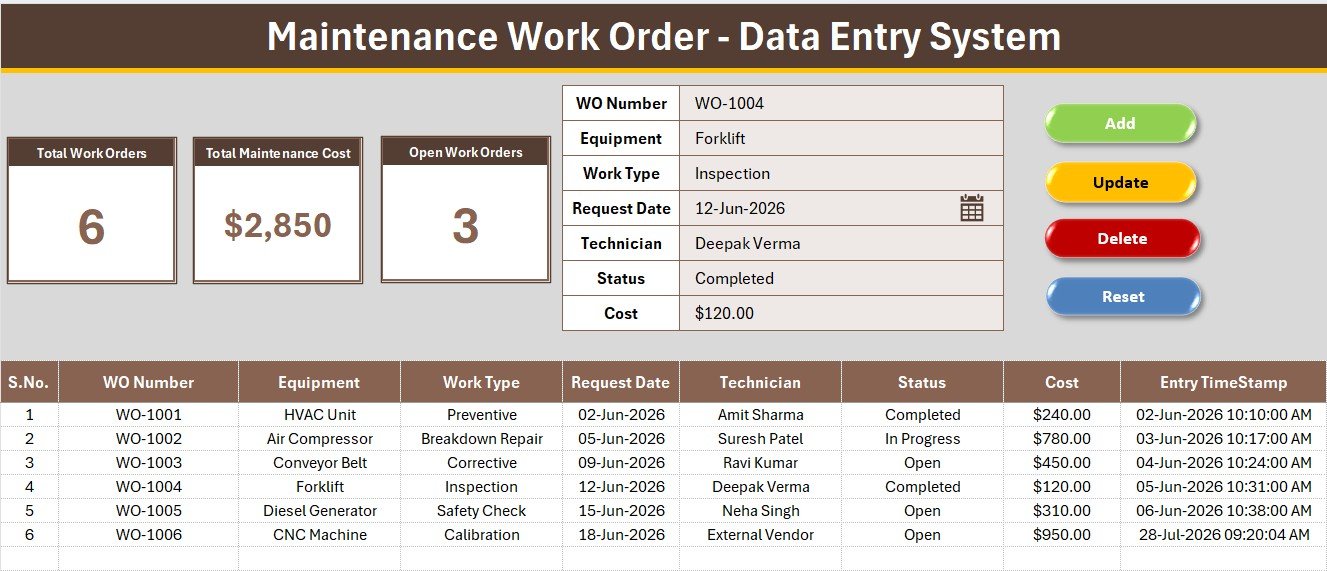
At $5.99 this is the cheapest way to stop losing work orders. A VBA form captures each job and three KPI cards update the moment a row is added.
Who it is for: small maintenance teams that log jobs in notes or email and want structure without a CMMS subscription.
- 7 fields: WO Number, Equipment, Work Type, Request Date, Technician, Status and Cost
- 4 dropdowns holding 33 pre-loaded options, so one machine is never spelled two ways
- 3 live KPI cards: Total Work Orders, Total Maintenance Cost and Open Work Orders
- 4 VBA macros: Add_Record, Update_Record, Delete_Record and Reset_Form
Use cases: log a job in seconds, edit the status when a technician finishes, and read open work orders at a glance. It ships with 6 sample work orders, so the cards show numbers on first open. Setup takes under 10 minutes. It is a log, not a scheduler, so it pairs well with the dashboards below.
Price: $5.99. Get the Maintenance Work Order Data Entry System in Excel.
Best for: the first week of a new maintenance process.
5. Work Order Dashboard in Excel: best for cost control

This dashboard focuses on what work orders cost, not just how many exist. It tracks cost and cost % and compares them with a target.
Who it is for: maintenance managers, service providers and facilities teams that charge work to cost centers.
- Work order cost and cost % by cost center
- Cost views by priority, main work center and order type
- Cost % versus target by cost center
- Filters, slicers and progress trackers
Use cases: see which cost center is over its target, compare priority levels by spend, and give finance a cost view without exporting anything. For example, a cost center with a 12% target that shows 15% actual is 3 points over, and the dashboard makes that gap visible straight away.
Price: $17.99. Get the Work Order Dashboard in Excel.
Best for: teams accountable for maintenance spend by cost center.
6. Facility Services Dashboard in Power BI: best for presenting
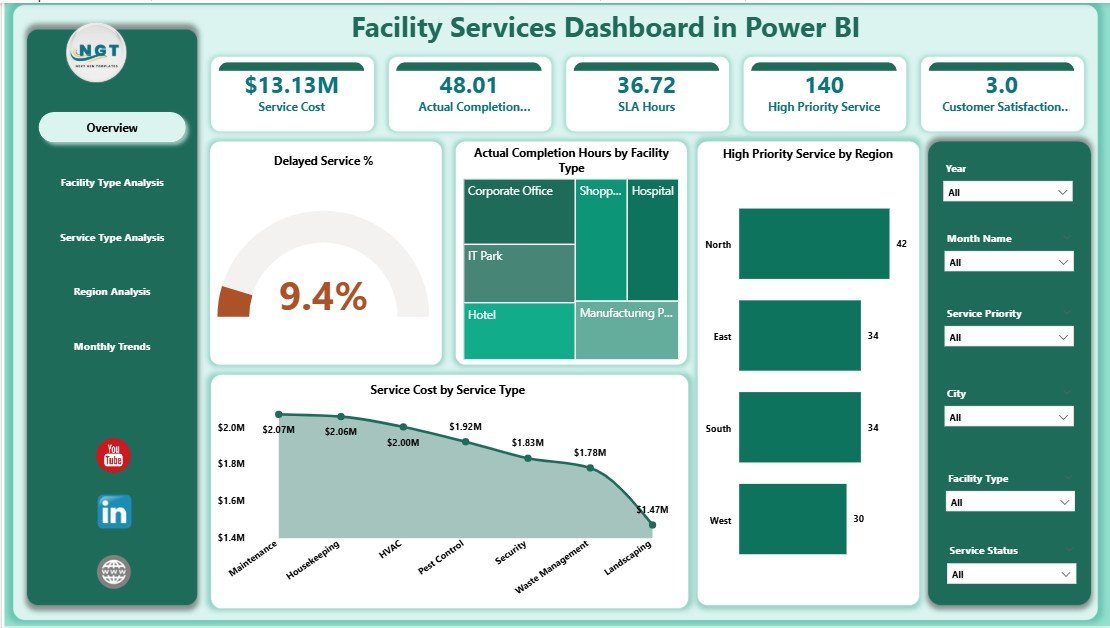
This is the Power BI counterpart of the Excel dashboard in position 1, and it adds satisfaction to the KPI set. Choose it when the audience is leadership and the meeting is live.
Who it is for: facility managers who present to directors and want interactive visuals instead of static slides.
- Delays, completion hours, service cost, priority services and satisfaction in one place
- Slicers by facility, region, service type and month
- Facility-wise, service-wise and region-wise analysis
- Monthly trend views for planning, staffing and budgeting
Use cases: answer a director’s question during the meeting by clicking a region, compare satisfaction across facilities, and show monthly cost trends before a budget request. Because it lives in Power BI, it suits teams that already publish reports there.
Price: $17.99. Get the Facility Services Dashboard in Power BI.
Best for: live leadership reviews.
7. Office Energy Consumption Dashboard in Excel: best for utilities
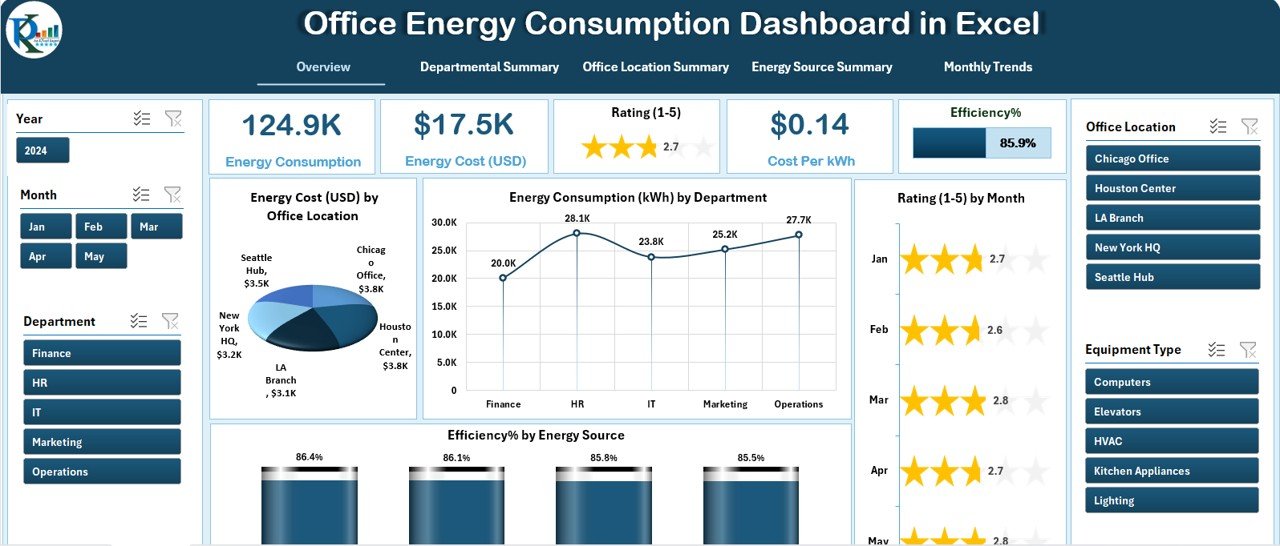
Energy is one of the largest controllable costs in a building, and this dashboard compares it by department, location and source.
Who it is for: facility managers responsible for one office or several branches.
- Overview page with energy cost by location, consumption by department and a monthly rating from 1 to 5
- Department, location and energy source summary pages
- Monthly trends for cost per kWh, consumption and bills
- Structured data sheet (date, location, department, source, kWh, cost, efficiency, rating) and a support sheet for dropdowns
Use cases: rank departments by cost per kWh, compare electricity against solar, and spot seasonal peaks. Cost per kWh is total cost divided by kWh used, so a department paying $900 for 6,000 kWh sits at $0.15 per kWh and can be compared with its peers.
Price: $17.99. Get the Office Energy Consumption Dashboard in Excel.
Best for: multi-office energy cost comparison.
8. Vendor Contract Renewal Calendar in Excel: best for planning

Cleaning, security, lift and HVAC contracts all renew on different dates. This calendar keeps them in one place so a renewal is never found out after it lapses.
Who it is for: facility managers who manage many service vendors.
- Contract start and end dates, renewal terms and key clauses
- Renewal reminders and follow-up tracking
- Vendor performance tracking through the contract period
- Customizable fields and categories
Use cases: review each vendor’s performance before renewing, give yourself time to renegotiate, and assign who follows up. At $4.99 it is the cheapest tool in the stack. For vendor scoring in more depth, see our supplier management Excel templates.
Price: $4.99. Get the Vendor Contract Renewal Calendar in Excel.
Best for: never missing a renewal date.
How do you roll the stack out in 30 days?
Do not install all eight at once. Add one layer a week so the team learns each tool before the next arrives.
| Week | Add | Goal | Cumulative cost |
|---|---|---|---|
| Week 1 | Vendor Contract Renewal Calendar, Maintenance Work Order Data Entry System | Enter every contract date and log every new job | $10.98 |
| Week 2 | Facility Services Dashboard in Excel, Work Order Dashboard | First SLA and cost review from real data | $42.96 |
| Week 3 | Preventive Maintenance Dashboard, Office Energy Consumption Dashboard | Check schedule compliance and utility cost by site | $78.94 |
| Week 4 | Facility Services Dashboard in Power BI, Equipment Maintenance Management System Web App (if you need multiple users) | Leadership view and team access | $121.92 |
Week 1 costs $10.98, week 2 adds $31.98, week 3 adds $35.98, and week 4 adds $42.98, which together give the $121.92 total. If you do not need the Power BI view or multiple users, you can stop after week 3 at $78.94.
How to choose between them
Pick by your biggest current pain, not by feature count.
- Jobs get lost or logged inconsistently: start with the Maintenance Work Order Data Entry System ($5.99).
- You are asked about SLAs and delays: Facility Services Dashboard in Excel ($13.99).
- Several people must update records: Equipment Maintenance Management System Web App ($24.99).
- Budget owners ask about spend: Work Order Dashboard ($17.99).
- Leadership wants interactive reports: Power BI version ($17.99).
If you work with related operations, our guides to fleet management dashboards, Excel inventory management tools and IT asset management dashboards cover the neighbouring tracking jobs.
Excel or Google Sheets or Power BI: which format fits?
Excel suits single-owner files and offline work. The Google Sheets web app suits shared access with logins and mobile use. Power BI suits presentation and interactive reporting. The Facility Services Dashboard exists in both Excel ($13.99) and Power BI ($17.99), so you can run the Excel file for daily work and the Power BI file for meetings. For broader work management comparisons, see our Smartsheet alternatives and Monday.com alternatives. If contracts are your main concern, the contract management dashboard shows a related approach.
When a template is NOT the right answer
Templates do not fit every facility operation. Buy software instead in these situations:
- Large teams with hundreds of daily users. A spreadsheet-based tool will strain. A dedicated CMMS with enterprise support is safer.
- Strict audit or compliance trails. If a regulator needs immutable records and approval workflows, a purpose-built system is the better choice. The IFMA site at ifma.org is a good place to check professional standards for your sector.
- IoT sensor integration. The templates here rely on data you enter or paste. They do not connect to building sensors on their own.
- No one will own the data. A dashboard shows only what is entered. If nobody updates it, the numbers go stale.
For most small and mid-sized facility teams, though, a one-time purchase covers the core jobs at a fraction of a yearly subscription.
Frequently asked questions
What are the best facility manager Excel templates?
The best facility manager Excel templates are the Facility Services Dashboard in Excel ($13.99) for SLA and cost reporting, the Maintenance Work Order Data Entry System ($5.99) for logging jobs, and the Preventive Maintenance Dashboard ($17.99) for schedule compliance. Together with five other tools they form an eight-template stack.
How much does a full facility manager template stack cost?
All eight templates in this post cost $121.92 in total, paid once. Individual prices run from $4.99 for the Vendor Contract Renewal Calendar to $24.99 for the Equipment Maintenance Management System Web App. You do not need all eight; many teams start with two or three.
Can Excel replace a CMMS for facility maintenance?
For small teams, often yes. The Maintenance Work Order Data Entry System ($5.99) logs jobs and shows open work orders, and the Preventive Maintenance Dashboard ($17.99) tracks schedules. Larger teams, audit-heavy sites and sensor-driven operations should look at a dedicated CMMS instead.
What should a facility manager track in Excel?
Track work orders, preventive maintenance completion, service delays against SLAs, maintenance cost, energy use and vendor contract dates. These six areas cover most facility manager reporting. The templates in this post map to each of them, so you can add one area at a time.
Do these templates need a subscription?
No. Each template is a one-time purchase with no per-user fees. The product pages list instant download and lifetime access. The Power BI dashboard needs Power BI to open it, so check your own licence for that tool.
Which template should I buy first?
If you report on service levels, buy the Facility Services Dashboard in Excel ($13.99). If your main problem is untracked jobs, buy the Maintenance Work Order Data Entry System ($5.99). It sets up in under 10 minutes and gives you three live KPI cards immediately.
Is there a multi-user option for maintenance teams?
Yes. The Equipment Maintenance Management System Web App ($24.99) runs on Google Sheets with Apps Script, secure login and Admin or User roles. It has 21 screens, 12 dashboard KPIs and a mobile technician view, and setup takes under 15 minutes.
How do I track preventive maintenance in Excel?
List each asset, its task type and frequency, then record scheduled and completed dates. The Preventive Maintenance Dashboard in Excel ($17.99) turns that into completed vs scheduled charts, overdue % by maintenance type and cost by equipment, so you can see missed tasks quickly.
Can I show facility KPIs in Power BI instead of Excel?
Yes. The Facility Services Dashboard in Power BI ($17.99) covers delays, completion hours, cost, priority services and satisfaction with slicers by facility, region, service type and month. It suits live reviews, while the Excel version ($13.99) suits daily working files.
How long does it take to set up the stack?
A reasonable plan is 30 days. Week 1 covers the contract calendar and work order log, weeks 2 and 3 add dashboards, and week 4 adds the Power BI view. Individual tools set up faster: the work order system takes under 10 minutes and the web app under 15.
Get more facility management templates
Start with the best-value tool. The Maintenance Work Order Data Entry System in Excel is $5.99 and sets up in under 10 minutes. When you are ready to report, add the Facility Services Dashboard in Excel for $13.99.
Watch walkthroughs on the Next Gen Templates YouTube channel, and browse the full list in our facility management templates guide.