Running an online store without a dashboard is like driving with your eyes closed. You might move forward, but you will never know where you are headed. Whether you sell fashion apparel, electronics, or lifestyle products, tracking your sales, profits, shipping, and customer satisfaction in real time is no longer optional — it is essential.
That is exactly why NextGenTemplates has created three ready-to-use e-commerce dashboards that give online retailers complete visibility into their business performance. In this post, we will walk you through each dashboard, compare their features, and help you pick the right one for your needs.
Why Every Online Seller Needs an E-Commerce Dashboard
E-commerce businesses generate massive amounts of data every single day. Orders, returns, customer ratings, payment methods, shipping timelines — the list goes on. Without a centralized dashboard, this data sits in scattered spreadsheets and reports, making it nearly impossible to spot trends or make quick decisions.
A well-designed dashboard brings everything together in one place. It highlights your best-selling products, flags underperforming regions, reveals payment preferences, and tracks profit margins — all updated automatically. The result? Faster decisions, fewer losses, and consistent growth.
Meet the 3 E-Commerce Dashboards from NextGenTemplates
Let us take a closer look at each dashboard and understand what makes them unique.
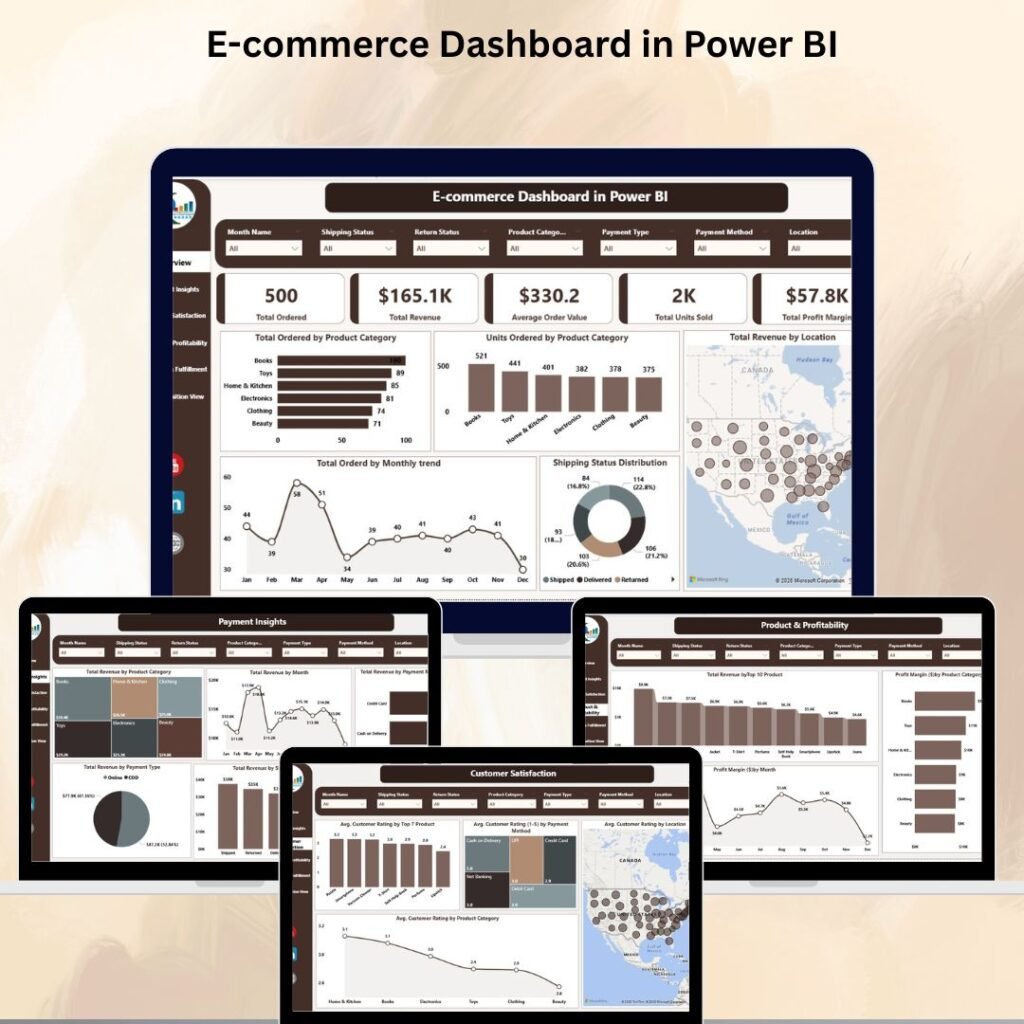
1. E-Commerce Dashboard in Power BI — The All-Rounder
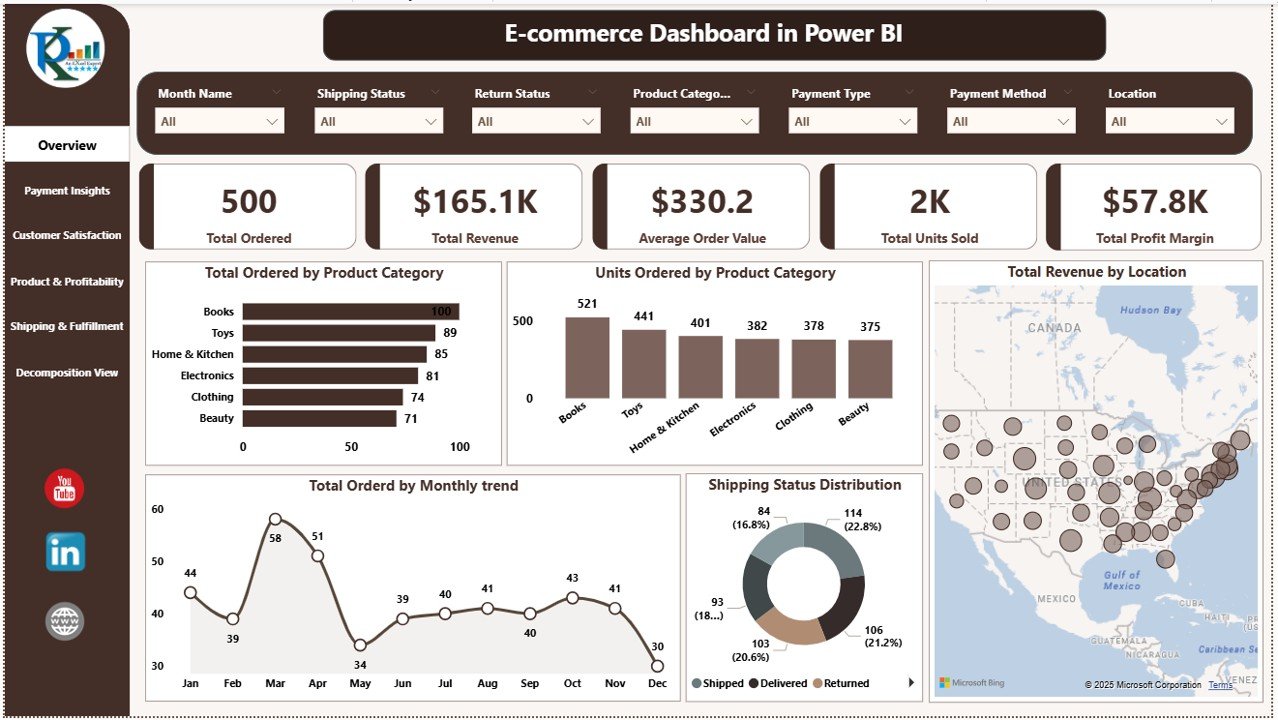
If you run a general e-commerce store and want a comprehensive analytics tool, the E-Commerce Dashboard in Power BI is your best bet. It covers everything from sales and revenue to customer ratings and shipping performance across six interactive pages.
What makes it stand out:
- Overview Page with KPI cards for total orders, revenue, average order value, units sold, and profit margin
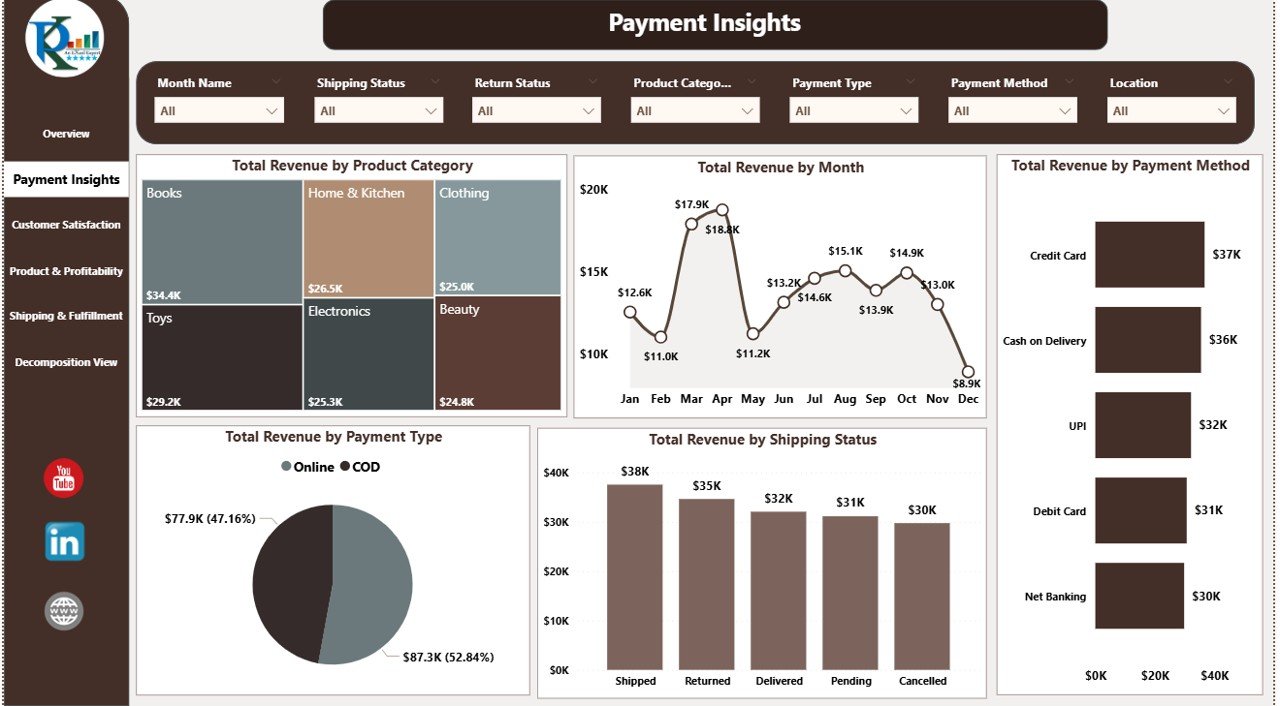
- Payment Insights that break down revenue by payment method, type, and shipping status
- Customer Satisfaction Page tracking average ratings by product, region, and payment method
- Product & Profitability Analysis showing revenue by top 10 products and profit margins by category
- Shipping & Fulfillment Page monitoring delivery days and return rates by location and category
- Decomposition Tree for multi-dimensional drill-down analysis on revenue, orders, or profit
This dashboard is ideal for e-commerce store owners, operations managers, and business analysts who need a 360-degree view of their online business. It connects easily with Excel, CSV, or database feeds, and every visual is fully customizable.
2. Fashion E-Commerce Dashboard in Excel — The Budget-Friendly Powerhouse
Not everyone uses Power BI, and that is perfectly fine. The Fashion E-Commerce Dashboard in Excel delivers professional-grade analytics using nothing but Microsoft Excel. It is specifically designed for fashion brands, boutiques, and online clothing retailers.

Key highlights include:
- Five analytical pages — Overview, Brand Name, Payment Mode, Region, and Monthly Trends
- KPI cards for total orders, revenue, profit, average order value, and customer satisfaction
- Brand-level comparison showing discounts, profit margins, returned orders, and delayed deliveries per brand
- Payment mode analysis to understand whether COD, cards, or wallets generate better results
- Regional breakdown of profits, order values, discounts, and return rates
- Monthly trend charts for sales, profit margin percentage, and satisfaction scores
The best part? It requires zero coding knowledge. Just paste your order data into the Data Sheet, and every chart and KPI updates automatically. It is perfect for fashion retailers and startups who want powerful insights without investing in expensive BI software.

3. Fashion E-Commerce Dashboard in Power BI — The Premium Pick
For fashion brands that are ready to level up their analytics game, the Fashion E-Commerce Dashboard in Power BI offers the same fashion-focused analysis but with the full power of Power BI’s interactive visuals, slicers, and real-time refresh capabilities.
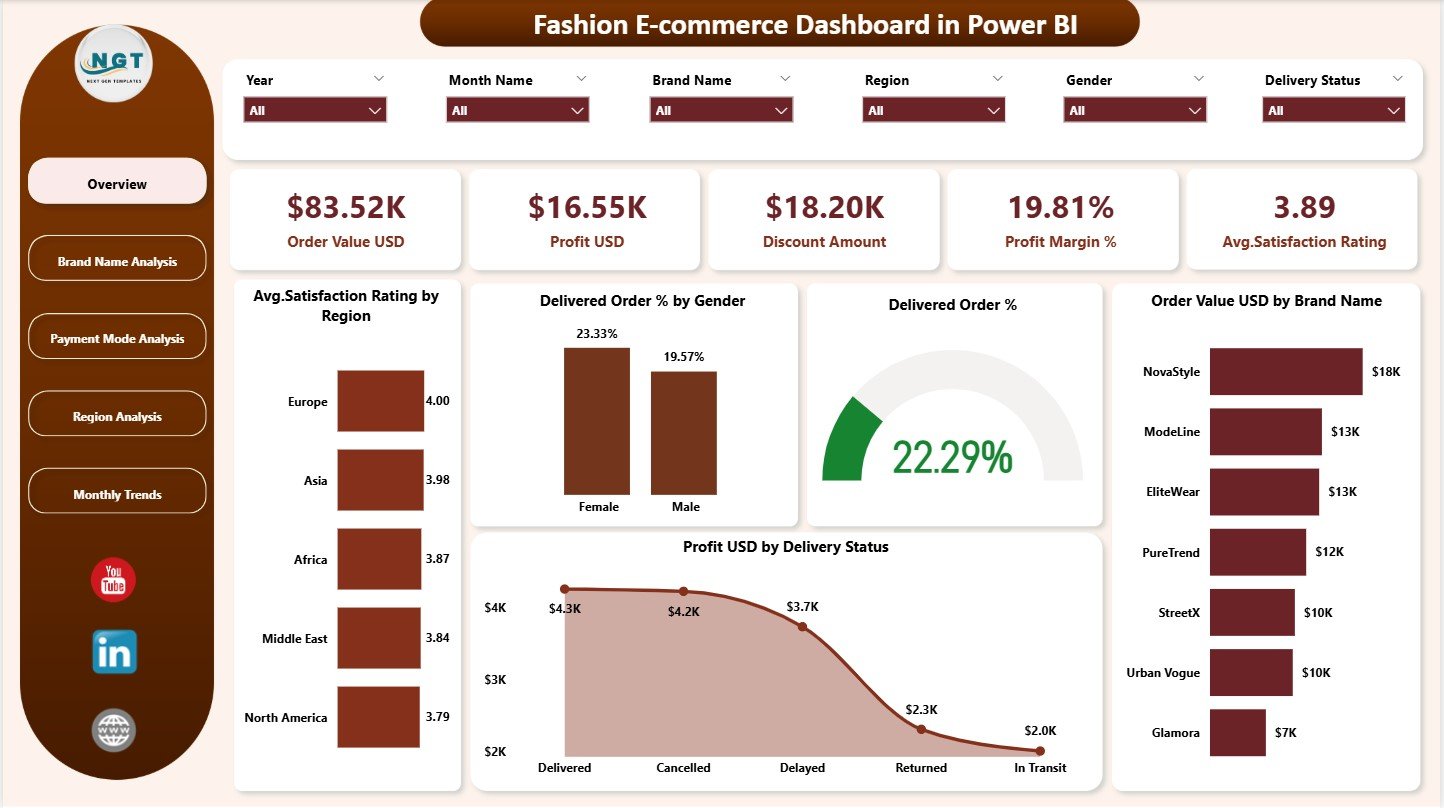
Here is what you get:
- Five interactive pages covering Overview, Brand Analysis, Payment Mode, Region, and Monthly Trends
- Real-time visual updates — no manual refreshing needed
- Advanced slicers to filter data by gender, brand, region, or payment type
- Profit margin and discount effectiveness tracking at every level
- Delivery performance charts to identify delays and return-heavy regions
- Monthly trend analysis for planning seasonal campaigns and product launches
This dashboard is built for e-commerce managers, marketing teams, and senior leadership who want fast, accurate, and visually rich reporting. If your fashion brand is scaling and you need deeper insights with less manual effort, this is the right choice.
Quick Comparison — Which Dashboard Should You Choose?
| Feature | E-Commerce Dashboard (Power BI) | Fashion Dashboard (Excel) | Fashion Dashboard (Power BI) |
|---|---|---|---|
| Platform | Power BI | MS Excel | Power BI |
| Industry Focus | General E-Commerce | Fashion & Apparel | Fashion & Apparel |
| Dashboard Pages | 6 Pages + Decomposition Tree | 5 Pages + Data & Support Sheets | 5 Interactive Pages |
| Real-Time Updates | Yes | Formula-Based Auto Refresh | Yes |
| Brand-Level Analysis | No | Yes | Yes |
| Decomposition Tree | Yes | No | No |
| Coding Required | No | No | No |
| Best For | All online stores | Fashion startups & boutiques | Scaling fashion brands |
Who Should Use These Dashboards?
These three dashboards are designed for a wide range of professionals in the e-commerce industry. Online store owners can use them to monitor daily performance and profitability. Sales and marketing teams will find them invaluable for tracking campaign ROI and seasonal trends. Operations and logistics managers can keep an eye on delivery timelines and return rates. Finance teams can analyze discount impact and profit margins with ease. Fashion brand owners specifically benefit from the brand-level comparisons that the two fashion dashboards provide.
Whether you are a solo entrepreneur or leading a large e-commerce team, there is a dashboard here that fits your workflow perfectly.
Final Thoughts — Turn Your Data Into Revenue
In 2026, data-driven decision-making is not a luxury — it is a necessity. These three e-commerce dashboards from NextGenTemplates give you the power to track everything that matters, identify what is working, and fix what is not.
If you manage a general online store, start with the E-Commerce Dashboard in Power BI. If you are in the fashion industry and prefer Excel, grab the Fashion E-Commerce Dashboard in Excel. And if you want premium Power BI analytics tailored for fashion, the Fashion E-Commerce Dashboard in Power BI is your best investment.
Stop guessing. Start tracking. And watch your e-commerce profits grow.
📺 Visit our YouTube channel to watch the demo.
Youtube.com/@NextGenTemplates