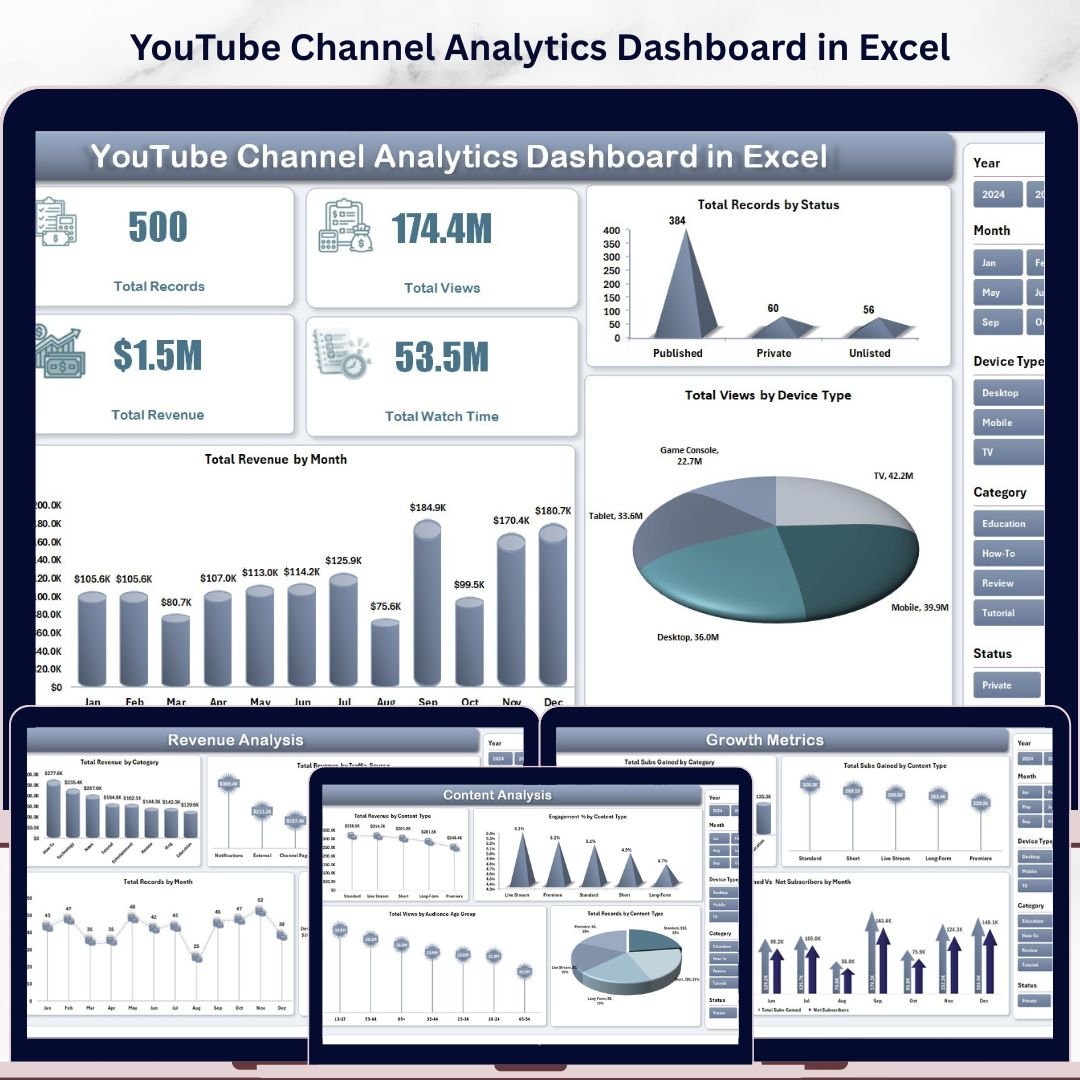


YouTube Channel Analytics Dashboard in Excel is a powerful, interactive analytics template built for YouTubers, content creators, digital marketers, and media managers who want to track video performance, analyze audience behavior, monitor revenue trends, and measure channel growth — all inside Microsoft Excel. This Excel dashboard template features 5 interactive analysis pages covering Overview, Content Analysis, Audience Insights, Revenue Analysis, and Growth Metrics — giving you a complete 360-degree view of your YouTube channel performance.
This template tracks 4 key performance indicators on the Overview page including Total Records, Total Views, Total Revenue, and Total Watch Time. With dynamic slicers and pivot-driven charts across every page, you can instantly filter data by month, content type, device, audience age group, traffic source, category, and status. Whether you run a single YouTube channel or manage multiple creator accounts, this dashboard delivers the analytical clarity you need to grow subscribers, maximize revenue, and optimize your digital marketing strategy.
🔑 Key Features of YouTube Channel Analytics Dashboard in Excel
📌 5 Interactive Dashboard Pages — Overview, Content Analysis, Audience Insights, Revenue Analysis, and Growth Metrics provide a comprehensive view of your YouTube channel data from every angle.
📌 Dynamic Slicers for Instant Filtering — Apply filters across all pages to drill down by month, category, content type, device type, audience demographics, traffic source, and video status.
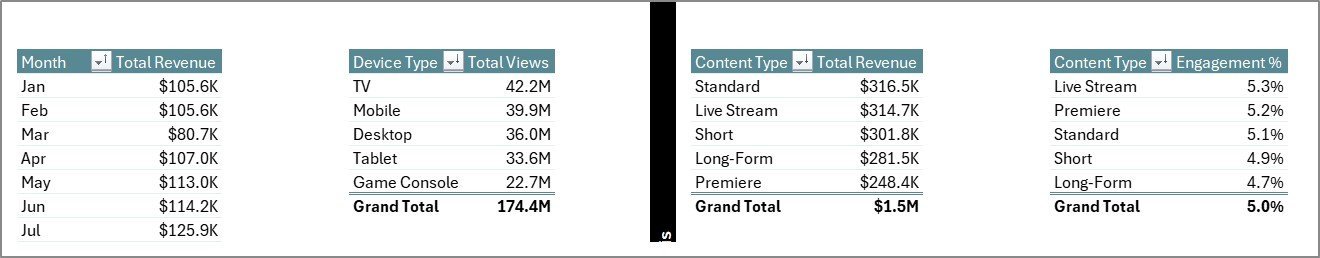
📌 Revenue Tracking Across Multiple Dimensions — Analyze total revenue by month, content type, category, traffic source, device type, and audience age group to identify your most profitable content segments.
📌 Audience Behavior Analysis — Understand who watches your videos with breakdowns by age group, traffic source, engagement percentage, and subscriber growth patterns.
📌 Growth Metrics Tracking — Monitor subscribers gained by category, content type, and month-over-month trends to measure channel momentum and identify growth opportunities.
📌 Pivot Table Backend — All charts are powered by pivot tables in a dedicated Support sheet, ensuring the entire dashboard updates automatically when you refresh data.
📌 Plug-and-Play Data Sheet — Simply replace the sample data with your own YouTube analytics export and click Refresh All to see your personalized dashboard instantly.
📌 No VBA or Macros Required — Works with standard Excel features including pivot tables, slicers, and charts — compatible with Excel 2016 and later versions.
📦 What’s Inside the YouTube Channel Analytics Dashboard in Excel
This Excel dashboard template includes 7 sheet tabs organized for maximum usability:
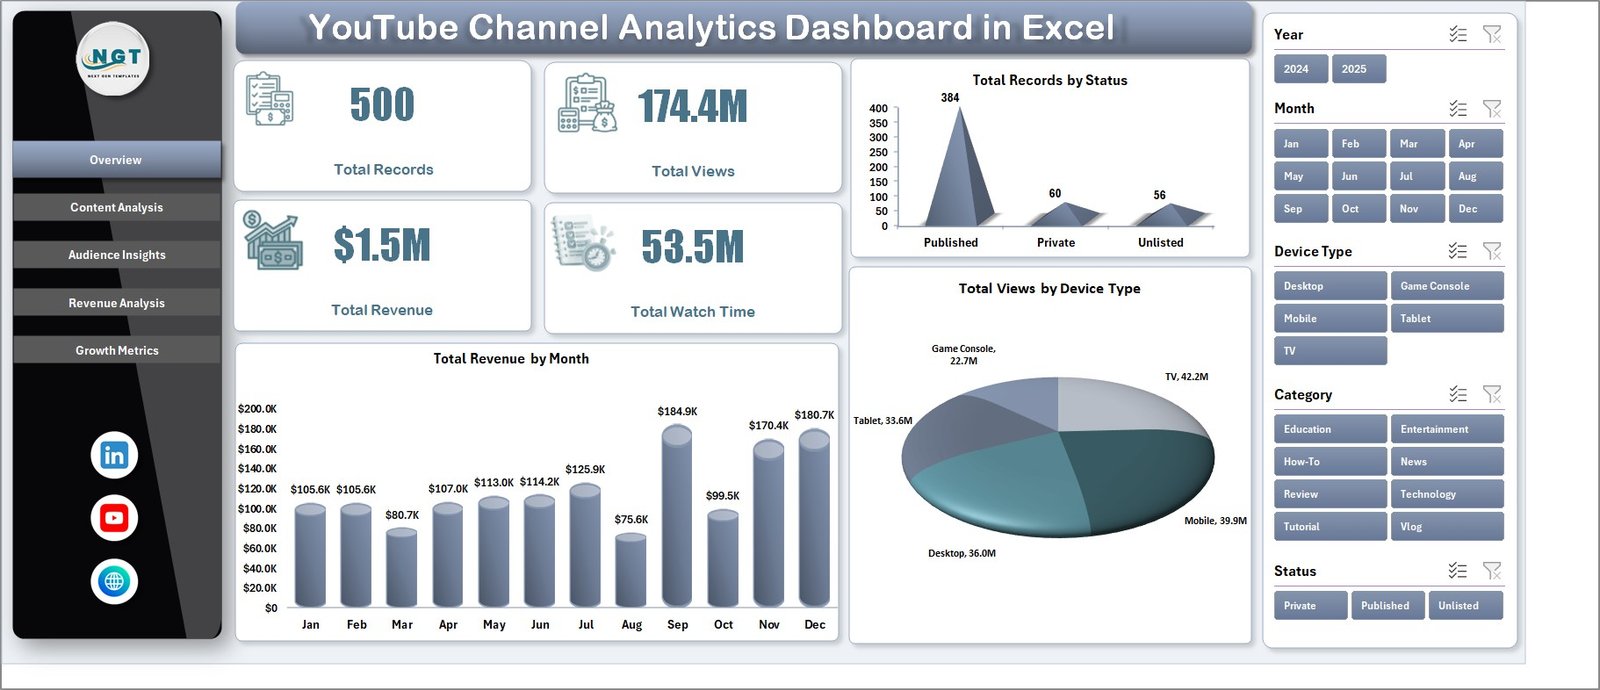
📊 Overview Page — Displays high-level KPI cards for Total Records, Total Views, Total Revenue, and Total Watch Time. Includes charts for Total Revenue by Month, Total Records by Status, and Total Views by Device Type. Multiple slicers let you filter the entire dashboard with a single click.
 YouTube Channel Analytics Dashboard in Excel
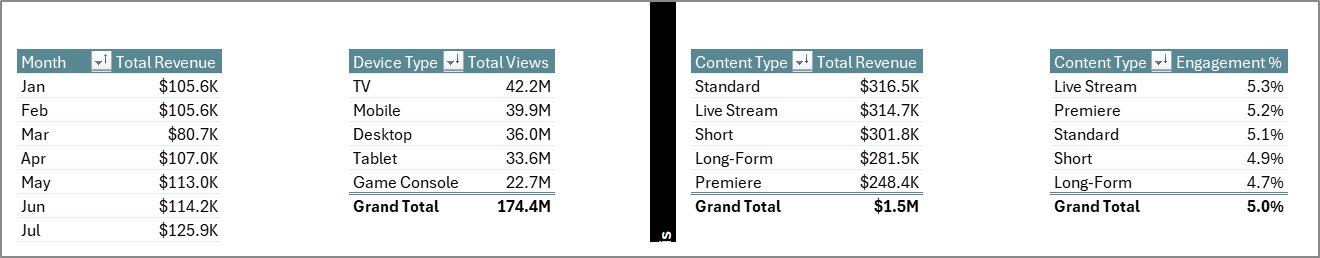
📊 Content Analysis — Breaks down your video performance by content type with charts showing Total Revenue by Content Type, Engagement % by Content Type, Total Views by Audience Age Group, and Total Records by Content Type.
 Content Analysis
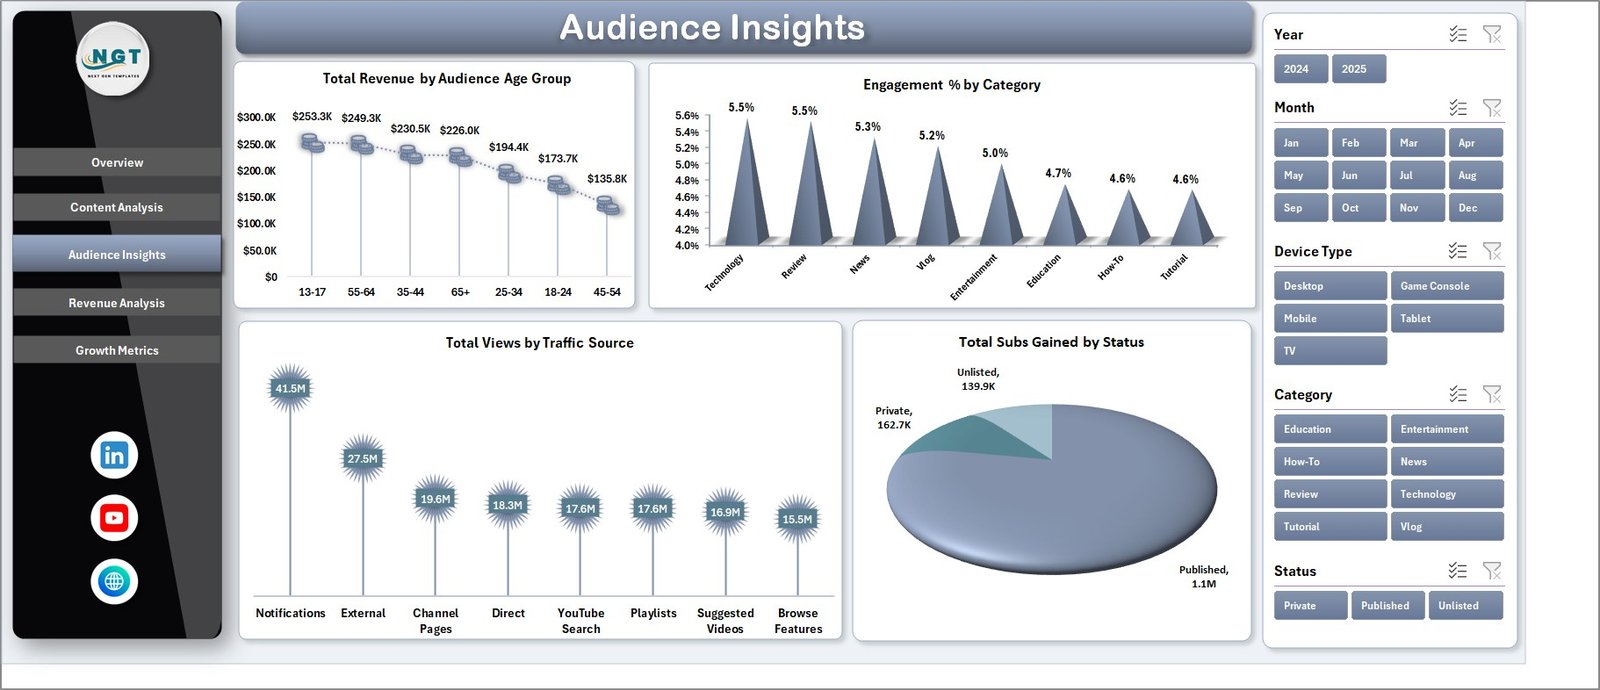
📊 Audience Insights — Reveals who your viewers are and how they find your content with Total Revenue by Audience Age Group, Engagement % by Category, Total Views by Traffic Source, and Total Subs Gained by Status.
 Audience Insights
📊 Revenue Analysis — Provides deep revenue insights with Total Revenue by Category, Total Revenue by Traffic Source, Total Records by Month, and Total Revenue by Device Type to help you understand where your money comes from.
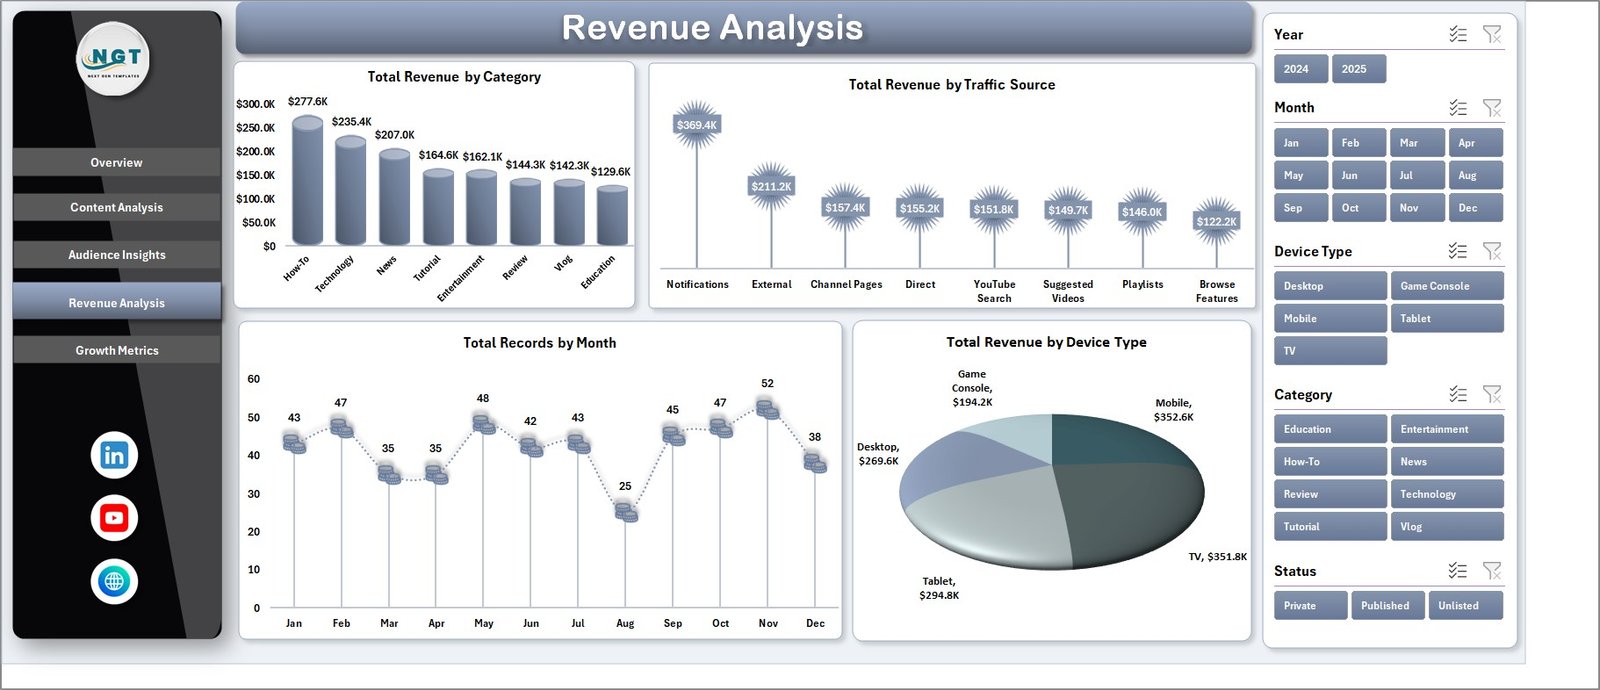 Revenue Analysis
📊 Growth Metrics — Tracks subscriber acquisition with Total Subs Gained by Category, Total Subs Gained by Content Type, and Total Subs Gained vs Month to help you measure and forecast channel growth.
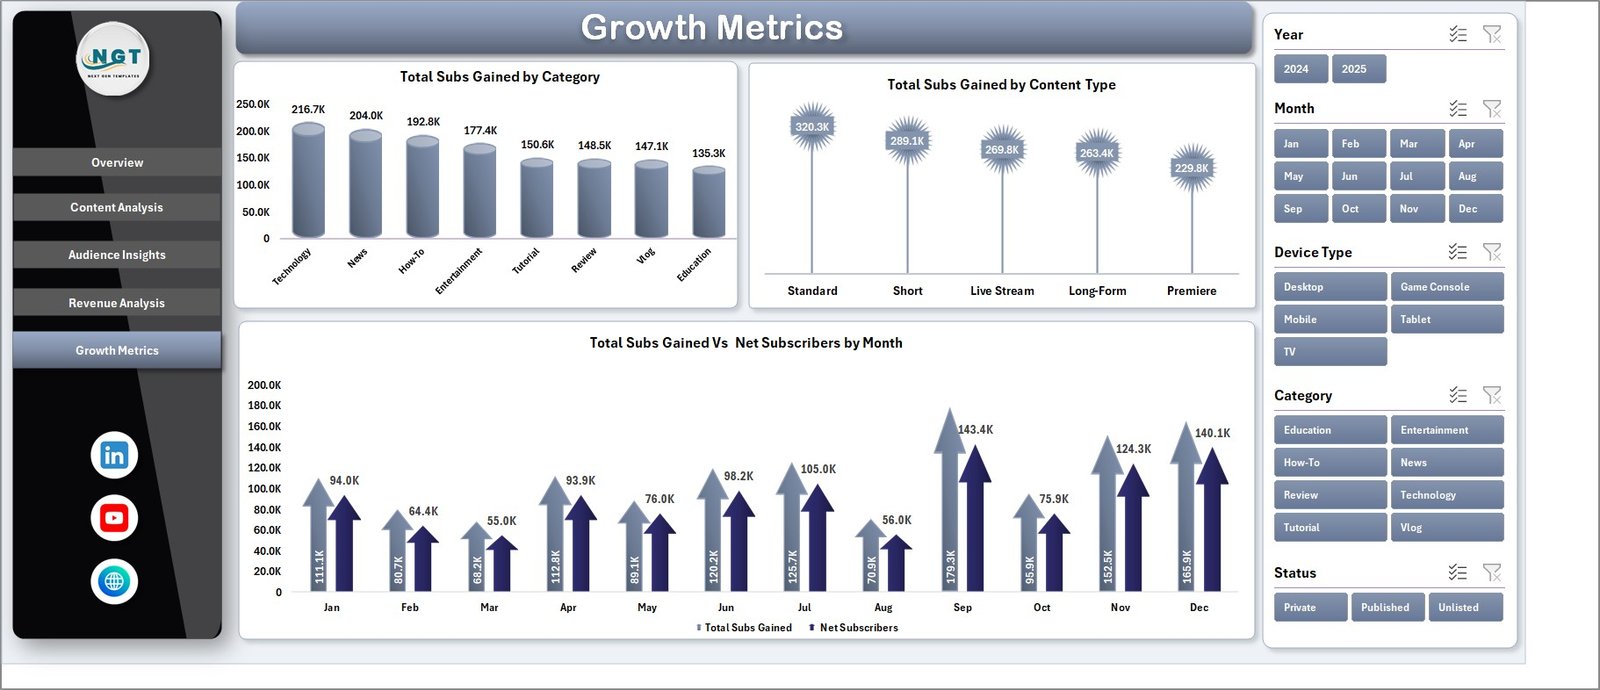 Growth Metrics
📋 Data Sheet — This is where you enter your YouTube analytics data. Simply paste your data in the same format as the sample data provided, and the entire dashboard will update once you refresh.
 Data Sheet Tab
⚙️ Support Sheet — Contains all the pivot tables that power the dashboard charts. After updating data, go to the Data tab in the Excel Ribbon and click Refresh All. All pivots and charts refresh automatically. You can keep this sheet hidden for a cleaner view.
 Support Sheet Tab
⚙️ How to Use the YouTube Channel Analytics Dashboard in Excel
1️⃣ Download and open the Excel file on your desktop or laptop.
2️⃣ Navigate to the Data Sheet tab and replace the sample data with your own YouTube analytics export data.
3️⃣ Go to the Data tab in the Excel Ribbon and click Refresh All to update all pivot tables and charts.
4️⃣ Use the slicers on each dashboard page to filter by month, category, content type, device, audience age, traffic source, or status.
5️⃣ Explore all 5 dashboard pages for different analytical perspectives of your YouTube channel.
👥 Who Can Benefit from This YouTube Channel Analytics Dashboard
🔹 YouTube Content Creators — Track video performance, subscriber growth, and revenue trends in a single dashboard.
🔹 Digital Marketing Managers — Analyze channel analytics to optimize content strategy and ad spend across YouTube.
🔹 Social Media Agencies — Monitor multiple client YouTube channels with a professional, branded reporting template.
🔹 Freelance Video Editors & Producers — Present data-driven insights to clients about their YouTube performance.
🔹 Small Business Owners — Understand how YouTube content drives brand awareness, engagement, and revenue.
If you manage YouTube channels for e-commerce, education, entertainment, or any niche, this dashboard is a perfect fit. You may also explore the Etsy Seller Analytics Dashboard in Excel for marketplace seller analytics, or the Amazon FBA Seller Dashboard in Excel for Amazon sales tracking.
❓ Frequently Asked Questions
What KPIs does the YouTube Channel Analytics Dashboard in Excel track?
The YouTube Channel Analytics Dashboard in Excel tracks 4 key performance indicators on the Overview page: Total Records, Total Views, Total Revenue, and Total Watch Time. Across all 5 pages, it also analyzes engagement percentage, subscriber growth, revenue by content type, views by device and traffic source, and audience age demographics.
Do I need advanced Excel skills to use this YouTube dashboard template?
No. Simply replace the sample data in the Data Sheet tab with your own YouTube analytics data and click Refresh All from the Data tab in the Excel Ribbon. All pivot tables, charts, and KPI cards update automatically without any formulas or macros.
Can I use this dashboard to track multiple YouTube channels?
Yes. You can consolidate data from multiple YouTube channels into the Data Sheet by adding a channel name column and use the slicers to filter by individual channels.
What Excel version do I need for this YouTube analytics dashboard?
This dashboard works with Microsoft Excel 2016 and later versions, including Excel for Microsoft 365. It uses standard pivot tables and slicers — no VBA or macros required.
How do I export my YouTube data into this Excel dashboard?
You can export your YouTube analytics from YouTube Studio or Google Analytics, then format the data to match the sample columns in the Data Sheet tab. Paste it in and refresh all pivot tables.
What is the best Excel template for tracking YouTube channel performance?
The YouTube Channel Analytics Dashboard in Excel by NextGenTemplates is one of the best options available. It includes 5 interactive pages covering content analysis, audience insights, revenue tracking, and growth metrics — all powered by pivot tables for automatic updates.
🔗 Explore Related Templates
🔹 Etsy Seller Analytics Dashboard in Excel — Track your Etsy store performance with detailed sales, traffic, and conversion analytics.
🔹 Amazon FBA Seller Dashboard in Excel — Monitor Amazon FBA sales, inventory, fees, and profitability in one powerful Excel dashboard.
🔹 SaaS Metrics Dashboard in Excel — Analyze SaaS business KPIs including MRR, churn, LTV, and customer acquisition in Excel.
📖 Click here to read the Detailed Blog Post
🎥 Visit our YouTube channel to learn step-by-step video tutorials
👉 YouTube.com/@NextGenTemplates
Watch the step-by-step video tutorial:
YouTube


Reviews
There are no reviews yet.