Wind energy is playing a critical role in the global transition toward clean and sustainable electricity generation. Wind Energy Farms KPI Dashboard in Power BI Governments and renewable energy companies are investing heavily in wind farms to reduce carbon emissions and increase energy independence. However, operating a wind farm efficiently requires continuous monitoring of turbine performance, maintenance efficiency, production output, and financial results.
Many wind energy operators still rely on manual spreadsheets or disconnected reporting systems. As a result, performance insights become delayed, operational risks increase, and decision-making slows down. To overcome these challenges, organizations are adopting advanced analytics platforms that provide real-time performance visibility.
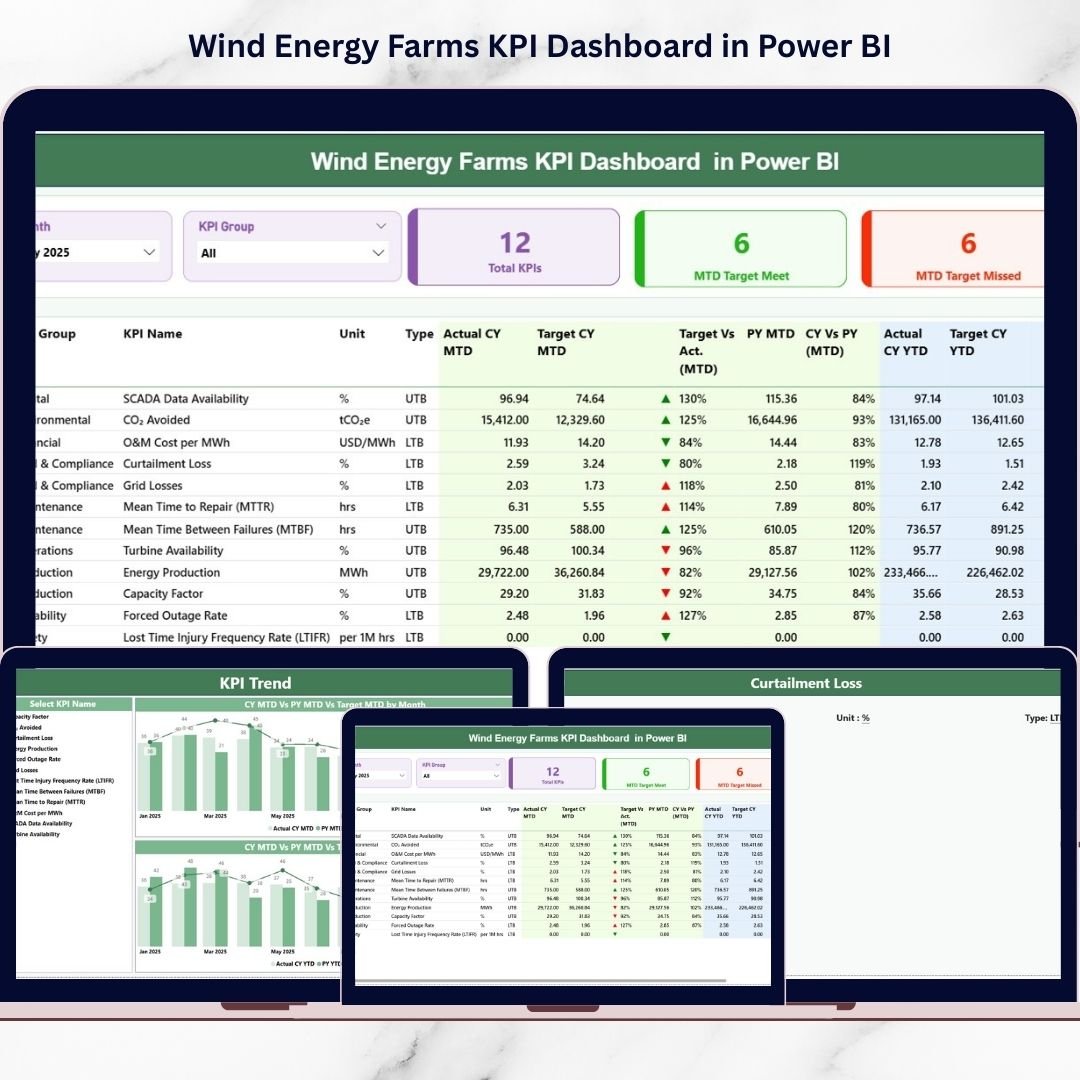
The Wind Energy Farms KPI Dashboard in Power BI is a powerful, ready-to-use business intelligence solution designed to centralize wind farm performance monitoring into one interactive environment. By combining structured Key Performance Indicators (KPIs) with Power BI’s dynamic visualizations, this dashboard converts raw operational data into actionable insights.
Instead of reviewing multiple reports separately, managers and analysts can evaluate operational efficiency through a single interactive dashboard. Because Power BI enables filtering, drill-through analysis, and automated calculations, decision-makers gain deeper understanding and faster control over wind farm performance.
Wind Energy Farms KPI Dashboard in Power BI Whether your goal is improving turbine availability, optimizing maintenance planning, or monitoring energy production trends, this dashboard delivers professional analytics without complexity.
🚀 Key Feature of Wind Energy Farms KPI Dashboard in Power BI
🌬️ Interactive Performance Dashboard – Monitor all wind farm KPIs through a centralized visual interface.
📊 MTD & YTD Analysis – Track both short-term and long-term operational performance instantly.
🎯 Actual vs Target Comparison – Automatically evaluate performance against operational goals.
📈 Dynamic Trend Analysis – Visual charts reveal performance patterns across time periods.
🔎 Advanced Slicers & Filters – Analyze KPIs by month or KPI group in real time.
📉 Historical Performance Benchmarking – Compare Current Year vs Previous Year results.
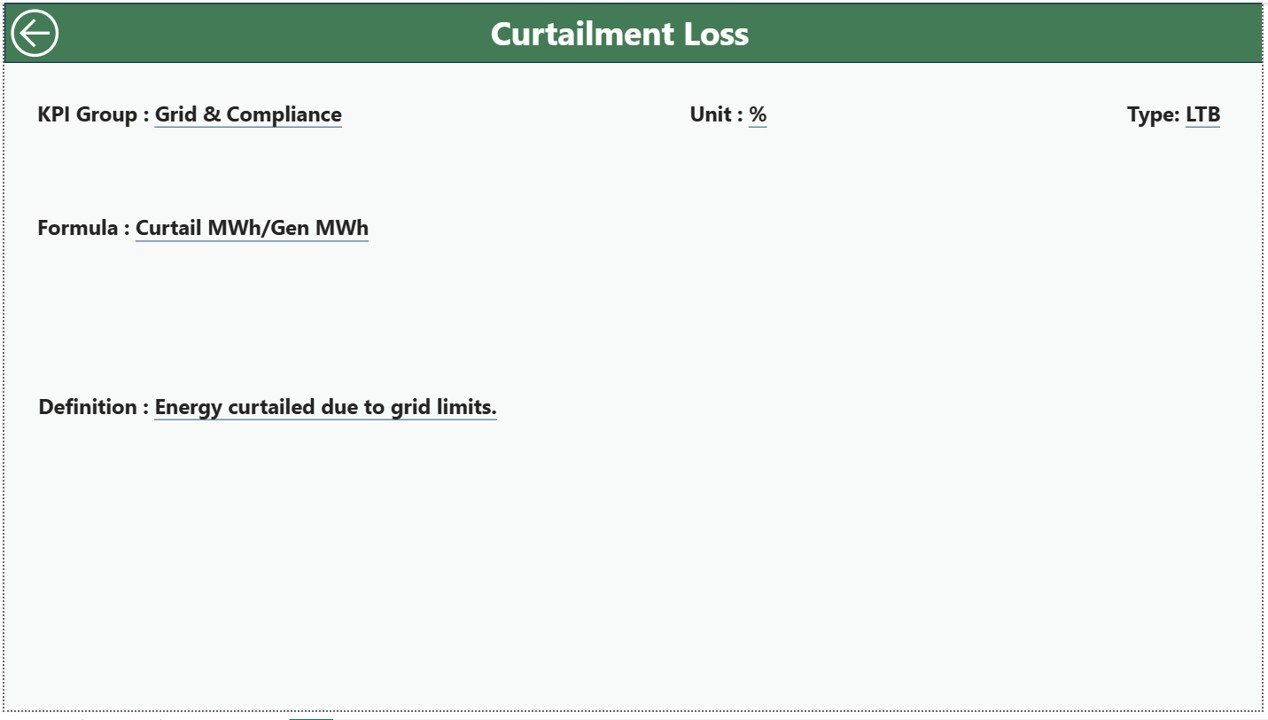
🧩 Drill-Through KPI Insights – Access KPI formulas and definitions instantly.
🔄 Excel Data Integration – Update Excel data and refresh Power BI visuals automatically.
📦 What’s Inside the Wind Energy Farms KPI Dashboard in Power BI
This professionally designed Power BI solution includes three interactive analytical pages:
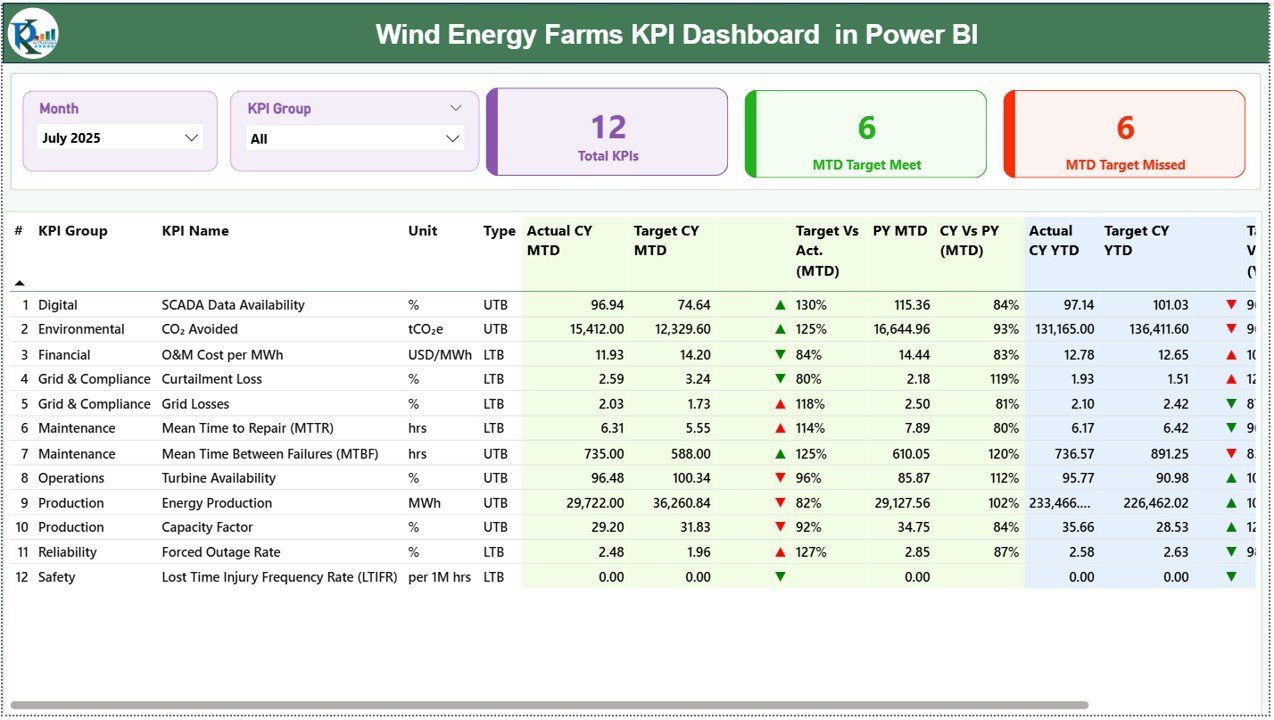
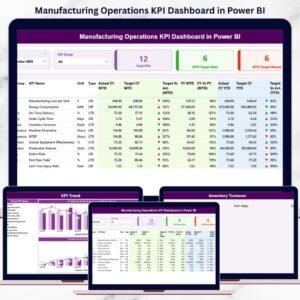
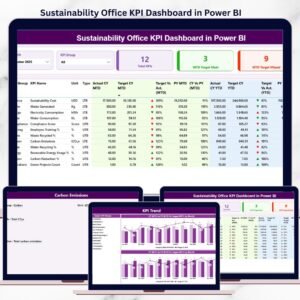
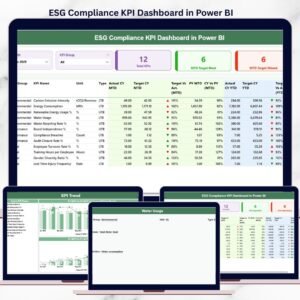
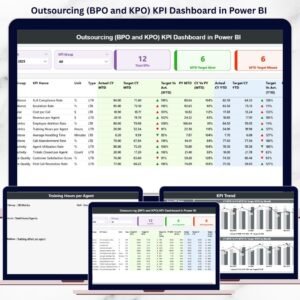
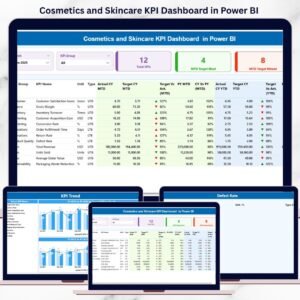
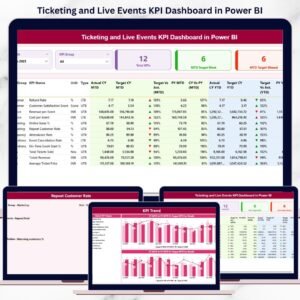
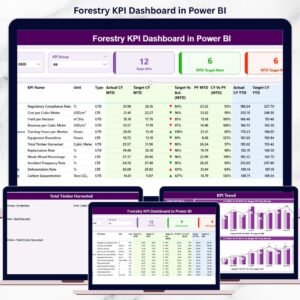
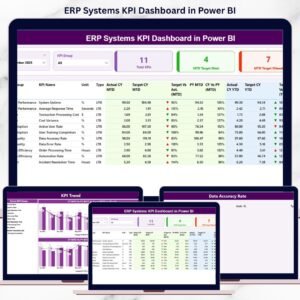
📊 Summary Page – Central Performance Overview
The main dashboard showing KPI counts, performance cards, and a detailed KPI table with MTD and YTD analysis, including Actual vs Target and Previous Year comparisons.
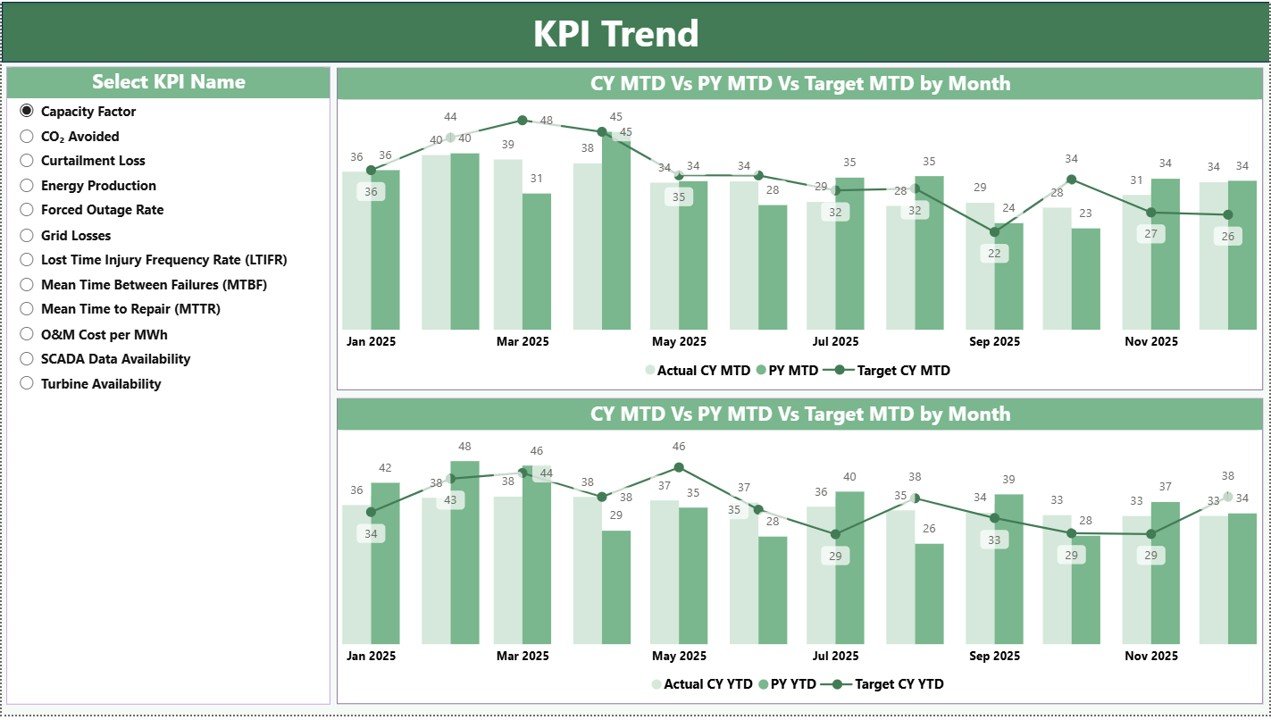
📈 KPI Trend Page – Performance Analysis
Dynamic combo charts visualize KPI performance trends, comparing Current Year Actual, Target values, and Previous Year results for both MTD and YTD analysis.
📘 KPI Definition Page – Drill-Through Analytics
A dedicated page displaying KPI formulas, definitions, classification types, and measurement logic for transparency and consistent reporting.
The dashboard connects directly to structured Excel sheets used for Actual data, Targets, and KPI Definitions.
⚙️ How to Use the Wind Energy Farms KPI Dashboard in Power BI
Implementation is simple and user-friendly:
1️⃣ Define wind farm KPIs aligned with operational goals.
2️⃣ Enter KPI definitions in the Excel Definition sheet.
3️⃣ Add Actual and Target values regularly.
4️⃣ Refresh Power BI data model.
5️⃣ Use slicers to filter performance views.
6️⃣ Analyze trends and KPI indicators for decision-making.
Within minutes, organizations gain complete operational visibility.
👥 Who Can Benefit from This Wind Energy Farms KPI Dashboard in Power BI
This dashboard is ideal for renewable energy professionals and organizations:
🌬️ Wind Farm Operators
⚡ Renewable Energy Companies
📊 Energy Analysts
🔧 Maintenance Managers
📈 Operations Leaders
🌍 Sustainability Consultants
💼 Energy Investors & Executives
Both growing renewable startups and large-scale energy operators can use this dashboard to enhance operational efficiency and strategic planning.
By transforming operational data into visual intelligence, the Wind Energy Farms KPI Dashboard in Power BI helps organizations reduce downtime, improve forecasting, and drive sustainable performance improvements.
### Click here to read the Detailed blog post
Visit our YouTube channel to learn step-by-step video tutorials:
👉 https://youtube.com/@PKAnExcelExpert