Wildlife conservation isn’t just about passion — it’s about data-driven action. With species facing extinction, habitats under threat, and poaching incidents on the rise, organizations need powerful tools to monitor, analyze, and optimize their conservation strategies. That’s where the Wildlife Conservation KPI Dashboard in Power BI comes in.
This ready-to-use Power BI template empowers NGOs, researchers, policymakers, and conservation managers to track critical KPIs, evaluate performance trends, and make informed decisions — all in one interactive dashboard.
🔑 Key Features of the Dashboard
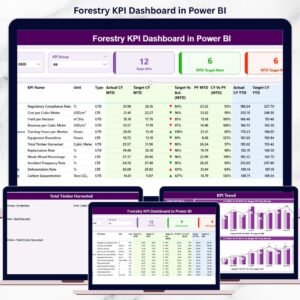
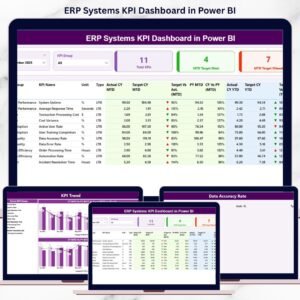
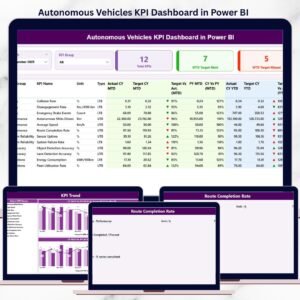
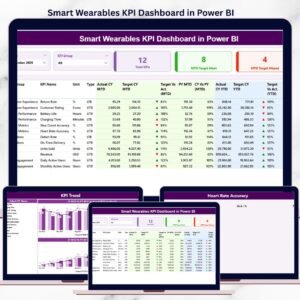
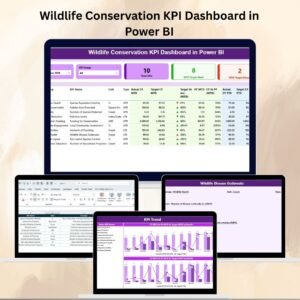
✨ 3 Powerful Dashboard Pages – Summary, KPI Trend, and KPI Definition.
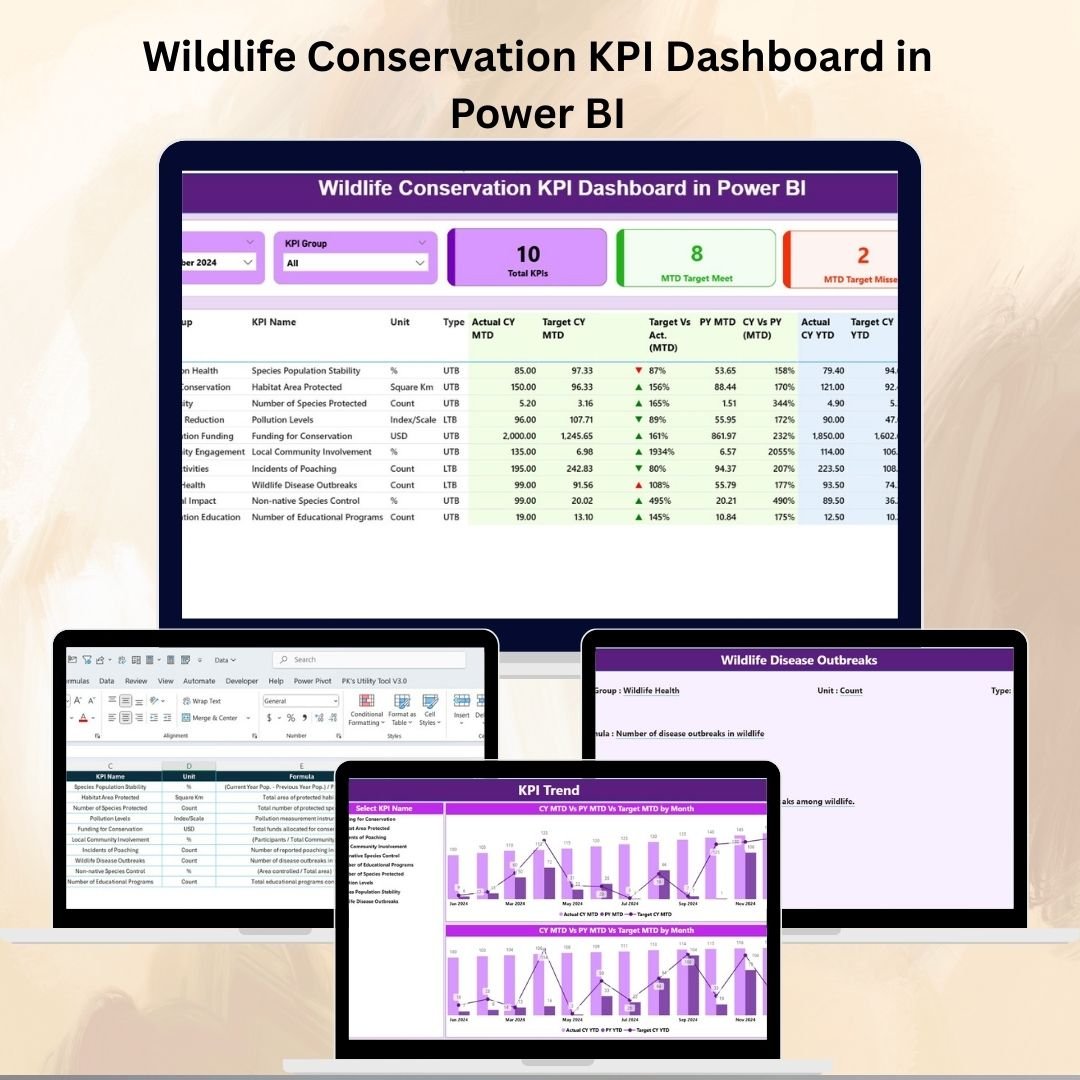
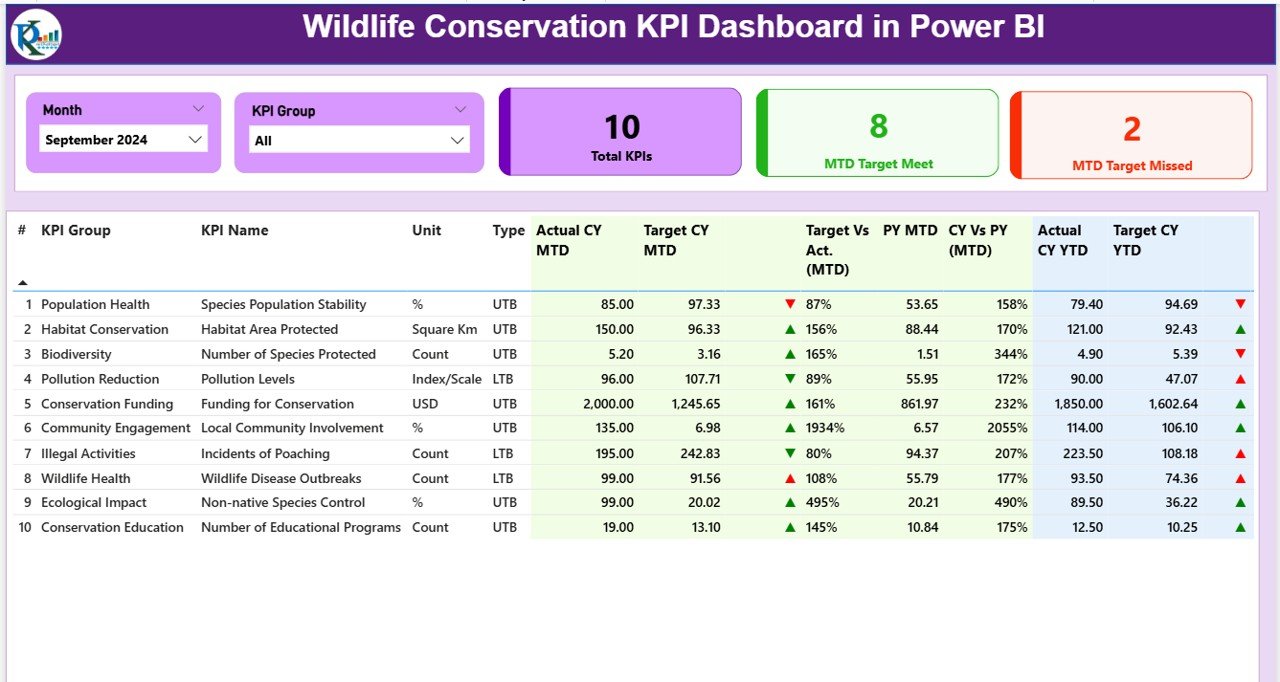
✨ Summary Page – Provides KPI Cards (Total KPIs, MTD Target Met, MTD Target Missed) and a detailed KPI performance table.
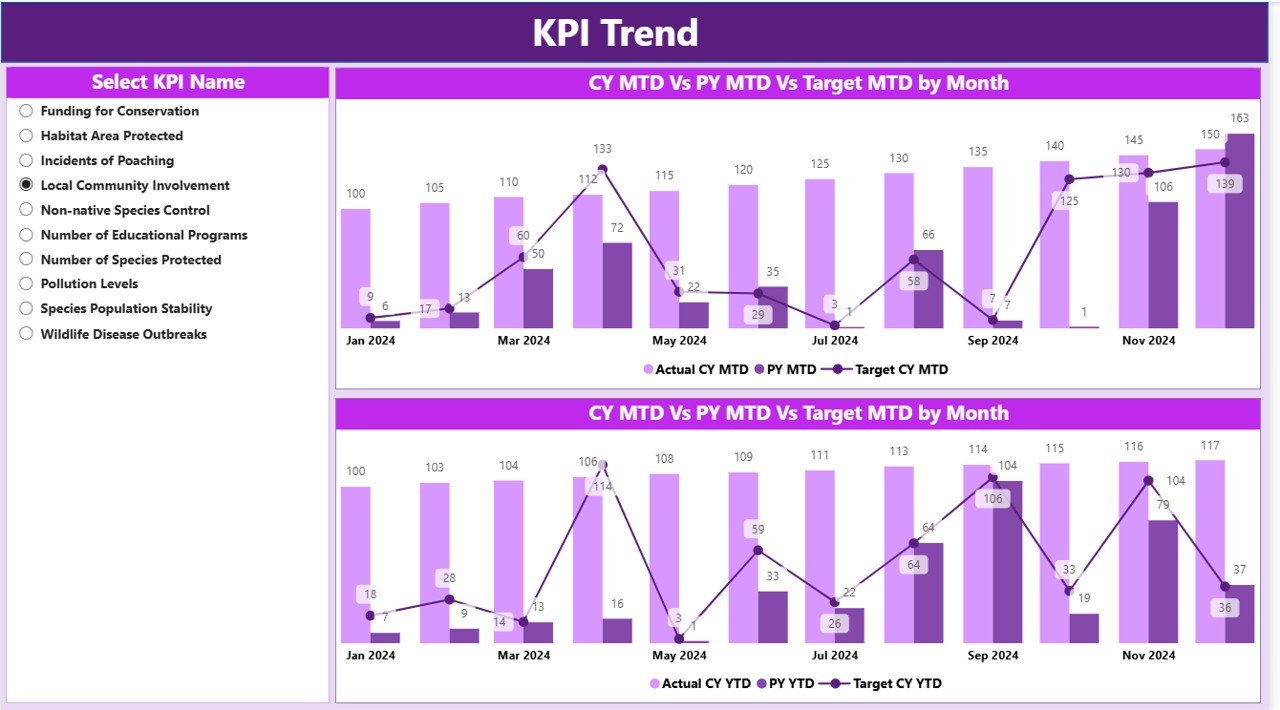
✨ KPI Trend Page – Combo charts track Actual, Target, and Previous Year values (both MTD & YTD).
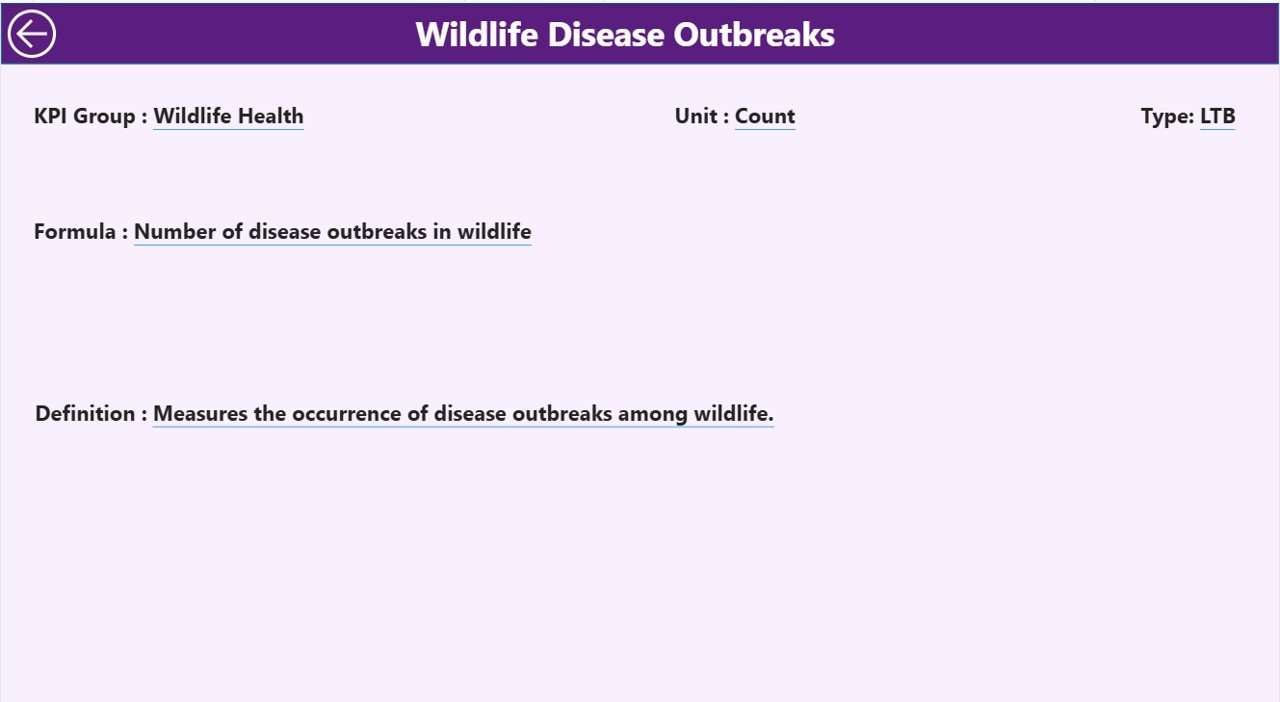
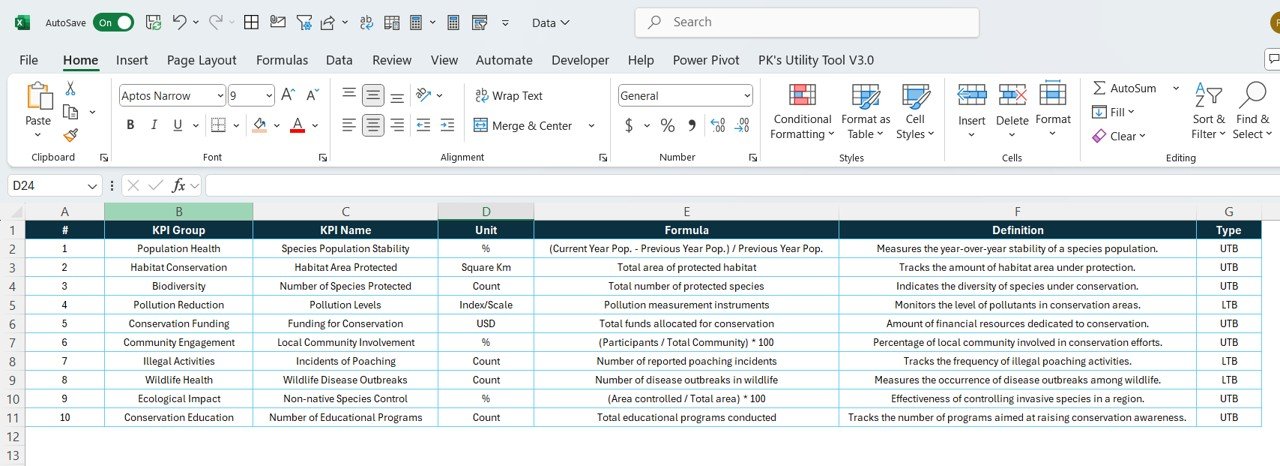
✨ KPI Definition Page – Drill-through view with clear KPI definitions, formulas, and types (UTB/LTB).
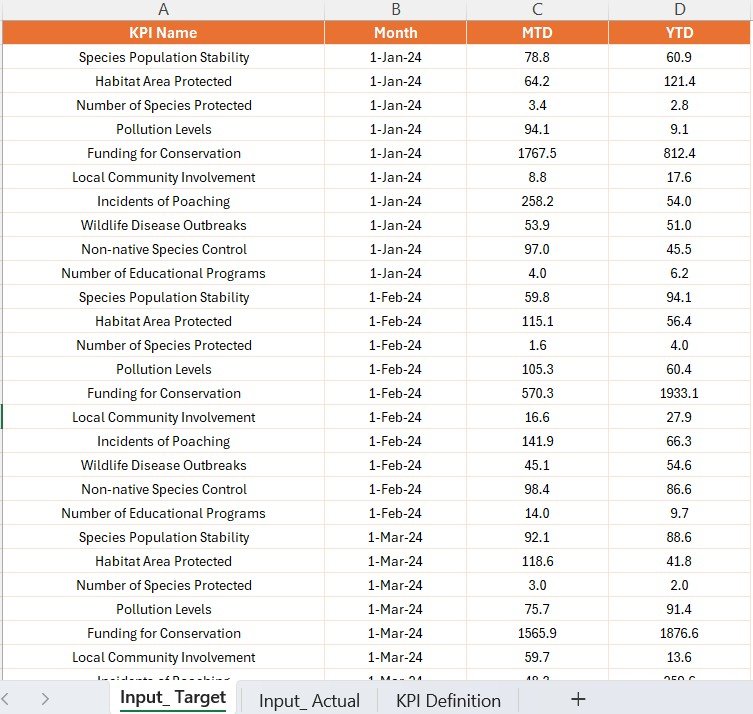
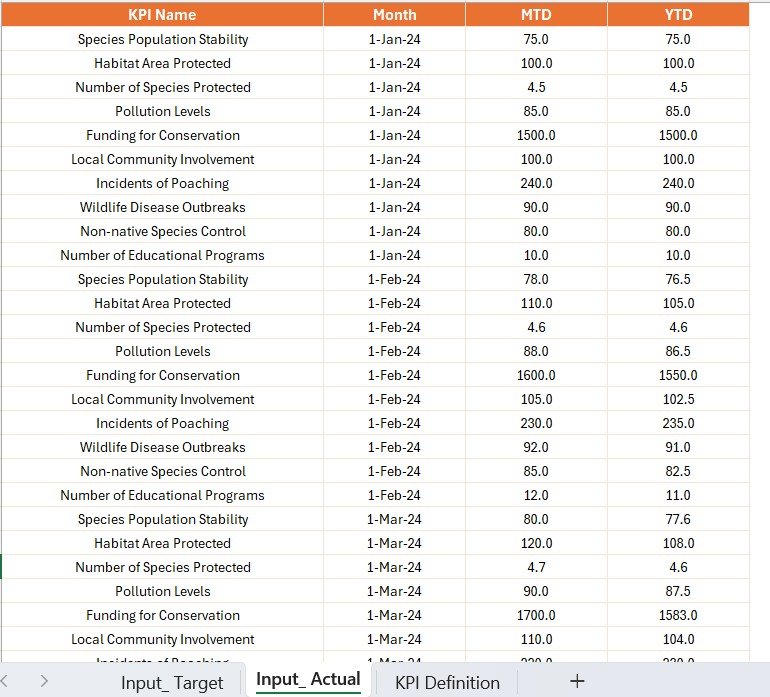
✨ Excel Integration – Uses structured Excel sheets (Input_Actual, Input_Target, KPI Definition) for easy updates.
✨ Conditional Formatting – Green/Red arrows quickly highlight performance gaps.
✨ Custom Filters & Slicers – Analyze by Month, KPI Group, or specific metrics.
✨ Audit-Ready Design – Structured definitions and trends ensure complete transparency.
📦 What’s Inside the Dashboard
When you download the Wildlife Conservation KPI Dashboard in Power BI, you’ll get:
1️⃣ Summary Page – A consolidated view of all conservation KPIs with cards, tables, and performance comparisons (MTD & YTD).
2️⃣ KPI Trend Page – Interactive visuals showing progress over time, helping spot trends in conservation activities.
3️⃣ KPI Definition Page – A drill-through sheet explaining every KPI, its group, formula, and definition.
4️⃣ Excel Input Files – Three structured sheets:
-
Input_Actual – Enter monthly and yearly actuals.
-
Input_Target – Record monthly and yearly targets.
-
KPI Definition – Store all KPI metadata.
This setup ensures clarity, accountability, and consistent reporting.
🛠️ How to Use the Dashboard
✔️ Step 1 – Prepare Data: Fill in Excel sheets with actual conservation data and targets.
✔️ Step 2 – Load Data: Connect the Excel file to the Power BI dashboard.
✔️ Step 3 – Monitor Summary: Use the Summary Page for quick MTD & YTD performance insights.
✔️ Step 4 – Track Trends: Switch to the KPI Trend Page for historical and comparative analysis.
✔️ Step 5 – Drill into Details: Use the KPI Definition Page for a deeper understanding of each metric.
✔️ Step 6 – Refresh Regularly: Update Excel data to keep insights current.
No advanced Power BI knowledge is required — it’s plug-and-play!
👥 Who Can Benefit from This Dashboard?
🌍 NGOs & Non-Profits – Showcase conservation impact to donors & stakeholders.
🏞️ National Parks & Wildlife Reserves – Monitor poaching, patrols, and habitat health.
📊 Research Institutions – Track ecological trends and publish data-driven studies.
🏢 Government Agencies – Align conservation efforts with policies and compliance.
💼 Corporate CSR Teams – Measure and report wildlife conservation project outcomes.
Whether you’re managing a small conservation program or a nationwide initiative, this dashboard adapts to your needs.
✅ Why Choose Power BI for Wildlife Conservation?
✔️ Centralized KPI Monitoring – All data in one place.
✔️ Real-Time Insights – MTD & YTD analysis with auto-refresh from Excel.
✔️ Better Decision-Making – Data-driven insights for resource allocation.
✔️ Performance Comparisons – Easily track Actual vs Target vs Previous Year.
✔️ Scalable & Customizable – Add new KPIs, visuals, or integrations anytime.
✔️ User-Friendly – Excel as a backend keeps it simple and familiar.
Click here to read the Detailed blog post
Visit our YouTube channel for step-by-step tutorials 👉 Youtube.com/@PKAnExcelExpert


Reviews
There are no reviews yet.