Are you running a web development agency but still juggling multiple Excel sheets to track revenue, projects, and client performance?
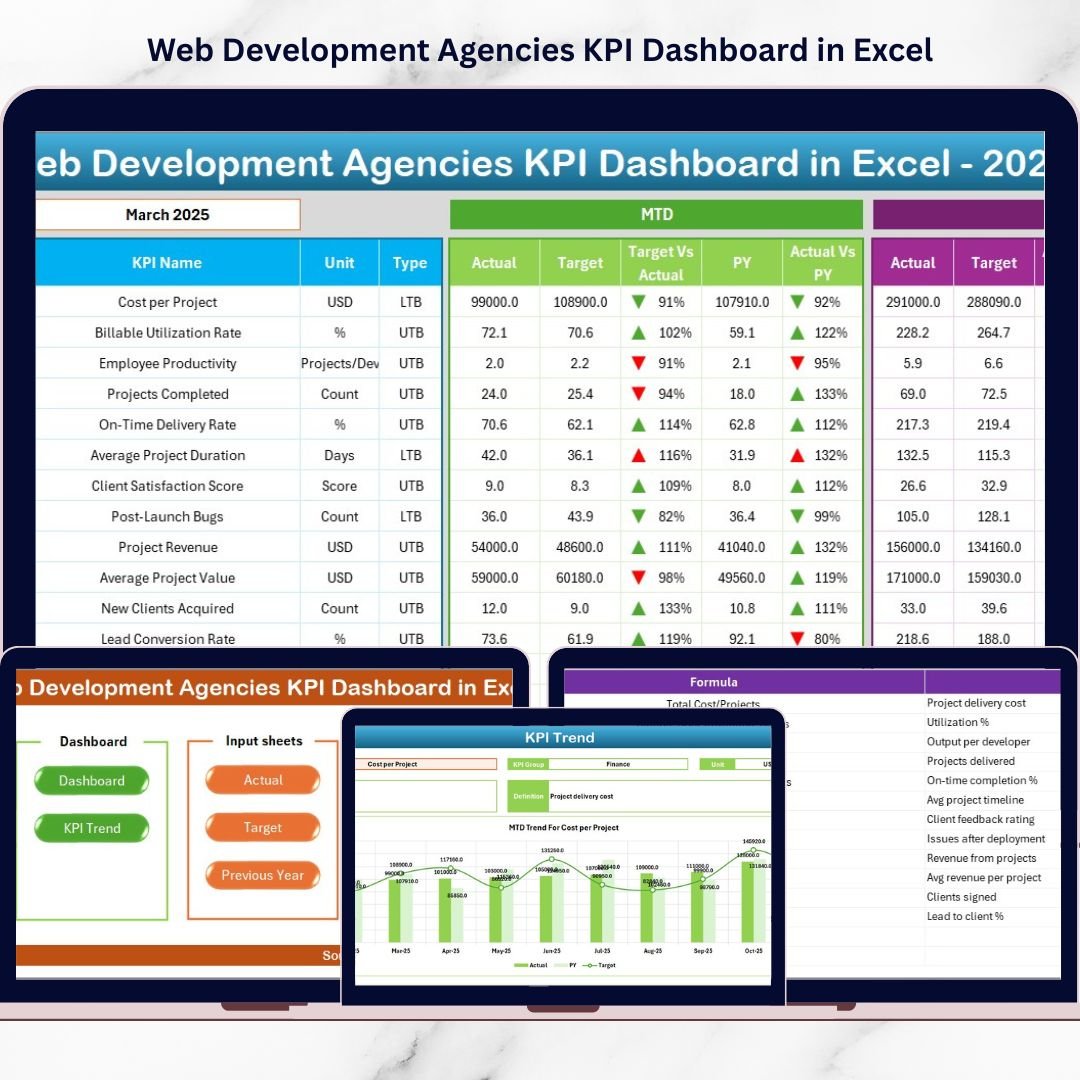
Stop guessing. Start growing.The Web Development Agencies KPI Dashboard in Excel is a powerful, ready-to-use performance management system designed specifically for digital agencies. It brings your financial, operational, and client KPIs into onecentralized, interactive dashboard — so you can make faster, smarter, and more profitable decisions.Instead of wasting hours on manual reporting, you get instant visibility into MTD, YTD, Target vs Actual, and Previous Year comparisons — all automated and structured.This dashboard is not just a reporting file. It is your agency’s growth control panel.
🔥 Key Feature of Web Development Agencies KPI Dashboard in Excel
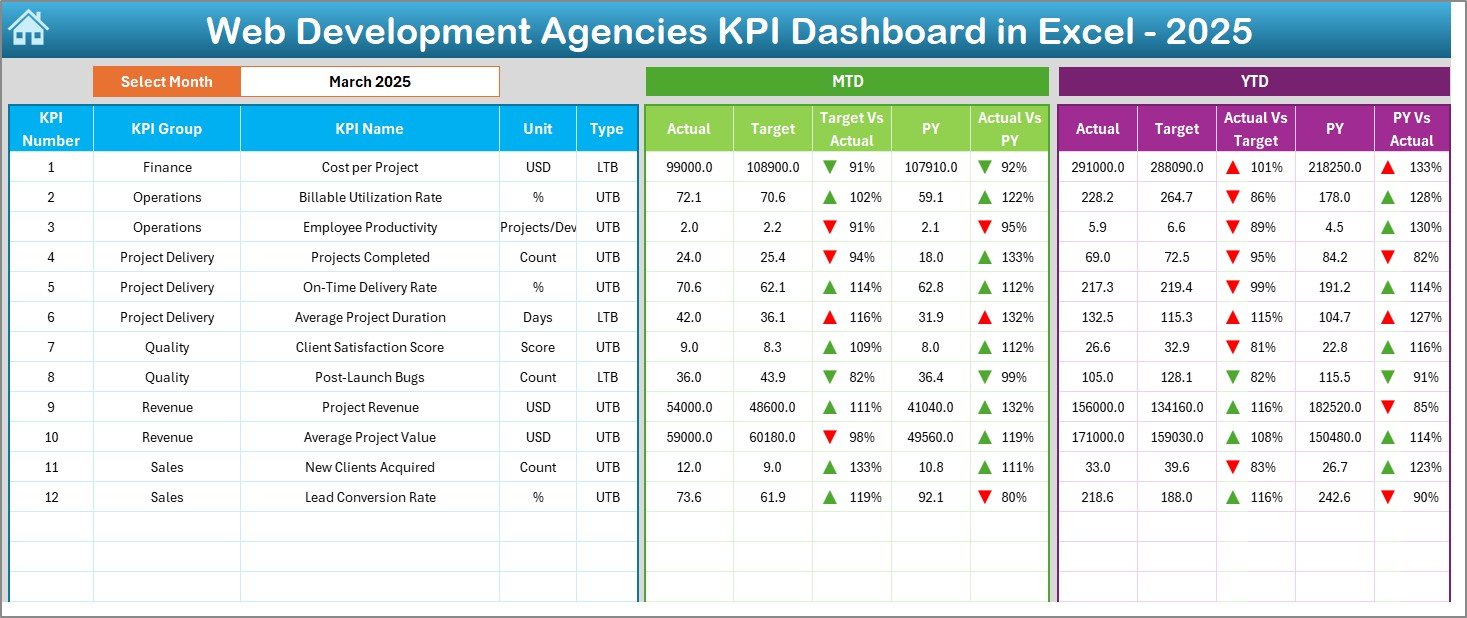
📊 Interactive Dashboard with Month Selector
Select any month from the drop-down (Cell D3), and the entire dashboard updates instantly.
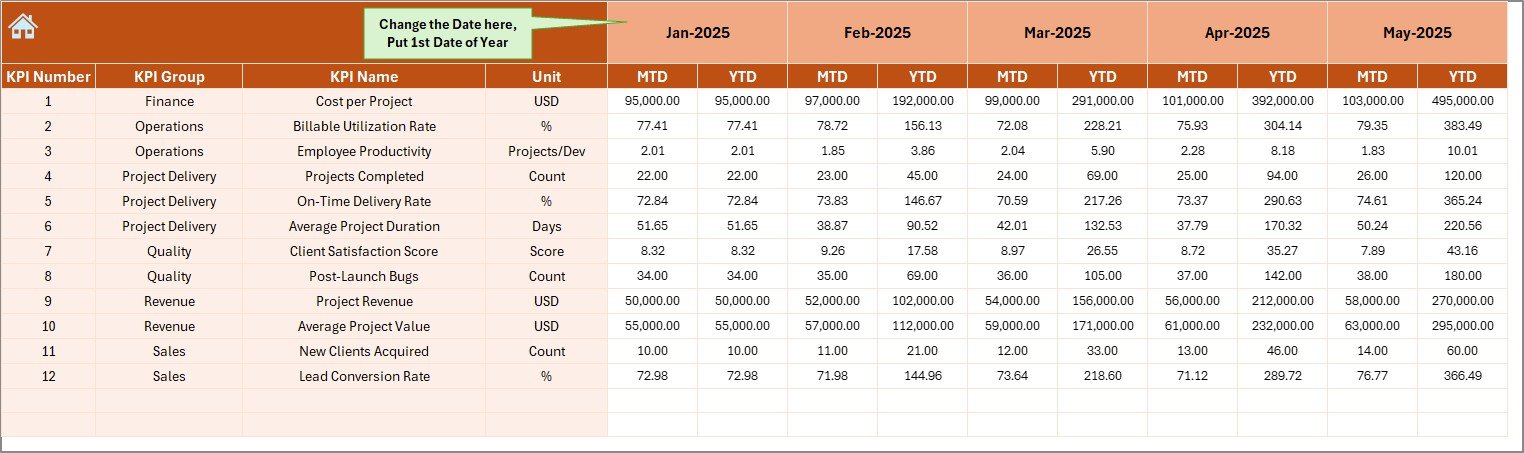
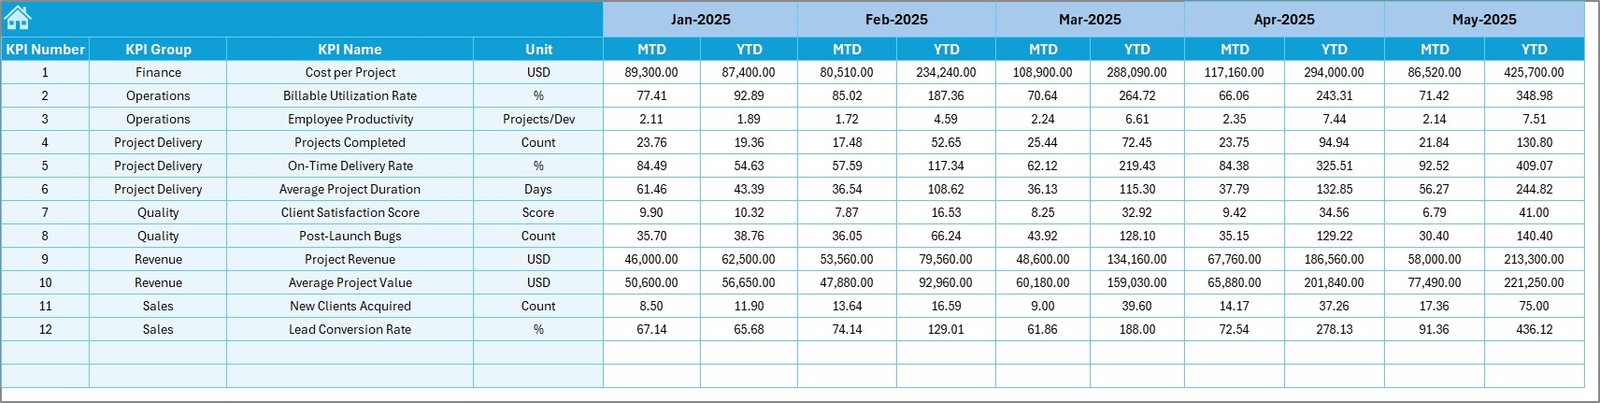
📈 MTD & YTD Performance Tracking
Monitor Month-to-Date and Year-to-Date performance with Actual, Target, and Previous Year comparisons.
🎯 Target vs Actual Analysis
Instantly identify whether KPIs are above or below expectations using visual indicators.
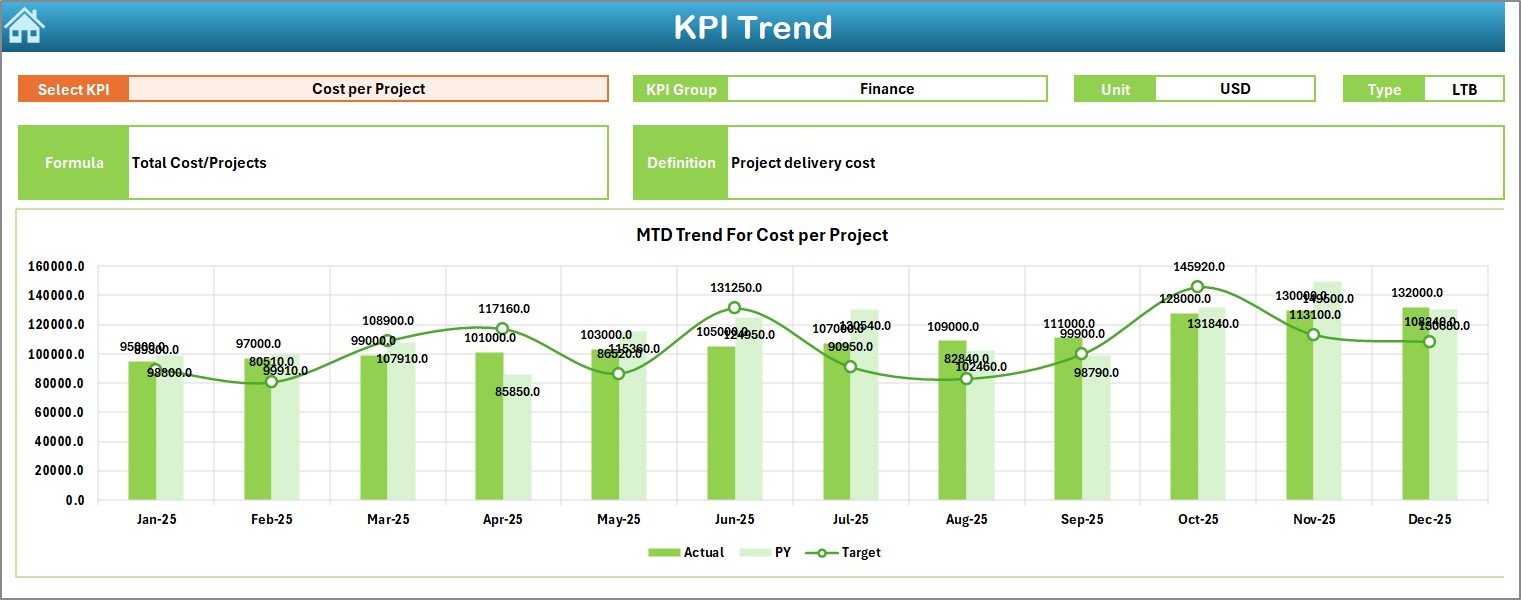
📉 Trend Analysis Charts
Track KPI movement over time with MTD and YTD trend charts.
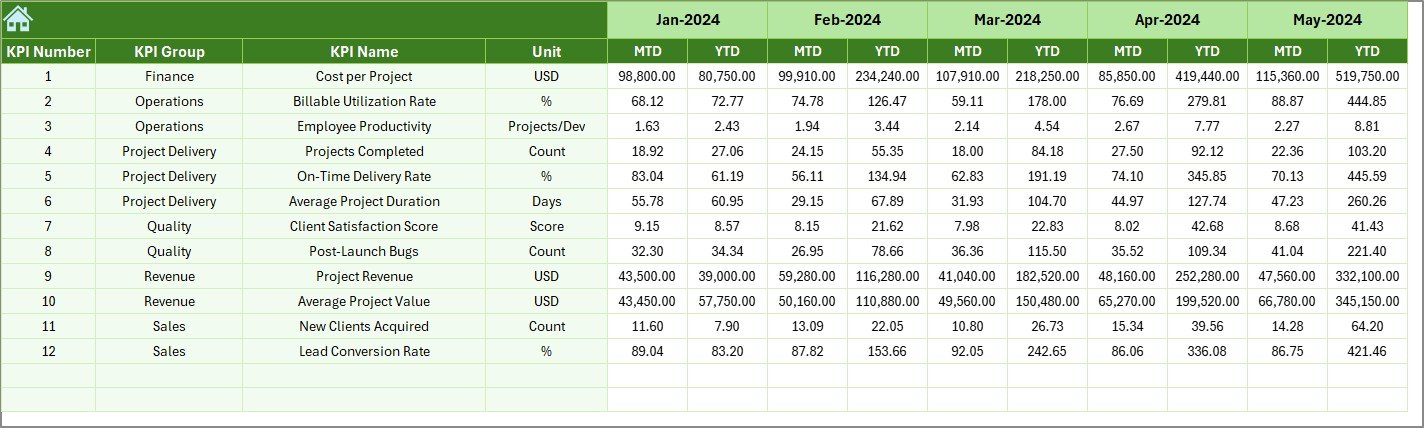
🔁 Previous Year Comparison
Measure real growth using structured year-over-year performance analysis.
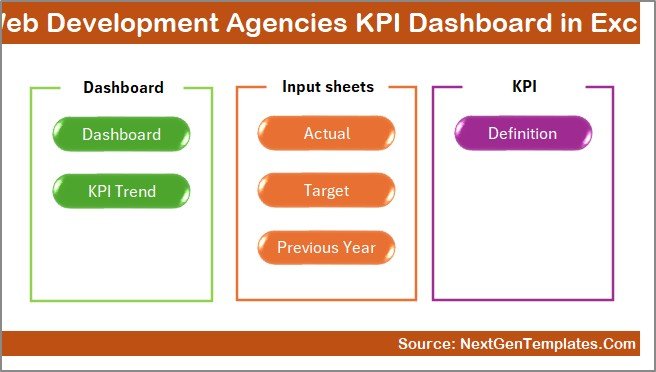
📂 7 Structured Worksheets
Summary, Dashboard, Trend, Actual Input, Target Sheet, Previous Year Sheet, and KPI Definition Sheet.
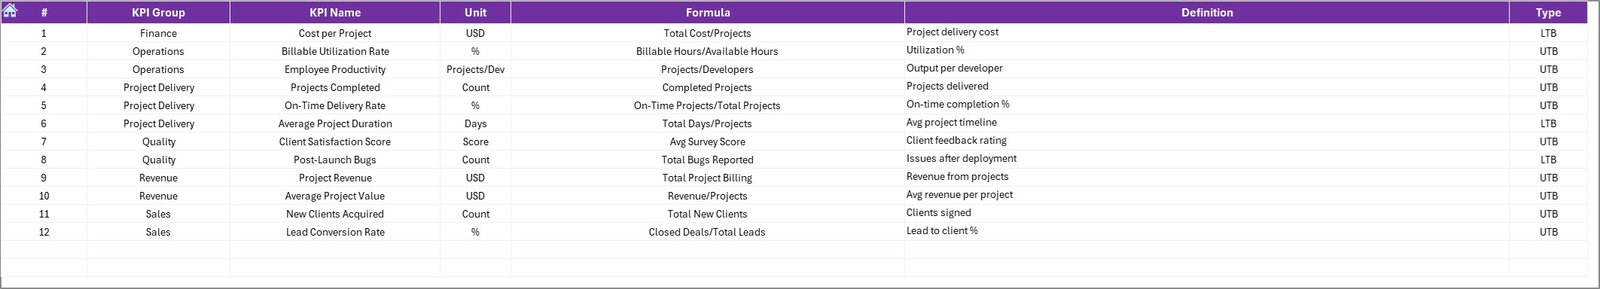
🧠 Clear KPI Definitions
Each KPI includes formula, unit, type (LTB/UTB), and description for full clarity.
📦 What’s Inside the Web Development Agencies KPI Dashboard in Excel
When you download this template, you get a complete performance management system:
✔ Summary Page – Navigation hub with quick-access buttons
✔ Main Dashboard Sheet – Visual KPI control panel
✔ Trend Sheet – Deep-dive performance analysis
✔ Actual Numbers Input Sheet – Easy data entry for MTD & YTD
✔ Target Sheet – Define monthly goals clearly
✔ Previous Year Sheet – Store last year’s performance data
✔ KPI Definition Sheet – Structured KPI documentation
You can track financial KPIs like Revenue Growth and Profit Margin, operational KPIs like On-Time Delivery and Utilization Rate, and client KPIs like Retention Rate and Satisfaction Score.
Everything is connected. Everything updates automatically.
🛠 How to Use the Web Development Agencies KPI Dashboard in Excel
Using this dashboard is simple:
1️⃣ Enter KPI definitions
2️⃣ Input previous year numbers
3️⃣ Set monthly targets
4️⃣ Enter actual performance data
5️⃣ Select the month from the drop-down
6️⃣ Review MTD & YTD comparisons
7️⃣ Analyze trend charts
That’s it.
No complex setup. No advanced Excel skills required.
The structure handles the calculations. You focus on decisions.
🎯 Who Can Benefit from This Web Development Agencies KPI Dashboard in Excel
This dashboard is ideal for:
💼 Agency Founders
📊 Operations Managers
💰 Finance Teams
🧑💻 Project Managers
📈 Business Development Leaders
Whether you manage 5 developers or 100+, this dashboard gives you clarity and control.
If you want to:
✔ Improve profit margins
✔ Increase billable utilization
✔ Reduce client churn
✔ Monitor project delivery
✔ Scale strategically
Then this dashboard is built for you.
Growth depends on visibility. When you track billable utilization, client retention, delivery rate, and profit margins together, you stop reacting and start leading.
This Excel KPI Dashboard transforms scattered data into actionable insights. It reduces reporting time. It improves accountability. It helps you scale confidently.
Your competitors are moving fast. The question is — are you tracking fast enough?
Click here to read the Detailed blog post
Watch the step-by-step video tutorial:


