Managing wealth becomes easier and more accurate when every investment, every contribution, and every performance metric shows up on a single screen. Yet most individuals, investment advisors, and wealth managers juggle multiple sheets, scattered reports, and manual calculations. This leads to confusion, delayed decisions, and missed growth opportunities. To solve this problem, we created the Wealth Management Dashboard in Excel — a simple, interactive, and powerful tool that makes wealth tracking effortless.
This ready-to-use dashboard converts complex data into clean visuals, charts, and KPIs. You can track AUM, contribution trends, portfolio diversification, high-risk exposure, advisor-wise performance, and investment category insights instantly. Excel’s dynamic formulas, slicers, and pivot visuals make navigation smooth—even for users with basic Excel knowledge.
Whether you’re an individual investor, a financial advisor, or a wealth management firm, this dashboard becomes your go-to tool for financial planning, risk analysis, and long-term growth visualization.
✨ Key Features of the Wealth Management Dashboard in Excel
📌 Five Analytical Pages
You get five pages: Overview, Investment Analysis, Portfolio Category Analysis, Advisor Name Analysis, and Month Analysis. Each one focuses on a different aspect of wealth performance.
📌 Page Navigator
A left-side navigation menu allows you to move between pages instantly. No scrolling, no searching, no confusion — just seamless navigation.
📌 Interactive Slicers
Use slicers to filter by Month, Investment Type, Portfolio Category, Advisor Name, or City. With one click, every chart updates automatically.
📌 Automated Charts & KPIs
Once you update the Data Sheet, all visuals refresh instantly. This makes financial tracking faster, cleaner, and far more reliable.
📦 What’s Inside the Wealth Management Dashboard
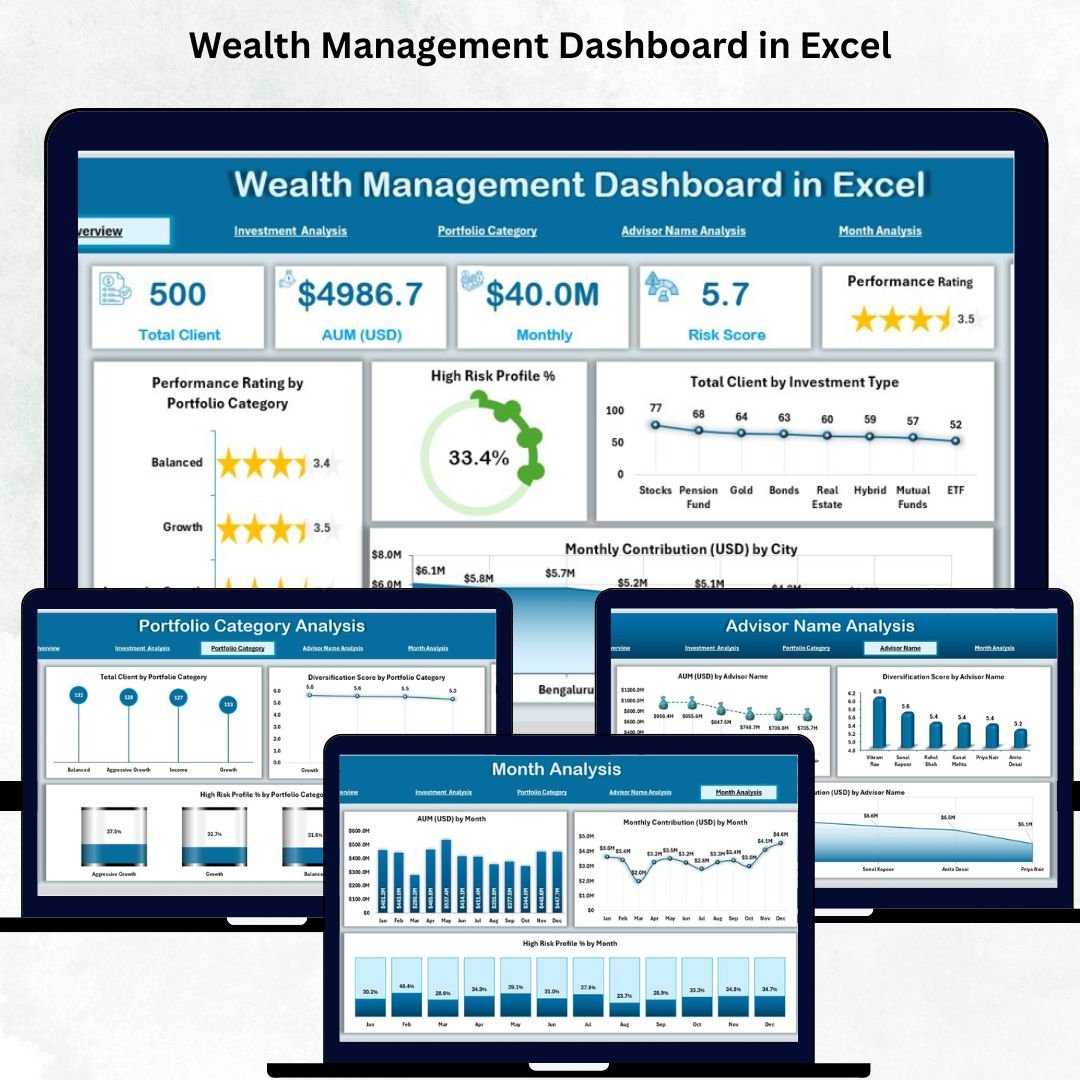
🏠 1. Overview Page – The Full Wealth Snapshot
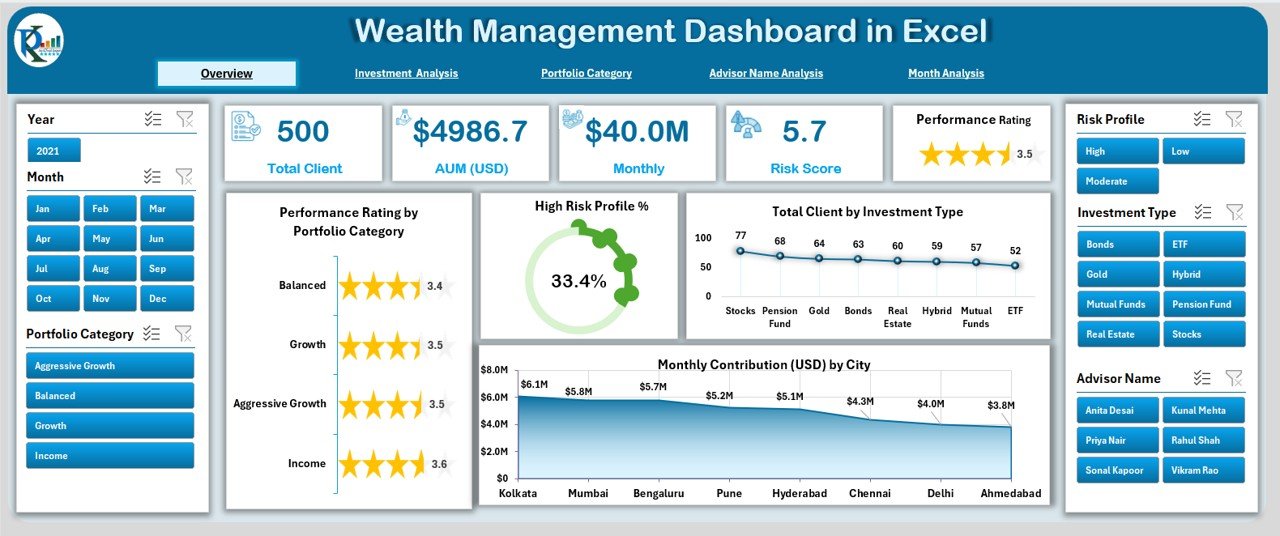
This page gives a high-level summary of overall financial performance.
You will see:
🔹 Five KPI Cards:
-
Total Clients
-
Total AUM
-
High-Risk Portfolio %
-
Total Investment Types
-
Contribution Summary
🔹 Four Powerful Charts:
-
Performance Rating by Portfolio Category
-
High-Risk Profile (%)
-
Total Clients by Investment Type
-
Monthly Contribution (USD) by City
This page gives you instant clarity on portfolio health and client distribution.
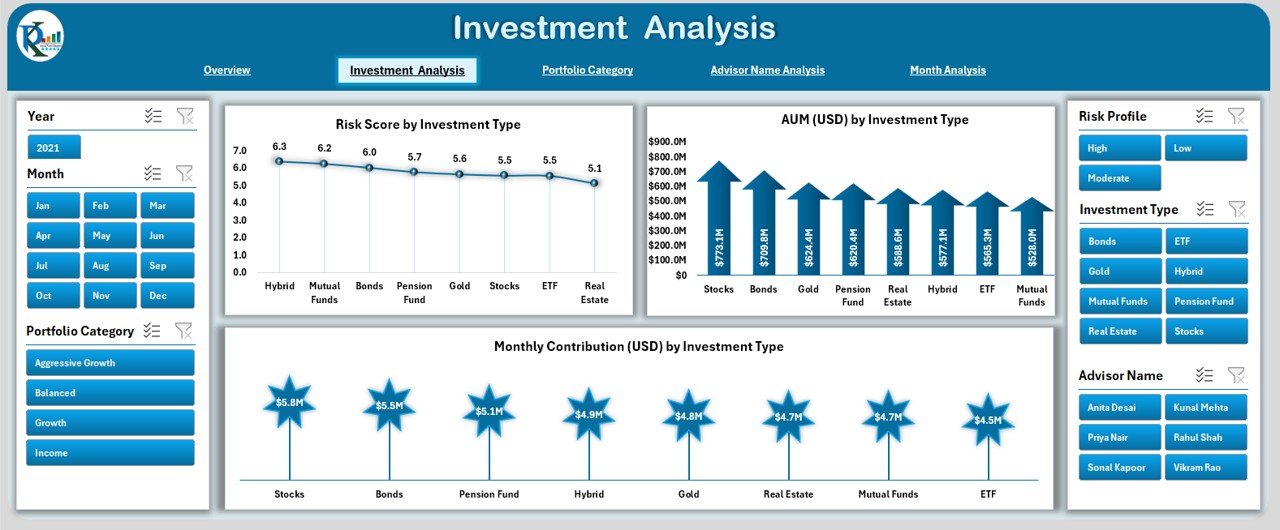
💰 2. Investment Analysis Page – Track Investment Type Performance
Perfect for reviewing category-wise performance.
You get:
-
Risk Score by Investment Type
-
AUM (USD) by Investment Type
-
Monthly Contribution (USD) by Investment Type
These insights help identify high-performing investment categories and areas needing rebalancing.
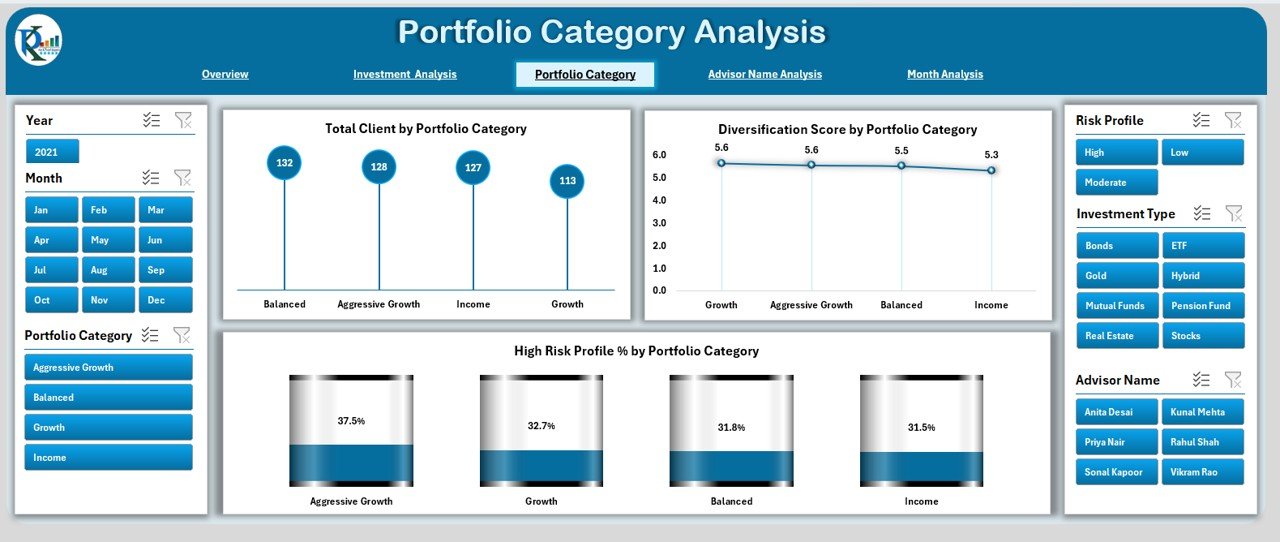
📂 3. Portfolio Category Analysis Page – Understand Portfolio-Level Insights
This page highlights:
-
Total Clients by Portfolio Category
-
Diversification Score
-
High-Risk Profile %
You can quickly find out which categories offer stability, diversity, or higher risk.
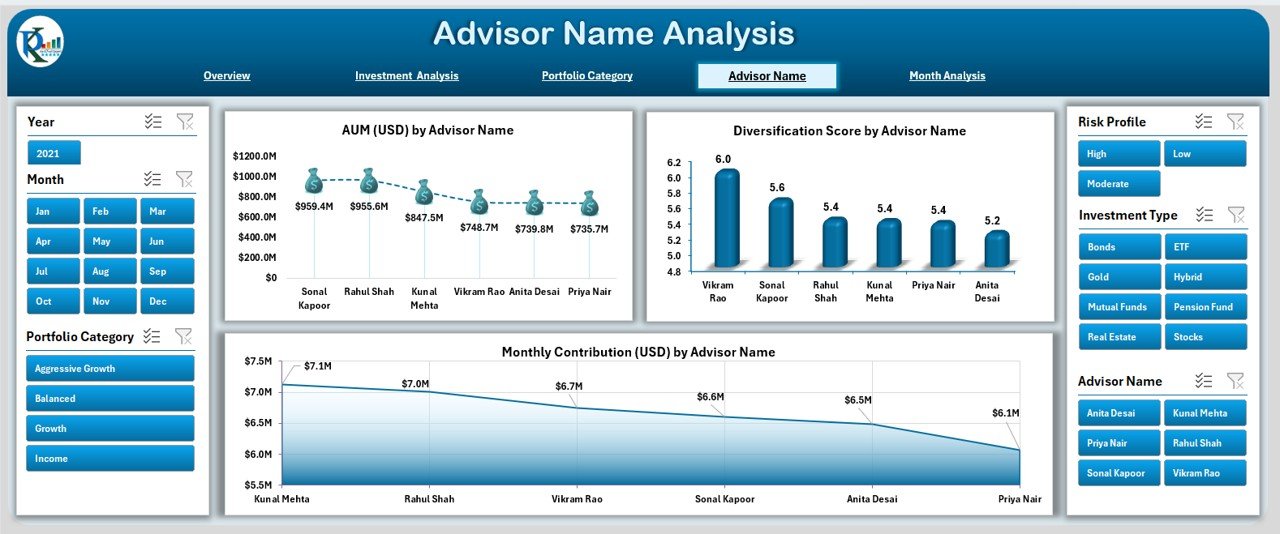
👨💼 4. Advisor Name Analysis Page – Compare Advisor Performance Easily
Advisor performance has a huge impact on overall wealth management.
This page includes:
-
AUM (USD) by Advisor
-
Diversification Score by Advisor
-
Monthly Contribution (USD) by Advisor
It’s perfect for reviewing advisor efficiency, contribution strength, and client portfolio quality.
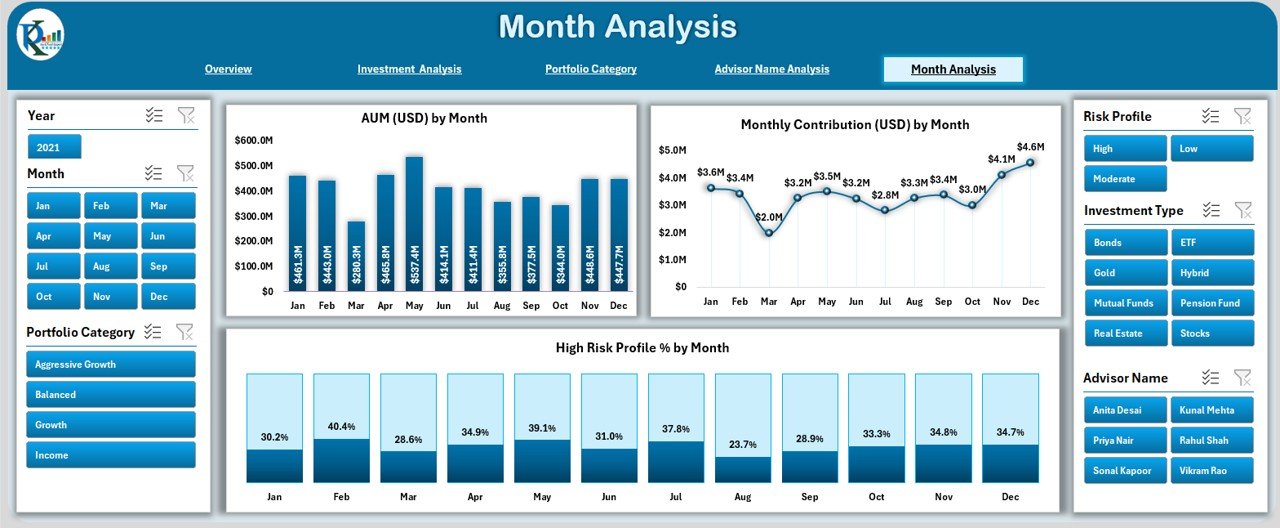
📅 5. Month Analysis Page – Identify Monthly & Seasonal Trends
Track how wealth performance changes month by month.
Charts include:
-
AUM (USD) by Month
-
Monthly Contribution (USD) by Month
-
High-Risk Profile (%) by Month
These visuals help with planning, forecasting, and understanding contribution cycles.
📊 Supporting Sheets
📁 Data Sheet
This is where you enter:
-
Client Name
-
Advisor Name
-
Investment Type
-
Portfolio Category
-
Contribution
-
AUM
-
Diversification Score
-
Risk Score
-
Location
-
High-Risk Flag
-
Month & Year
Update this sheet — the rest happens automatically!
🎯 Who Can Benefit from This Dashboard
-
Wealth Managers
-
Financial Advisors
-
Investment Analysts
-
Portfolio Managers
-
Private Clients
-
Financial Planning Teams
Anyone who needs fast, visual, and reliable wealth insights will benefit from this dashboard.
### Click hare to read the Detailed blog post
Visit our YouTube channel to learn step-by-step video tutorials
👉 Youtube.com/@PKAnExcelExpert


Reviews
There are no reviews yet.