Are you struggling to monitor water supply performance across multiple spreadsheets? Finding it difficult to track KPIs, reduce water loss, and improve operational efficiency?
Water Supply KPI Scorecard in Google Sheets!
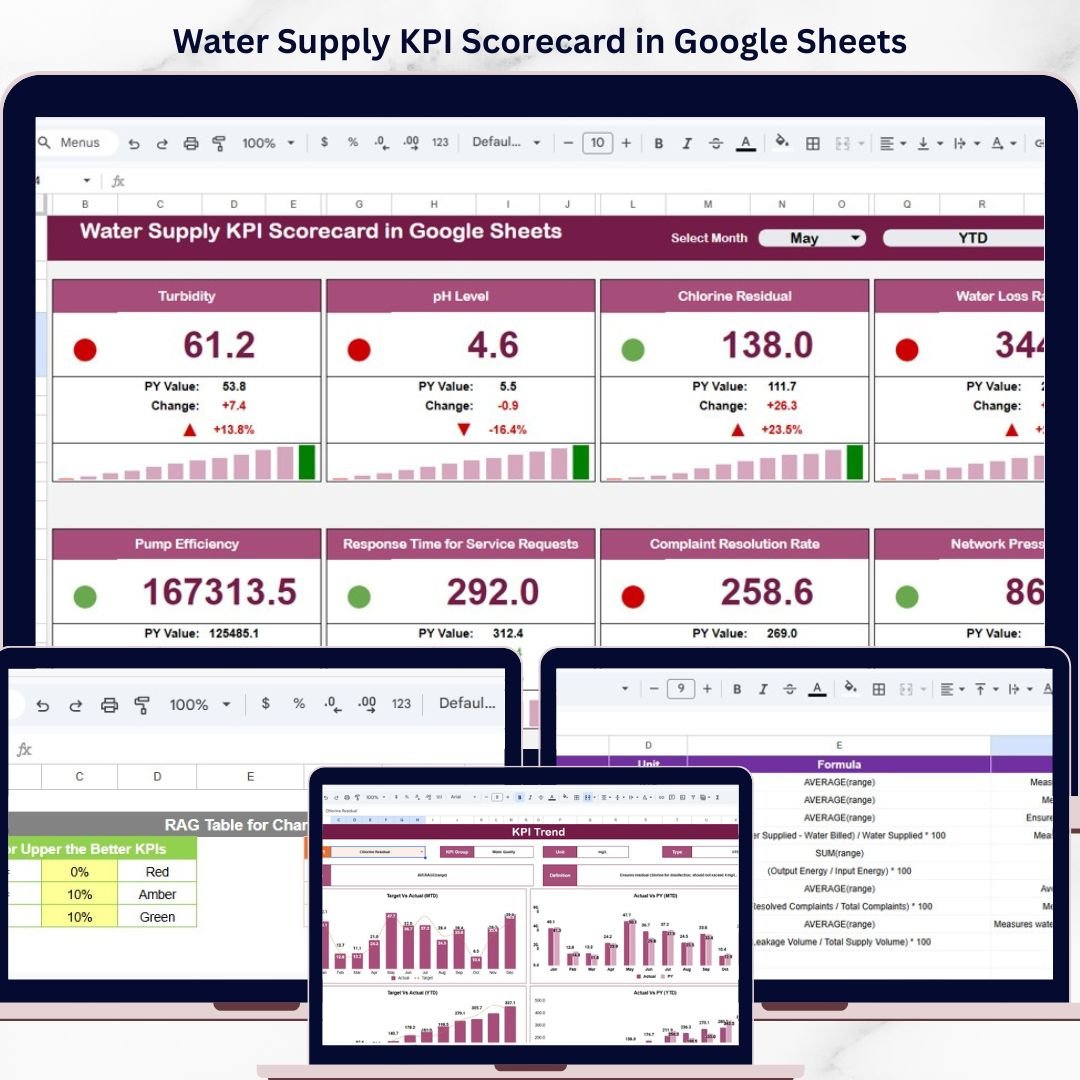
This powerful, ready-to-use Google Sheets scorecard is designed for water utilities, municipal authorities, and infrastructure teams who want to track and optimize performance with ease. Instead of dealing with scattered data and manual reporting, this scorecard centralizes all your key performance indicators (KPIs) into one interactive and visually engaging platform.
With smart visual indicators like traffic lights, arrows, and percentage comparisons, you can instantly understand performance levels and identify areas that need improvement. As a result, you can make faster, data-driven decisions that enhance service quality and reduce operational inefficiencies.
🔑 Key Features of Water Supply KPI Scorecard in Google Sheets
✨ 💧 Real-Time KPI Monitoring – Track water distribution performance with up-to-date KPI metrics.
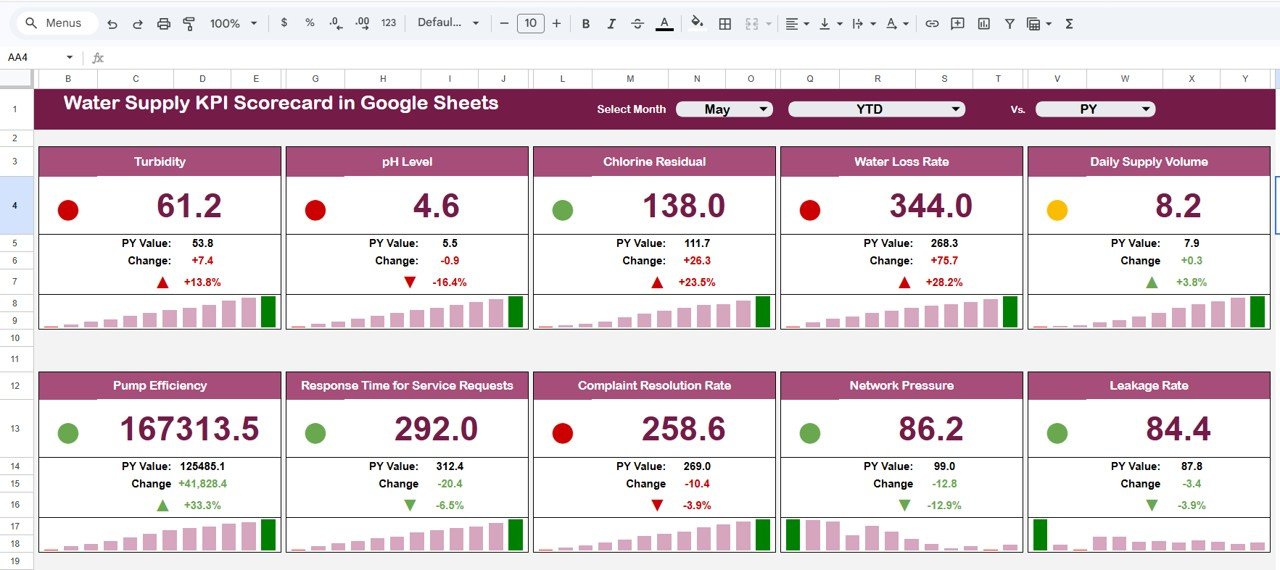
✨ 🚦 Traffic Light Indicators – Instantly identify performance levels with green, yellow, and red signals.
✨ 🔺🔻 Performance Arrows – Visual indicators show improvements or declines in KPI values.
✨ 🎯 Target vs Actual Comparison – Compare actual performance against targets with percentage variance.
✨ 📊 MTD & YTD Toggle View – Switch between monthly and yearly KPI performance instantly.
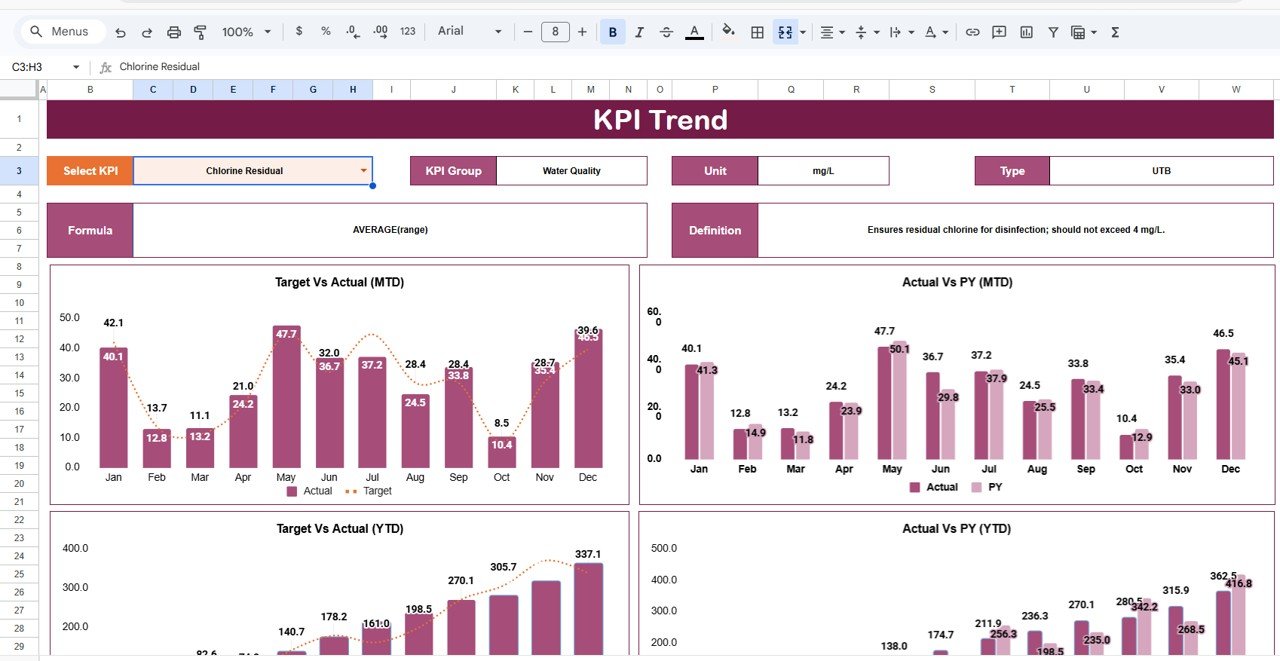
✨ 📈 Trend Analysis Sheet – Analyze KPI trends over time to identify patterns and improvements.
✨ ☁️ Cloud-Based Accessibility – Access your scorecard anytime, anywhere using Google Sheets.
📂 What’s Inside the Water Supply KPI Scorecard in Google Sheets
📁 Monthly KPI Scorecard Sheet – Main dashboard displaying 10 KPIs with traffic light indicators and performance arrows.
📁 Trend Analysis Sheet – Analyze KPI performance trends with dropdown-based KPI selection.
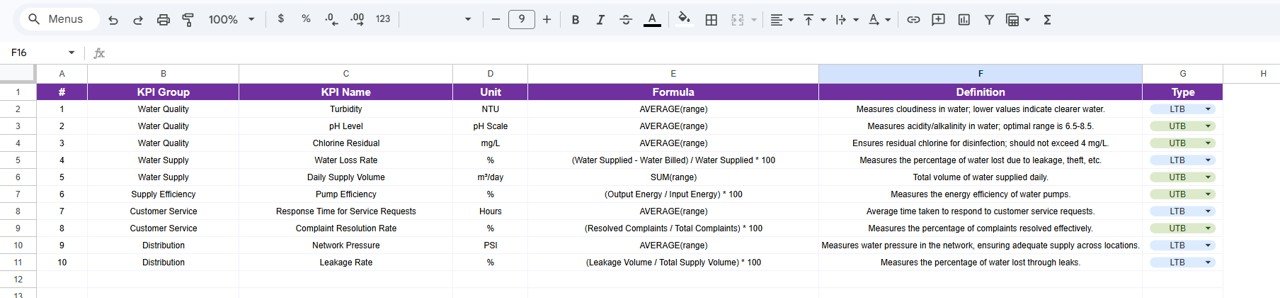
📁 KPI Definition Sheet – Detailed explanation of KPI names, formulas, groups, and units.
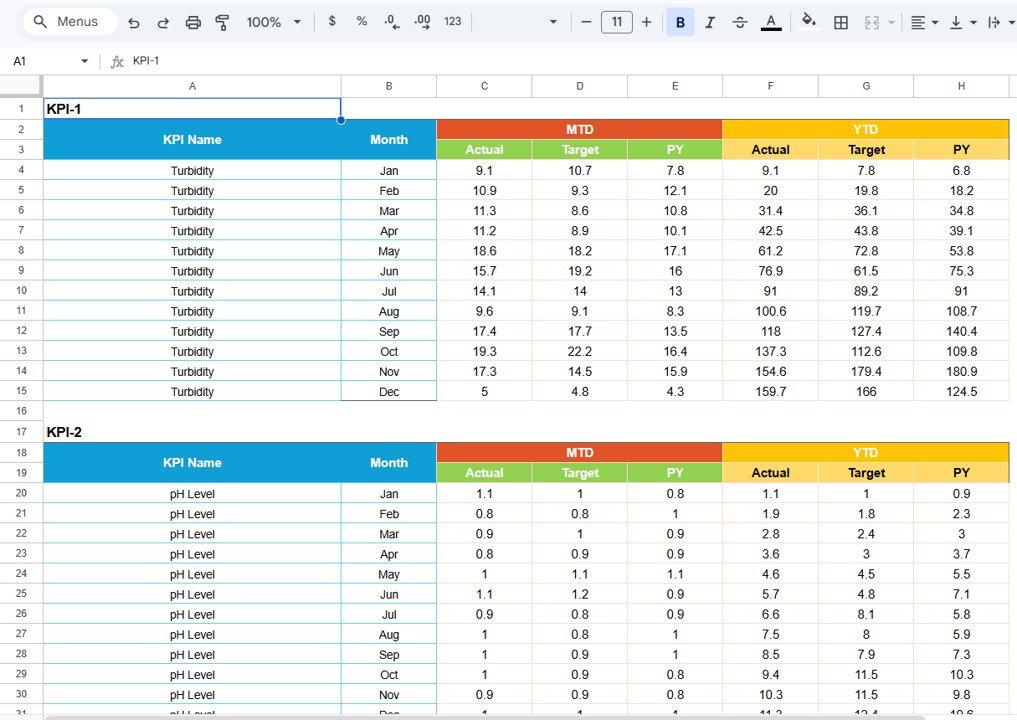
📁 Data Input Sheet – Enter MTD and YTD KPI values for accurate tracking.
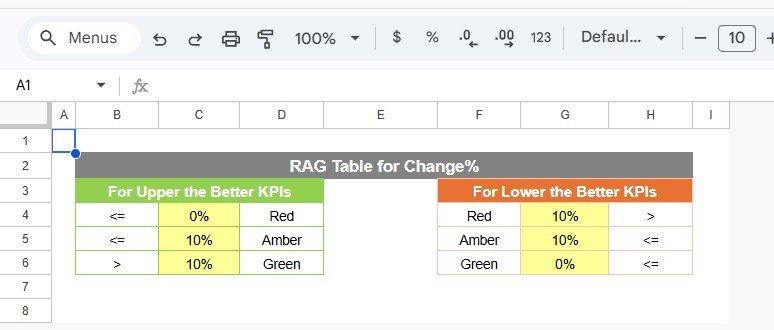
📁 Color Settings Section – Customize thresholds, traffic lights, and performance indicators.
📁 Automated Visual System – All indicators update automatically based on your data input.
🛠️ How to Use the Water Supply KPI Scorecard in Google Sheets
👉 Step 1: Enter KPI data into the Data Input sheet
👉 Step 2: Define KPI thresholds in the Color Settings section
👉 Step 3: Select the desired month from the dropdown
👉 Step 4: Toggle between MTD and YTD views
👉 Step 5: Analyze performance using traffic lights and trend charts
💡 No advanced technical skills required—simple, visual, and powerful!
👥 Who Can Benefit from This Water Supply KPI Scorecard in Google Sheets
✔️ Water Utility Companies – Monitor supply performance and reduce water loss
✔️ Municipal Authorities – Improve service delivery and operational efficiency
✔️ Infrastructure Managers – Track KPIs and optimize resource usage
✔️ Data Analysts – Analyze trends and generate actionable insights
✔️ Environmental Agencies – Ensure sustainable water management
This scorecard is more than just a reporting tool—it’s a complete performance management solution for water supply systems. It helps you track KPIs visually, identify inefficiencies quickly, and improve overall operations with confidence.
If you want to enhance water distribution efficiency, reduce wastage, and make smarter decisions, this scorecard is the perfect choice.