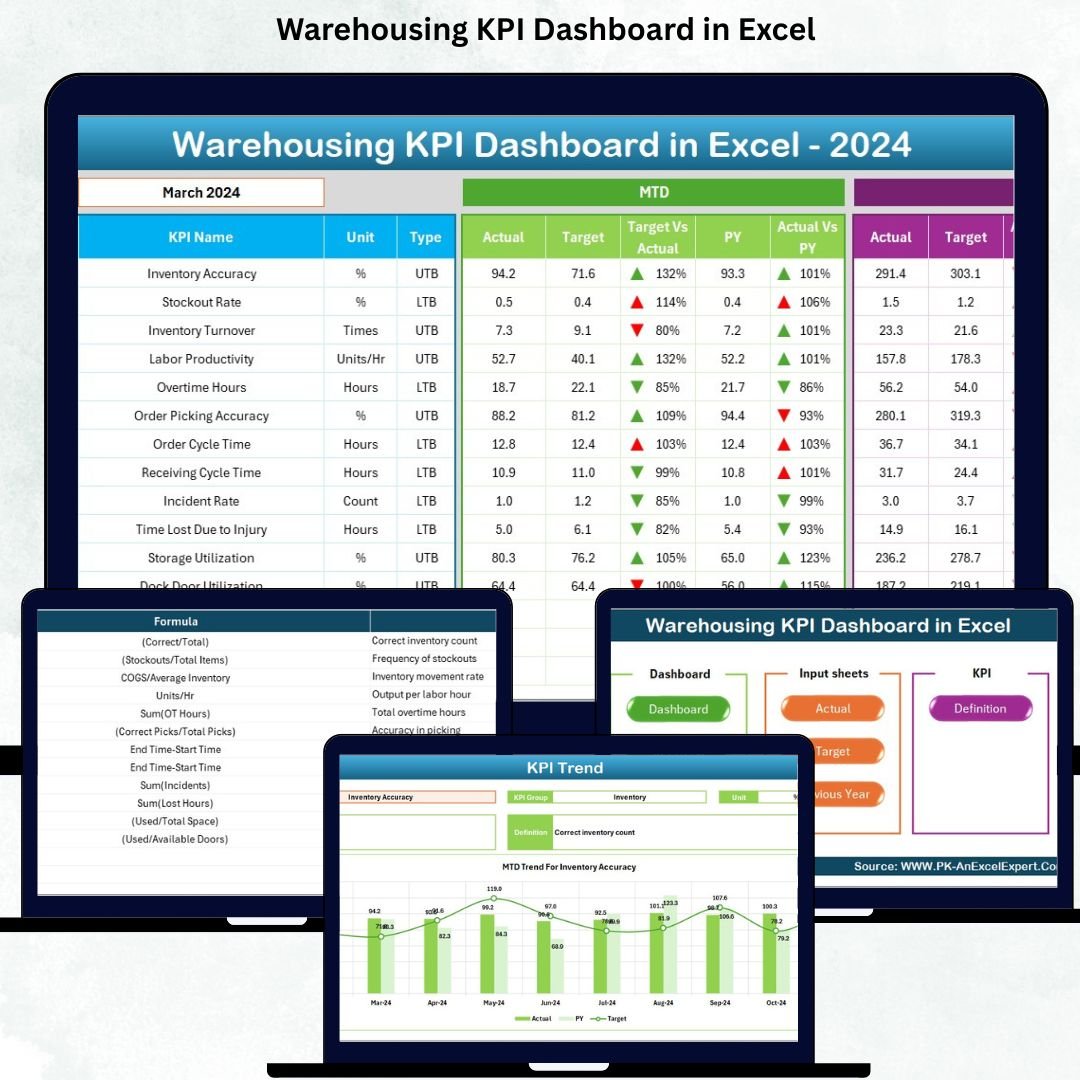
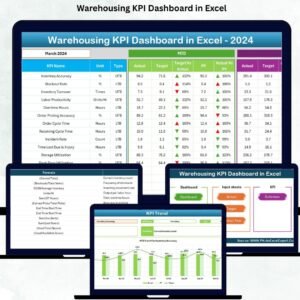
Managing warehouse performance becomes easy when you have a clear, organized, and interactive dashboard that shows exactly how well your operations are running. The Warehousing KPI Dashboard in Excel is designed to give warehouse managers instant visibility into their most important KPIs—without using complex software or wasting hours on manual reporting. Whether you want to track inventory accuracy, picking performance, on-time shipments, or operational efficiency, this dashboard brings everything together in one beautifully structured Excel file.
This all-in-one template is perfect for warehouse teams looking to improve accuracy, speed up decision-making, minimize errors, and monitor daily, monthly, and yearly performance. With built-in MTD, YTD, and Previous Year comparisons, every metric becomes easy to understand at a glance. Designed for real-world operations, this dashboard helps warehouse managers stay organized, reduce delays, and keep productivity high.
✨ Key Features of the Warehousing KPI Dashboard in Excel
The Warehousing KPI Dashboard in Excel includes all the tools you need to measure performance accurately and efficiently. Each worksheet is pre-designed with formulas, formatting, and automation so you can start using the dashboard instantly—no coding, no advanced Excel skills needed.
⭐ ✔ Smart Navigation with Summary Page
Jump between sheets using six quick-access buttons and navigate the entire dashboard effortlessly.
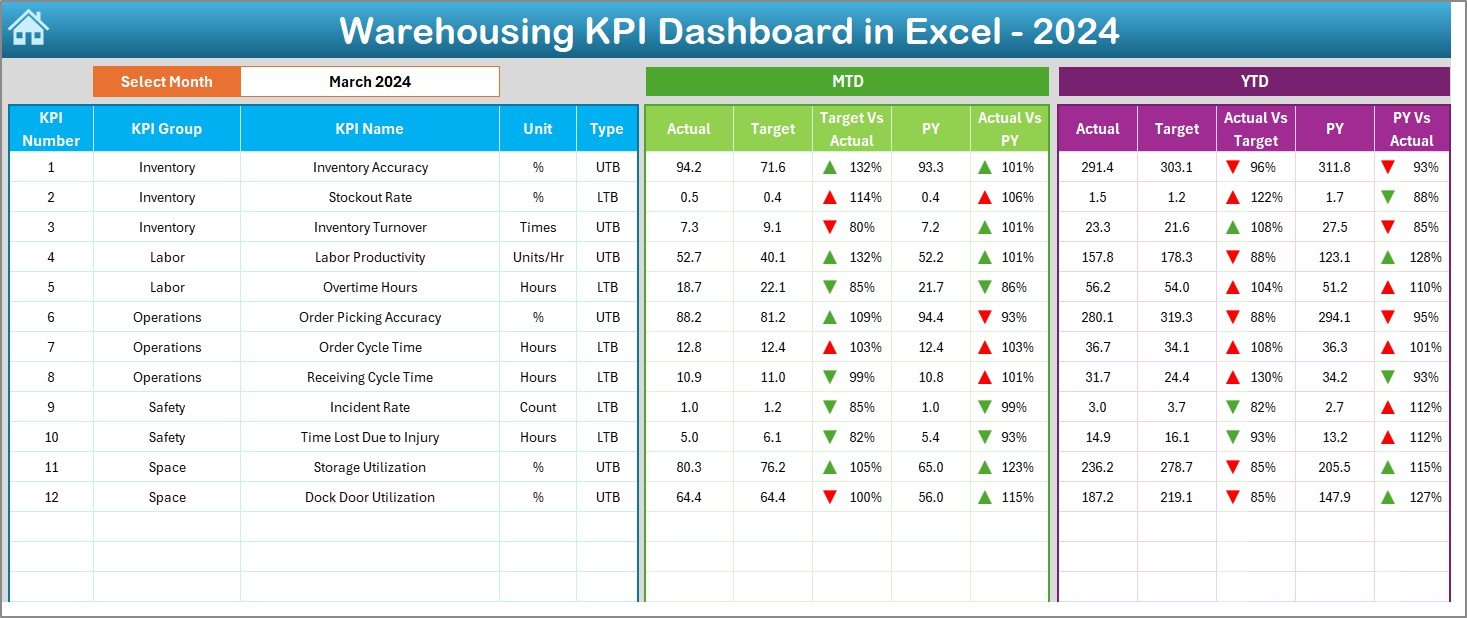
⭐ ✔ Fully Automated Dashboard Page
Track MTD & YTD Actual, Target, Previous Year, and performance gaps with color-coded arrows for instant visibility.
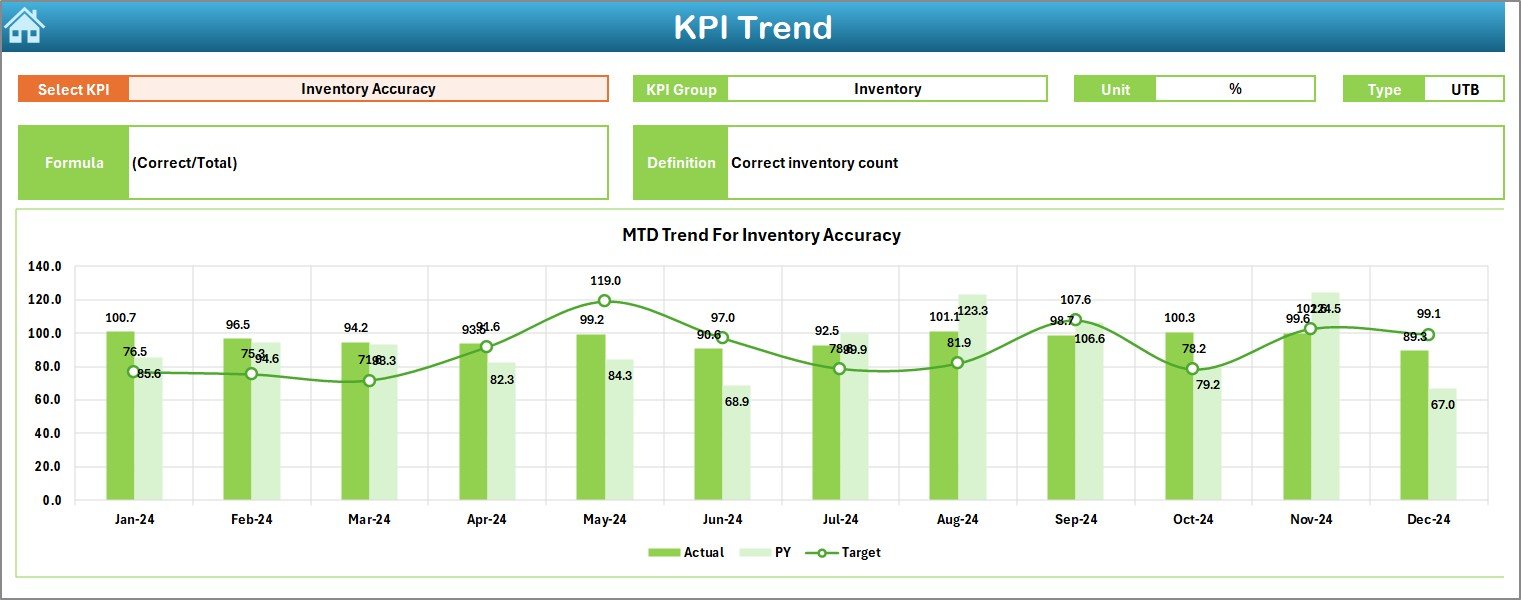
⭐ ✔ Trend Analysis Charts
Understand performance patterns over time with interactive MTD and YTD charts.
⭐ ✔ Separate Sheets for Actual, Target & Previous Year Data
Keep your data organized and update numbers in seconds.
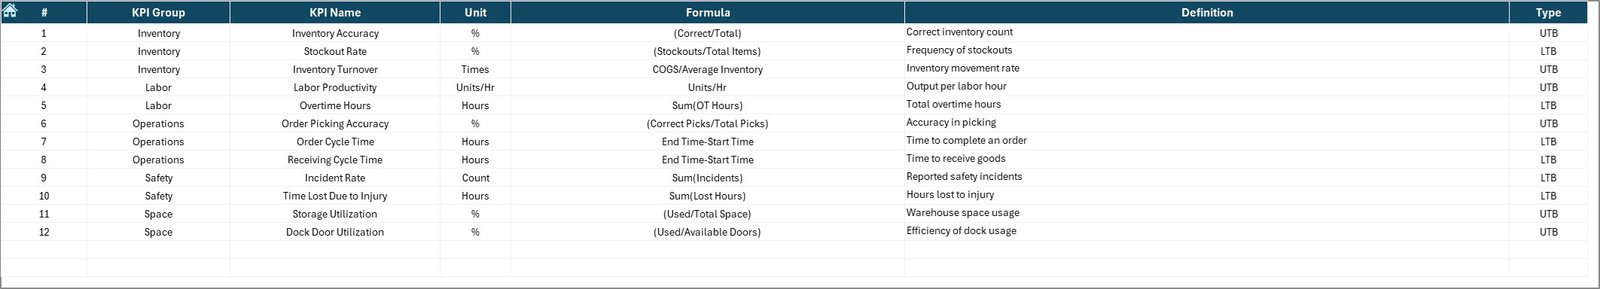
⭐ ✔ Complete KPI Definition Sheet
View KPI group, unit, formula, definition, and type (UTB / LTB) to ensure everyone interprets KPIs the same way.
⭐ ✔ 100% Editable & Customizable
Add new KPIs, modify headers, or update company-specific parameters any time.
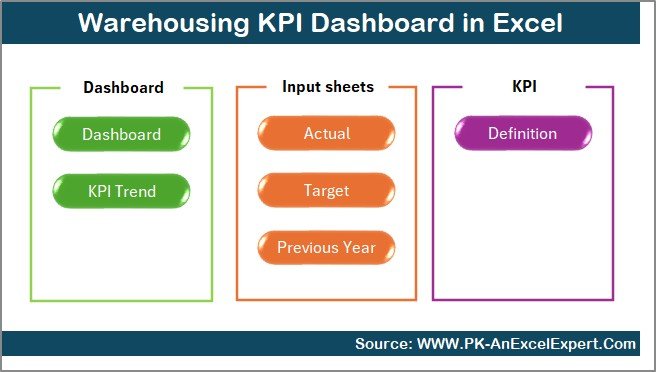
📦 What’s Inside the Warehousing KPI Dashboard in Excel
Inside this ready-to-use Excel file, you get seven fully structured sheets designed for smooth warehouse performance tracking:
📌 1. Summary Page
A clean navigation panel with clickable buttons for easy access.
📌 2. Dashboard Page
Your main KPI monitoring page with automated calculations and visual performance highlights.
📌 3. Trend Sheet
Offers detailed charts to analyze KPI performance throughout the year.
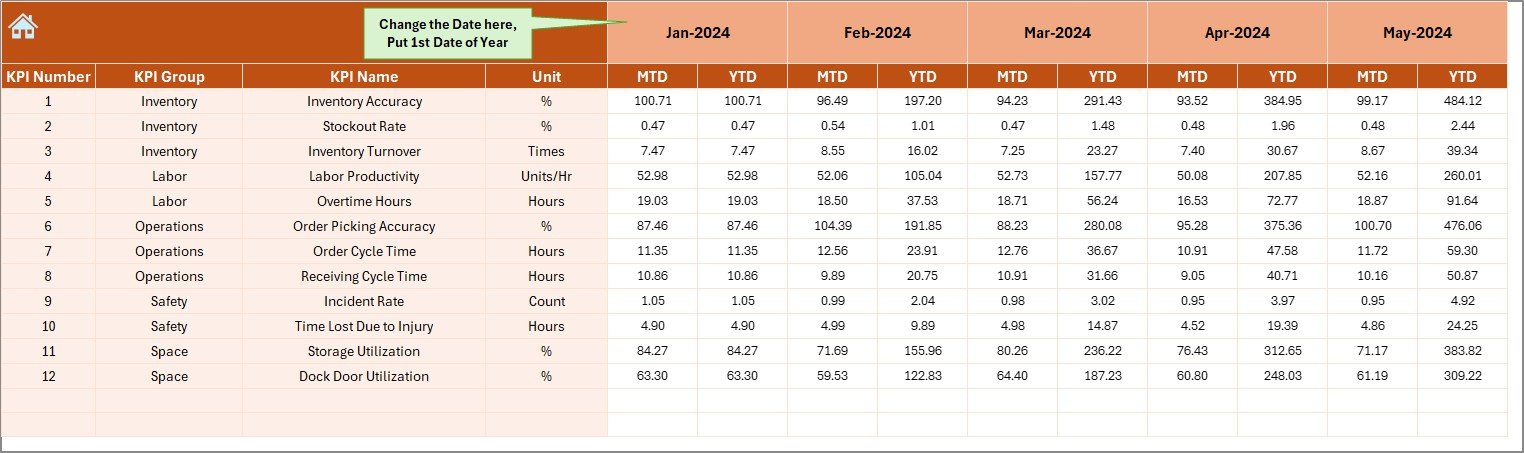
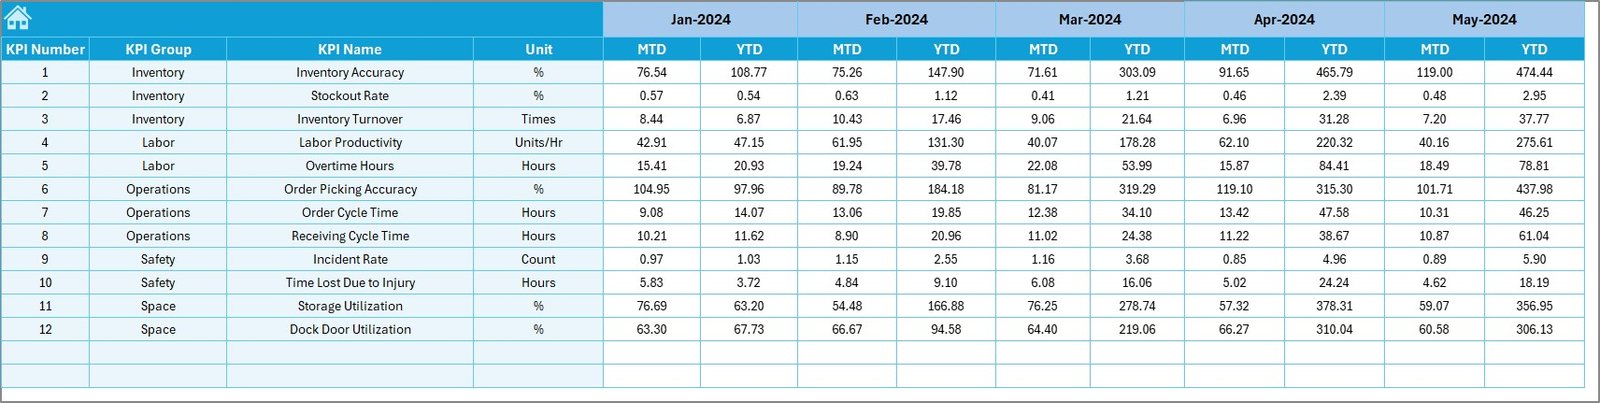
📌 4. Actual Numbers Input Sheet
Enter your latest monthly values—everything updates instantly.
📌 5. Target Sheet
Set MTD and YTD performance targets for every KPI.
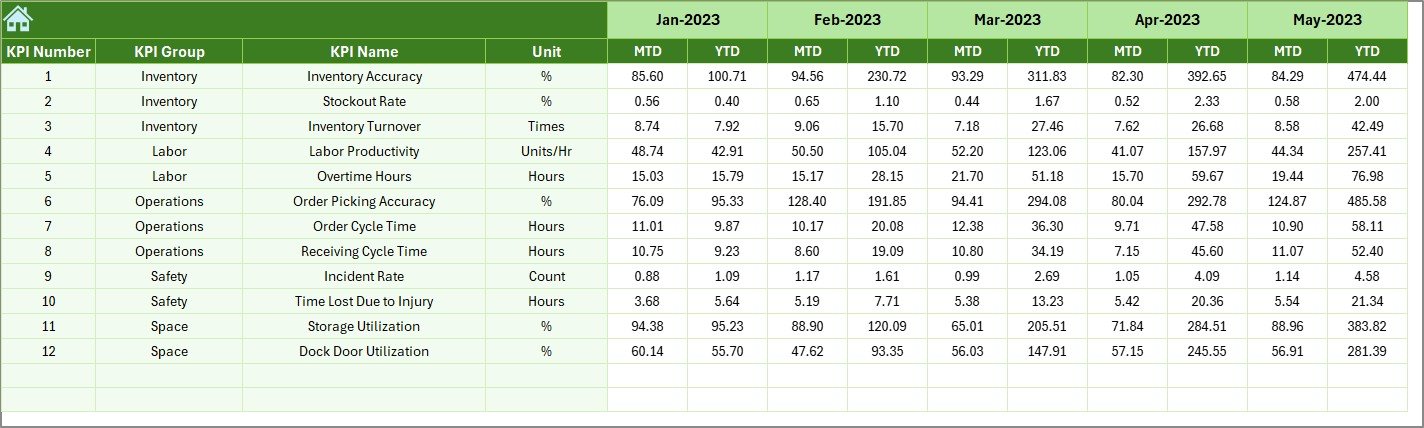
📌 6. Previous Year Numbers Sheet
Compare your progress with last year’s performance.
📌 7. KPI Definition Sheet
A clear reference sheet that explains each KPI in simple terms.
Everything is pre-designed, structured, and optimized for warehouse operations. Simply add your data and start analyzing immediately.
🛠 How to Use the Warehousing KPI Dashboard in Excel
Using this dashboard is incredibly simple—even for beginners:
🔹 Step 1: Enter Actual Values
Update MTD & YTD numbers in the Actual Numbers sheet every month.
🔹 Step 2: Set Monthly Targets
Add your KPI goals in the Target Sheet.
🔹 Step 3: Provide Previous Year Values
Fill in last year’s performance to enable year-over-year comparison.
🔹 Step 4: Select Month from Dropdown
Choose any month from the Dashboard page and watch all visuals update instantly.
🔹 Step 5: Review Trends & Performance Gaps
Use trend charts and comparison indicators to understand what needs improvement.
That’s it—your entire warehouse performance reporting becomes automated and effortless.
👥 Who Can Benefit from This Warehousing KPI Dashboard in Excel
This dashboard is perfect for:
👨💼 Warehouse Managers
Monitor operations, reduce delays, and improve accuracy.
📦 Inventory & Logistics Teams
Track stock levels, picking performance, and shipment accuracy.
🏭 Operations & Supply Chain Professionals
Get real-time updates for planning and decision-making.
🧑💻 Business Analysts
Analyze trends and generate performance reports quickly.
🚚 3PL Companies & Distribution Centers
Streamline workflow and track KPIs across multiple sites.
If your warehouse handles inventory, orders, shipments, or workforce tasks—this dashboard is exactly what you need.
### Click Here to Read the Detailed Blog Post
Watch the step-by-step video tutorial:


Reviews
There are no reviews yet.