


Managing a venture capital fund becomes more efficient when all your critical KPIs are organized in one intelligent Excel dashboard. The Venture Capital KPI Dashboard in Excel is a powerful, ready-to-use performance management system designed to help investors, fund managers, and analysts monitor portfolio companies with clarity and precision. Whether you track multiple startups, multiple funding rounds, or diverse business models, this dashboard turns raw data into meaningful insights—instantly.
Built using Excel’s advanced formulas, slicers, trend charts, and conditional formatting, this tool gives you a smooth and interactive experience without needing expensive BI software. With real-time updates, intuitive sheets, and structured navigation, your entire KPI ecosystem becomes easy to understand and even easier to manage.Venture Capital KPI Dashboard in Excel
Let’s dive into everything this premium Excel dashboard offers.
✨ Key Features of Venture Capital KPI Dashboard in Excel
📊 Smart Navigation System
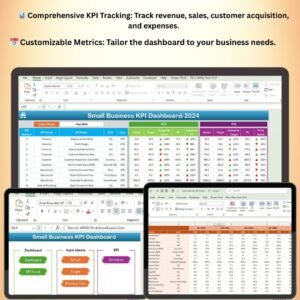
The Summary Page includes six clickable buttons that take you directly to each sheet. No scrolling through dozens of tabs—just click and go.
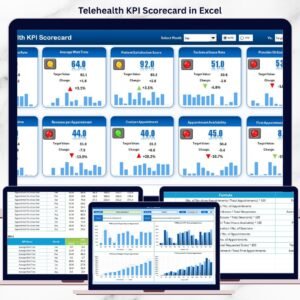
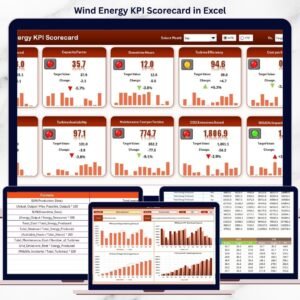
📈 Real-Time KPI Dashboard
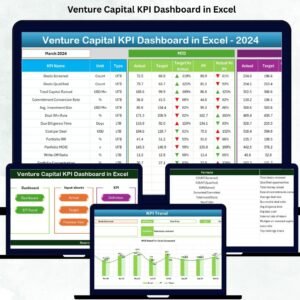
Monitor MTD and YTD Actuals, Targets, and Previous Year comparisons in seconds. Select any month and watch the entire dashboard update instantly.
📉 Trend Analysis Page
Choose any KPI and view MTD and YTD trend charts, KPI definitions, formulas, and target comparisons—all in one view.
📝 Data Input Sheets
Dedicated sheets for:
-
Actual Numbers
-
Target Values
-
Previous Year Data
Each sheet auto-updates the dashboard as soon as you enter new values.
📘 KPI Definition Sheet
Clearly define KPI names, formulas, units, groups, and performance type (UTB/LTB). Perfect for new users and teams.

📦 What’s Inside the Venture Capital KPI Dashboard in Excel
This product contains 7 highly structured and professionally designed worksheets, including:
🔹 Summary Page
A clean index to help users jump across sheets effortlessly.
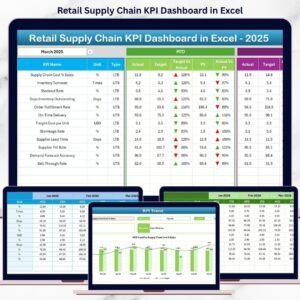
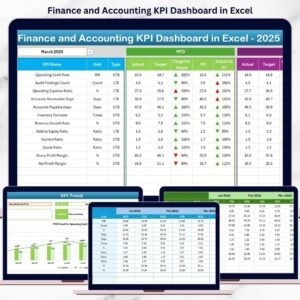
🔹 Dashboard Sheet
Your main performance view showing:
-
Monthly selector
-
MTD Actual vs Target
-
MTD Actual vs Previous Year
-
YTD Actual vs Target
-
YTD Actual vs PY
-
Conditional arrows to highlight performance
🔹 Trend Sheet
See long-term performance patterns, spot spikes or declines, and identify growth behavior across months.
🔹 Actual Numbers Input
Enter your actual performance numbers with complete flexibility.
🔹 Target Sheet
Set monthly and yearly targets according to your investment strategy.
🔹 Previous Year Sheet
Compare year-over-year performance and identify improvement areas.
🔹 KPI Definitions
A master sheet containing every KPI with formulas, definitions, units, and types.
🛠 How to Use the Venture Capital KPI Dashboard in Excel
1️⃣ Enter Your Actual Values
Go to the Actual Numbers Input sheet → Select the month → Enter MTD & YTD data.
2️⃣ Add Your Target Values
Open the Target sheet → Enter monthly and yearly targets.
3️⃣ Update Previous Year Data
Fill the PY sheet with last year’s performance values.
4️⃣ Review KPI Definitions
Check KPI formulas, categories, and definitions to ensure accuracy.
5️⃣ View Dashboard & Trends
Use slicers and drop-down menus to explore trends, compare results, and generate insights instantly.
6️⃣ Use for Reporting & Decision-Making
Use charts, KPI tables, and trend visuals to brief founders, partners, and portfolio teams.
🎯 Who Can Benefit from This Venture Capital KPI Dashboard in Excel
💼 Venture Capital Firms
Monitor startup health, fund performance, and growth indicators easily.
📊 Investment Analysts
Analyze MTD/YTD trends, compare PY performance, and prepare reports faster.
🏢 Startup Founders
Understand KPI expectations and present clear performance insights to investors.
📚 Business Schools & Students
Learn how real VC metrics work through a practical and visual dashboard.
🧮 Financial Consultants
Use the dashboard to guide clients, evaluate risk, and support funding decisions.
Click here to read the Detailed blog post
Watch the step-by-step video tutorial:
Visit our YouTube channel to learn step-by-step video tutorials


Reviews
There are no reviews yet.