
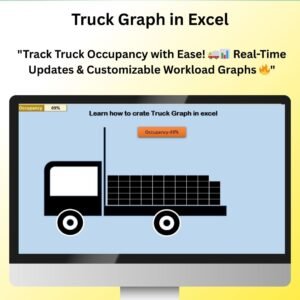
The Truck Graph to Show Occupancy or Workload in Excel is an innovative tool designed to help businesses, managers, and analysts visualize and track truck occupancy or workload in a dynamic and engaging way. This template uses a unique truck-shaped graph to display how much of a truck’s capacity is being used, making it easier to track shipments, deliveries, or resource utilization in real-time.
With its simple setup and customizable features, the Truck Graph offers a clear, visual representation of data, allowing you to track the current workload or occupancy and compare it against available capacity. Whether you’re monitoring vehicle loads, tracking the efficiency of deliveries, or evaluating resource utilization, this tool helps you streamline your logistics or fleet management process.

Key Features of the Truck Graph to Show Occupancy or Workload in Excel
📌 Unique Truck Graph Design
The truck-shaped graph makes it easy to visualize occupancy or workload. The graph fills up based on the data entered, showing the level of capacity being used, which allows you to quickly see how much more can be loaded or how much space is available.
🛠 Customizable Data Input
Easily input data, such as cargo weight, number of items, or percentage of capacity used, to see real-time updates. The graph automatically adjusts to show changes as you enter new data, making it simple to track and manage workloads.
💡 Visual Representation of Workload
The truck graph helps you track the occupancy rate of a truck, warehouse space, or any similar resource. The visual format makes it easy to interpret how much of the available space or capacity is utilized, helping you make informed decisions on load management and efficiency.
🔢 Real-Time Updates
As data is updated, the truck graph dynamically adjusts, reflecting the new occupancy or workload levels in real-time. This ensures that the graph always displays the most accurate data for better decision-making.
🚀 Multiple Use Cases
While designed for truck and logistics management, the truck graph can be adapted to track any other resource usage or occupancy, such as warehouse space, cargo load, or even employee task completion in project management.
📊 Customizable Capacity and Units
Customize the truck graph’s capacity to reflect the units that suit your needs, such as weight, volume, or number of items. You can also adjust the graph’s visual parameters, including colors and labels, to suit your business requirements.
⚙ Easy Setup and Customization
The truck graph is easy to set up with clear instructions provided. No advanced Excel skills are needed, making it accessible for all users. Customize the graph to fit your specific data and needs with a few simple steps.
🚀 Why You’ll Love the Truck Graph to Show Occupancy or Workload in Excel
✅ Clear Visual Tracking – Instantly see how much of your truck’s capacity is being used. ✅ Customizable Inputs – Track data such as cargo weight, number of items, or percentage occupancy. ✅ Real-Time Updates – The graph adjusts automatically as new data is entered. ✅ Multiple Use Cases – Ideal for truck and resource management, and adaptable for other purposes. ✅ Simple Setup – Quick and easy to implement with clear setup instructions.
📂 What’s Inside the Truck Graph to Show Occupancy or Workload in Excel?
- Truck Graph Design: A visually engaging graph that represents truck occupancy or workload.
- Customizable Data Inputs: Track metrics such as weight, items, or percentage of capacity used.
- Real-Time Updates: The graph adjusts dynamically as you input new data.
- Easy Setup: Simple steps to customize and use the truck graph template.
🔍 How to Use the Truck Graph to Show Occupancy or Workload in Excel
1️⃣ Download the Template – Get instant access to the Excel file upon purchase. 2️⃣ Enter Your Data – Input the data for cargo weight, number of items, or capacity percentage. 3️⃣ Customize the Graph – Adjust labels, colors, and capacity values to match your needs. 4️⃣ Track Workload – Watch the truck graph dynamically update as data changes. 5️⃣ Present and Share – Use the graph in meetings, reports, or dashboards to communicate occupancy and workload information.
🎯 Who Can Benefit from the Truck Graph to Show Occupancy or Workload in Excel? 🔹 Fleet Managers
🔹 Logistics Teams
🔹 Warehouse Managers
🔹 Project Managers
🔹 Supply Chain Analysts
🔹 Anyone managing resources and workloads
Track truck occupancy and workloads with ease using the Truck Graph to Show Occupancy or Workload in Excel. Visualize your data, track resource utilization, and make informed decisions with this simple yet powerful tool.
Click here to read the Detailed blog post
https://www.pk-anexcelexpert.com/truck-graph-to-show-occupancy-or-workload-in-excel/


Reviews
There are no reviews yet.