Transport companies face huge risks every day — from driver behavior to vehicle maintenance, road safety compliance, accident prevention, and unexpected breakdowns. When this information is scattered across different files, handwritten logs, and multiple sheets, safety teams struggle to respond quickly. That’s where the Transportation Safety KPI Scorecard in Excel becomes your most powerful tool.
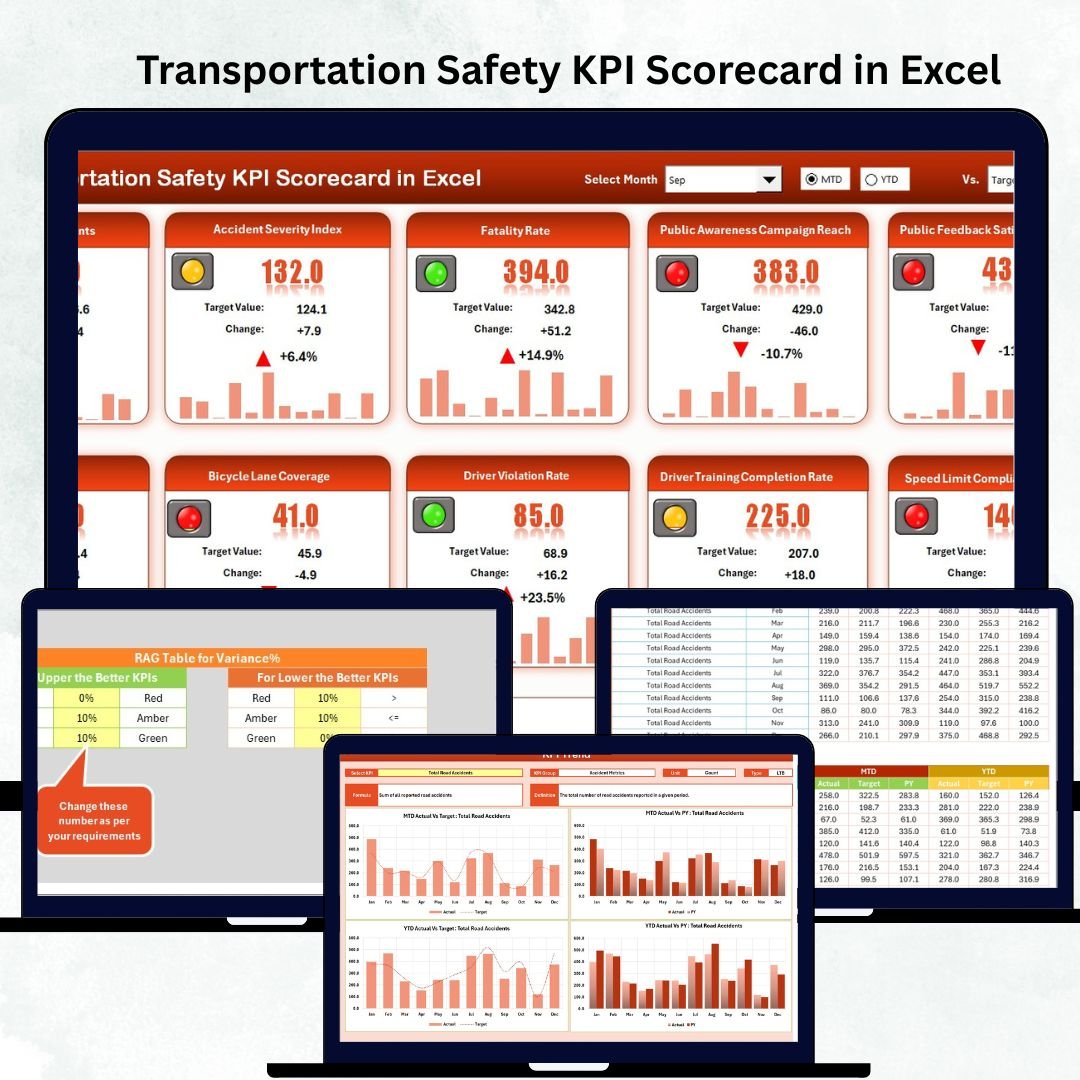
This ready-to-use Excel scorecard centralizes all safety KPIs into one clean dashboard. Whether you’re managing a fleet, monitoring drivers, or ensuring road compliance, this scorecard gives you instant visibility into performance — Month-to-Date (MTD), Year-to-Date (YTD), and even compared with previous year numbers. All you have to do is enter your data, and Excel automatically updates the visuals, trends, and performance indicators.
This professionally-designed scorecard is built for teams that want to reduce accidents, improve safety culture, and make decisions faster. No advanced tools. No complicated setup. Just plug in your data and see powerful insights instantly.
✨ Key Features of the Transportation Safety KPI Scorecard in Excel
🚦 1. All Safety KPIs in One Dashboard
You get a complete view of transportation safety — accidents, breakdowns, violations, driver behavior, maintenance, inspections, and more — all displayed together.
📅 2. Month, MTD & YTD Performance
Use built-in dropdown menus to select any month and instantly view Actual vs Target performance.
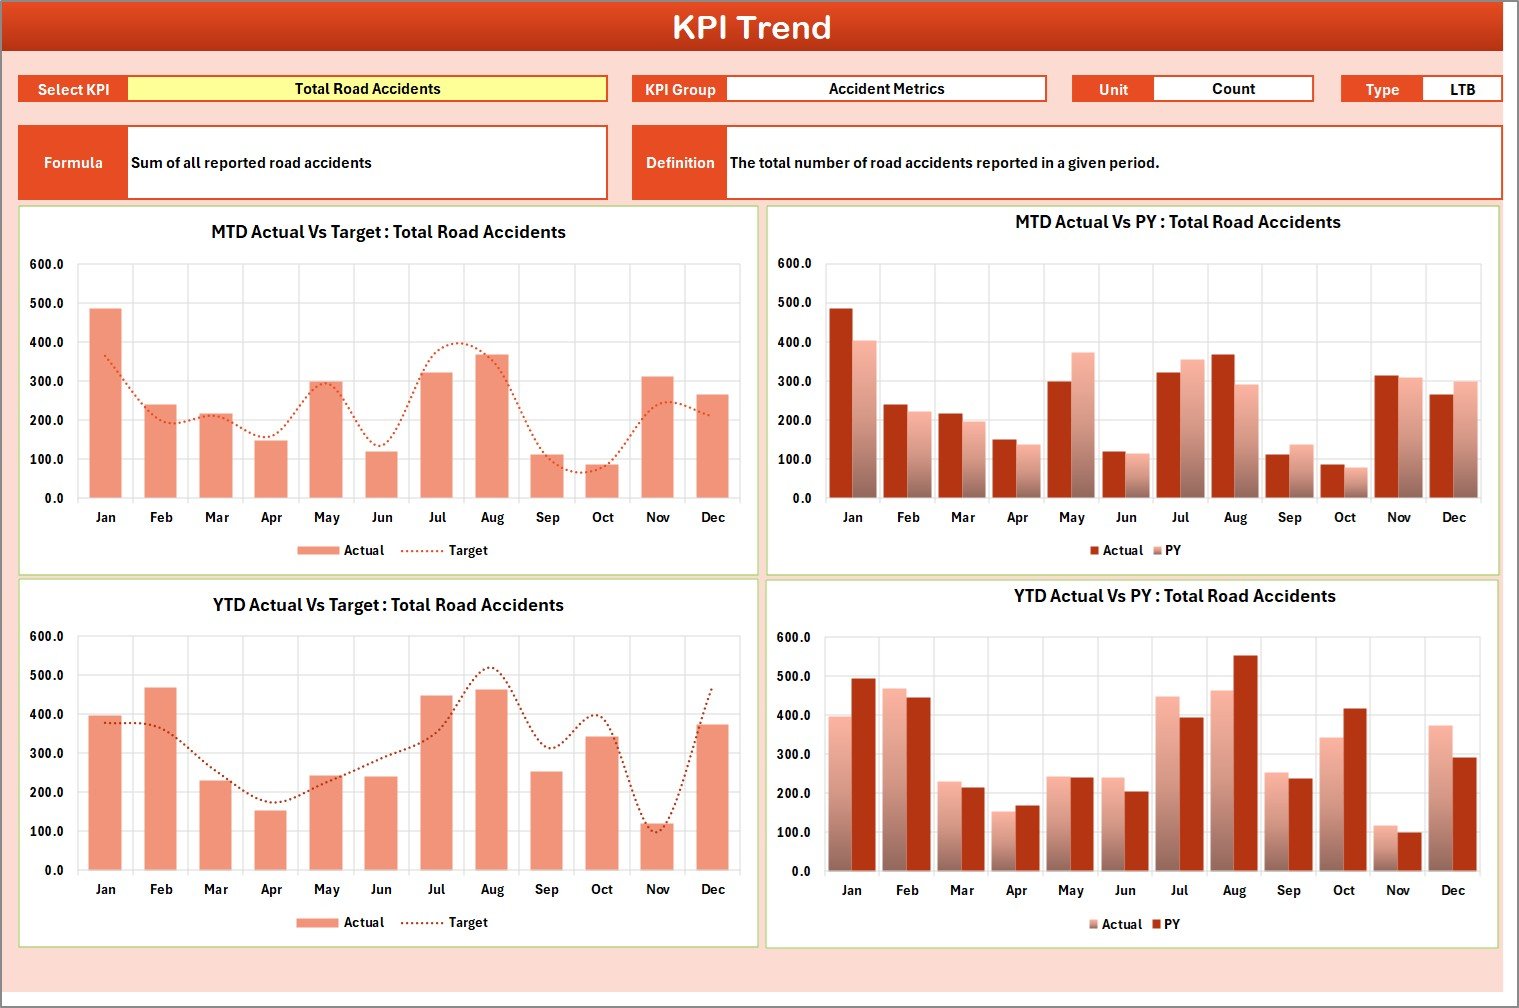
📊 3. KPI Trend Analysis
The dedicated Trend sheet helps you monitor performance month-by-month for both MTD and YTD trends.
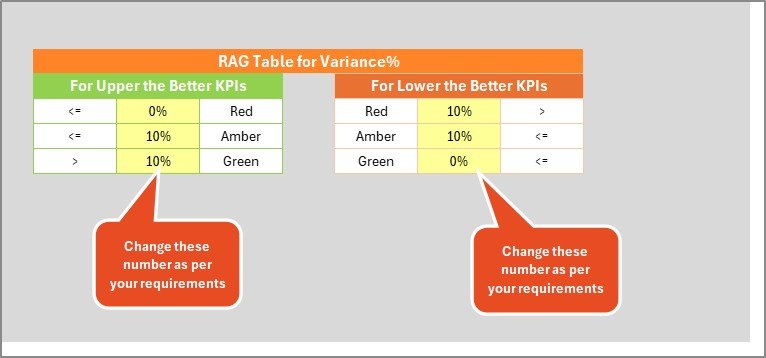
🎯 4. Visual Alerts & Conditional Formatting
Green arrows, red indicators, color-coded signals — everything you need for quick decision-making.
📑 5. Includes 10 Key Transportation Safety KPIs
Easily track the most essential safety indicators in one place.
📝 6. Fully Editable & Customizable
Add KPIs, rename categories, change targets — tailor it to your organization.
📦 What’s Inside the Transportation Safety KPI Scorecard
This scorecard comes with four professionally built worksheets, each designed for speed, clarity, and ease of use.
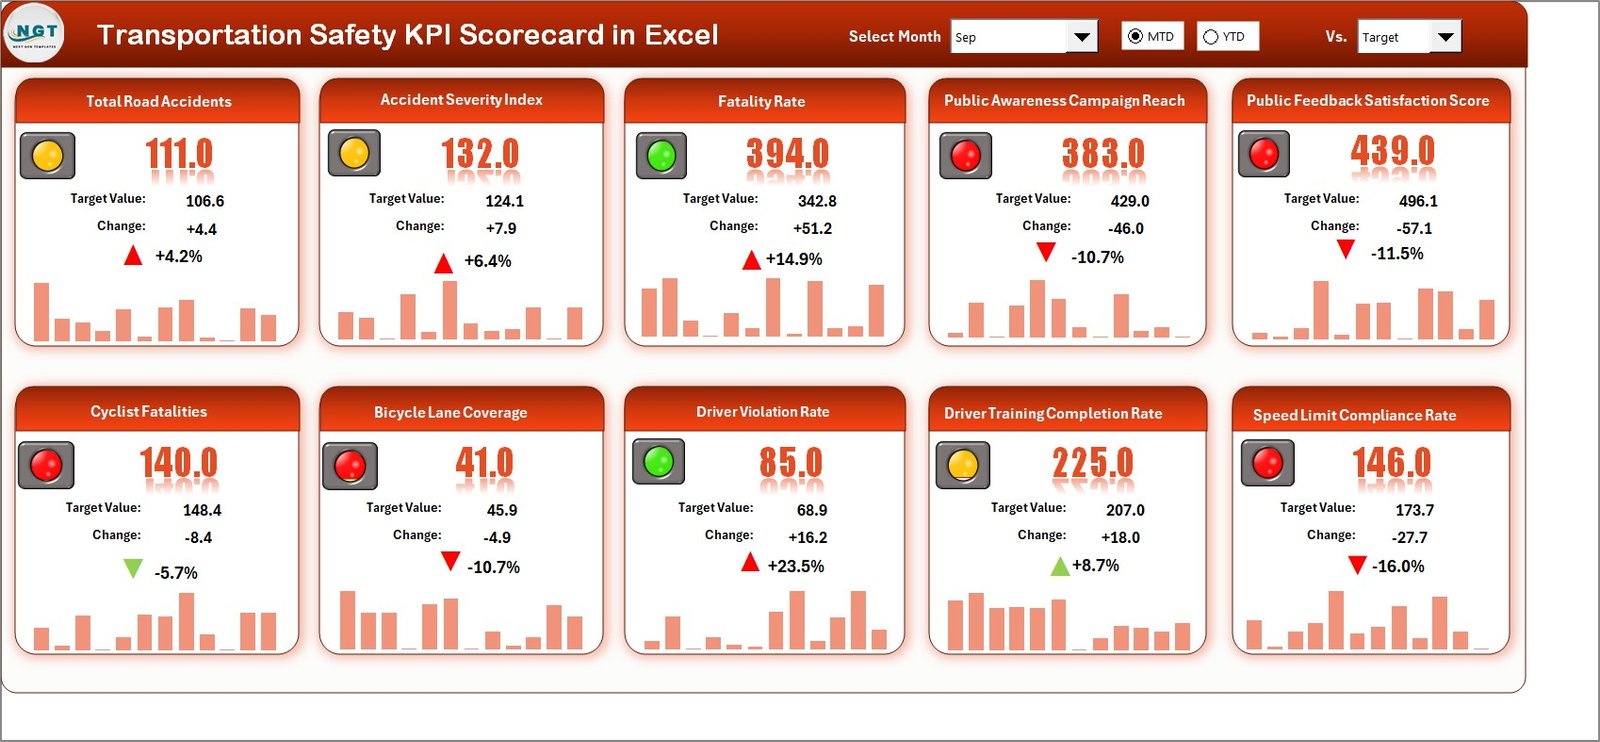
1️⃣ Scorecard Sheet (Main Dashboard)
Your command center — showing Actual, Target, and Previous Year values.
✔ 10 KPIs shown in one view
✔ Dropdown for Month, MTD, and YTD
✔ Instant performance comparison
✔ Visual color coding for quick insights
2️⃣ KPI Trend Sheet
Perfect for detecting performance direction.
✔ Select any KPI from dropdown
✔ See month-wise ACTUAL, TARGET, PY trends
✔ Separate MTD & YTD charts
✔ See definitions, formulas, KPI type (UTB/LTB)
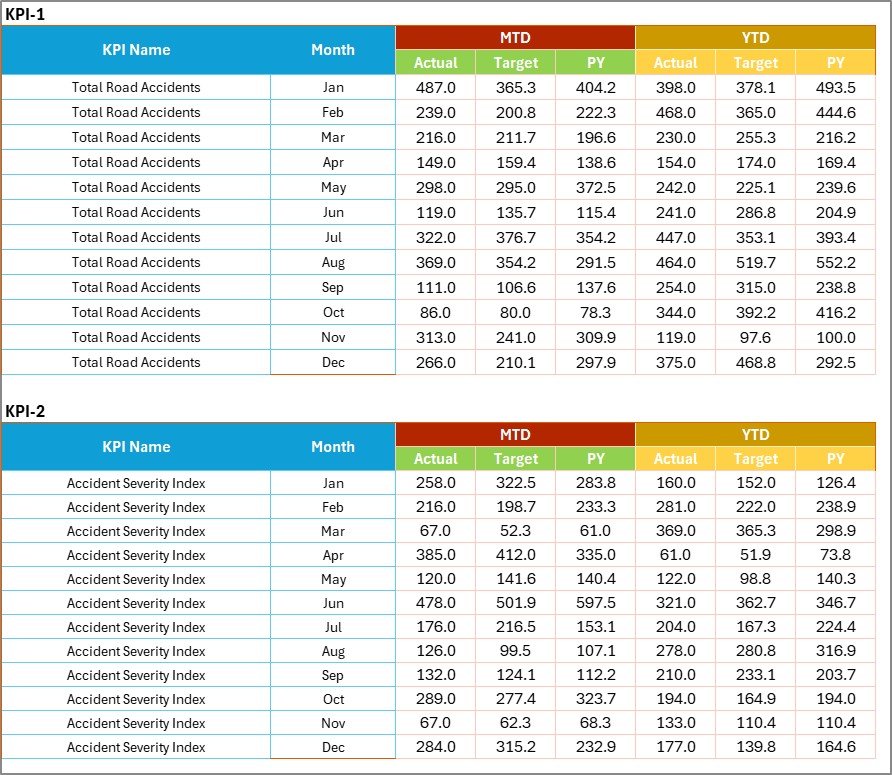
3️⃣ Input Data Sheet
Just fill in Actual, Target, and Previous Year data — everything else updates automatically.
✔ Easy monthly entry
✔ Accurate calculations
✔ Fully flexible
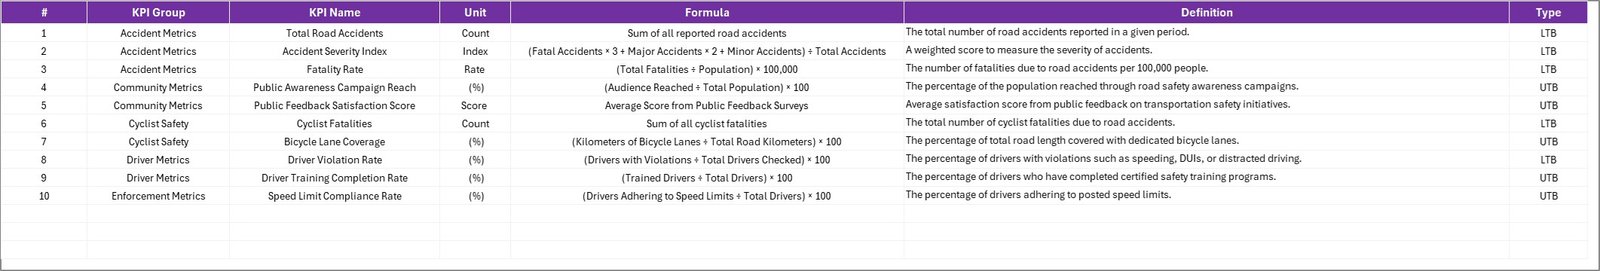
4️⃣ KPI Definition Sheet
Document your KPI structure clearly.
✔ KPI Name
✔ Unit
✔ Formula
✔ KPI Type
✔ KPI Group
✔ Definition
🧩 How to Use the Transportation Safety KPI Scorecard
Using this Excel scorecard takes just a few minutes — even for beginners.
Step 1: Enter Data in Input Sheet
Record Actual, Target, and PY numbers for each KPI.
Step 2: Update KPI Definitions (Optional)
Modify KPI names, units, or formulas based on your business.
Step 3: Select Month in Scorecard
View MTD or YTD results instantly with a simple dropdown.
Step 4: Analyze Trends
Open the KPI Trend Sheet to monitor performance movement.
Step 5: Take Action
Identify risks early and improve safety performance.
👤 Who Can Benefit from This Product
This scorecard is perfect for all transportation-related roles, including:
-
🚛 Transportation Managers
-
🚌 Fleet Supervisors
-
🛠️ Vehicle Maintenance Teams
-
👮 Safety Officers
-
💼 Logistics & Operations Teams
-
📊 Compliance Departments
-
🏢 Business Owners
If your work involves managing fleet safety, compliance, or performance, this Excel scorecard is a must-have tool.
Click Here to Read the Detailed Blog Post
Watch the step-by-step video tutorial:


Reviews
There are no reviews yet.