


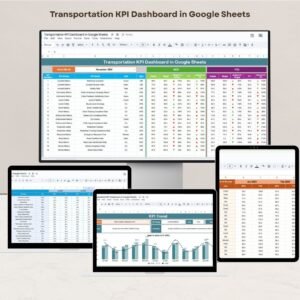
The Transportation KPI Dashboard in Google Sheets is an essential tool designed to help businesses in logistics, shipping, and supply chain management track and analyze key performance indicators (KPIs). This dashboard consolidates critical metrics like delivery times, cost per mile, fleet utilization, and on-time performance into one easy-to-use platform, enabling managers to make data-driven decisions and improve transportation efficiency.
By using this Google Sheets-based tool, organizations can optimize routes, reduce transportation costs, and enhance overall service quality, ultimately boosting operational efficiency.

Key Features of the Transportation KPI Dashboard in Google Sheets
📊 Centralized KPI Tracking
-
Comprehensive Metric Monitoring: Track vital transportation KPIs such as cost per mile, fleet utilization, delivery performance, and on-time delivery rates, all in one dashboard.
-
Real-Time Data Visualization: Use dynamic charts, graphs, and tables to visualize trends, performance, and comparisons to set targets.
📈 Performance Analysis and Monitoring
-
MTD & YTD Tracking: Monitor Month-to-Date (MTD) and Year-to-Date (YTD) performance, compare with targets, and evaluate historical data for year-over-year insights.
-
KPI Breakdown: Track the individual performance of each metric to identify strengths and weaknesses in the transportation process.
🔧 Data Integration and Reporting
-
Easy Data Import: Import data from various systems, such as transportation management software or ERP systems, to keep the dashboard updated with the latest performance data.
-
Actionable Insights: Quickly identify trends, bottlenecks, and areas for improvement to optimize your transportation operations.
💡 User-Friendly Interface
-
Intuitive Design: The dashboard is designed to be easy to navigate, even for users without technical expertise. It provides a clear and actionable view of transportation metrics.
-
Customizable Layout: Modify the dashboard to suit your organization’s specific needs, adding or removing metrics based on your goals.
Benefits of Using the Transportation KPI Dashboard in Google Sheets
✅ Improved Decision-Making
Get access to real-time performance data that allows for informed decision-making. Track progress, spot inefficiencies, and make changes to optimize operations.
✅ Cost Optimization
Track transportation costs and performance against budget targets to ensure cost-effective operations. Identify areas to reduce unnecessary expenses, such as fuel consumption or fleet downtime.
✅ Enhanced Efficiency
Easily monitor key metrics to identify underperforming areas and implement strategies to improve transportation efficiency and service quality.
✅ Real-Time Collaboration
With Google Sheets’ cloud-based features, your team can collaborate in real time, making it easier to update data, share insights, and make decisions together.
Getting Started with Your Transportation KPI Dashboard in Google Sheets
-
Download the Template: Start by downloading the Transportation KPI Dashboard template to track your transportation performance.
-
Set Up Your KPIs: Define the KPIs that align with your transportation objectives, such as on-time delivery rates or fuel efficiency.
-
Import Data: Integrate data from your transportation management systems or other platforms to keep the dashboard updated with the latest information.
-
Monitor and Analyze: Use the dashboard to track your transportation performance, assess trends, and monitor efficiency.
-
Optimize and Share: Share the dashboard with stakeholders, analyze the data to make informed decisions, and optimize strategies for improved performance.
By using the Transportation KPI Dashboard in Google Sheets, your organization can optimize its transportation operations, enhance decision-making, and improve overall efficiency in the transportation process.
Click here to read the Detailed blog post
Transportation KPI Dashboard in Google Sheets
Visit our YouTube channel to learn step-by-step video tutorials
YouTube.com/@NeotechNavigators


Reviews
There are no reviews yet.