


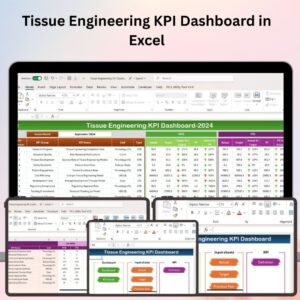
The Tissue Engineering KPI Dashboard in Excel is a specialized tool designed for researchers, lab managers, and professionals in the field of tissue engineering. This Excel-based dashboard enables you to monitor and evaluate the key performance indicators (KPIs) related to tissue engineering experiments, including cell growth, scaffold efficiency, material properties, and experimental outcomes.
With interactive charts, real-time data tracking, and customizable features, this dashboard helps you monitor the progress of your research, assess the success of tissue culture processes, and identify areas for improvement to enhance tissue engineering outcomes.

Key Features of the Tissue Engineering KPI Dashboard in Excel:
🧬 Cell Growth and Proliferation Monitoring
Track the growth and proliferation rates of cultured cells, ensuring that they meet the required standards for tissue regeneration.
🔬 Scaffold Efficiency
Monitor scaffold properties and performance, including material degradation, mechanical strength, and cell adhesion, to ensure that scaffolds are functioning as expected.
📊 Experimental Outcome Tracking
Track key experimental results such as tissue formation, cellular differentiation, and tissue maturity, helping you assess the success of tissue engineering processes.
⚙️ Material Properties Monitoring
Monitor the properties of materials used in tissue engineering, including elasticity, biocompatibility, and degradation rates, to ensure they meet experimental requirements.
💡 Cost and Resource Tracking
Track the costs and resources used in tissue engineering experiments, including lab materials, equipment, and time spent, to ensure that research projects remain within budget.
🚀 Why You’ll Love the Tissue Engineering KPI Dashboard in Excel:
✅ Track Cell Growth – Monitor the growth and proliferation of cells used in tissue engineering experiments, ensuring that the tissue culture processes are successful.
✅ Evaluate Scaffold Efficiency – Assess scaffold properties, including material degradation and cell adhesion, to optimize scaffold performance in tissue engineering.
✅ Analyze Experimental Outcomes – Track key experimental outcomes, including tissue formation, differentiation, and maturity, to evaluate the success of the engineering process.
✅ Monitor Material Properties – Keep track of the physical and mechanical properties of materials used in tissue engineering, ensuring optimal performance.
✅ Cost Management – Track lab resources, material costs, and experiment time to ensure your research stays within budget while maintaining high-quality outcomes.
✅ Fully Customizable and Interactive – Fully customizable to suit your specific tissue engineering projects, with interactive charts and real-time tracking for improved decision-making.
What’s Inside the Tissue Engineering KPI Dashboard in Excel:
-
Cell Growth and Proliferation: Track cell growth rates and proliferation to ensure that cells are developing as expected in your tissue engineering experiments.
-
Scaffold Efficiency: Monitor scaffold degradation, material strength, and cell adhesion to ensure scaffolds are functioning correctly.
-
Experimental Outcomes: Track key outcomes such as tissue formation, cellular differentiation, and tissue maturation, ensuring successful tissue engineering processes.
-
Material Properties: Monitor material properties like elasticity, biocompatibility, and degradation rates to optimize material usage in tissue engineering.
-
Cost and Resource Management: Track resource consumption, including materials, equipment, and time spent on experiments, to ensure that your research stays on budget.
-
Custom Reports: Generate tailored reports summarizing key KPIs such as cell growth, scaffold performance, and experimental outcomes to help guide research decisions.
How to Use the Tissue Engineering KPI Dashboard in Excel:
1️⃣ Download the Template – Instantly access your Excel file upon purchase.
2️⃣ Enter Research Data – Add data related to cell growth, scaffold properties, material performance, and experimental outcomes to start tracking KPIs.
3️⃣ Monitor Key Metrics – Use the dashboard to monitor cell growth, scaffold efficiency, and material properties in real-time.
4️⃣ Analyze Experimental Success – Track the success of tissue engineering experiments, identifying areas where improvements can be made.
5️⃣ Generate Reports – Create customized reports summarizing key metrics to inform decisions on future experiments and research.
Who Can Benefit from the Tissue Engineering KPI Dashboard in Excel:
-
Researchers and Scientists in Tissue Engineering
-
Lab Managers and Research Directors
-
Biotechnology and Pharmaceutical Companies
-
Regenerative Medicine Teams
-
Biomedical Engineers
-
Academic Institutions and Universities
-
Medical Device and Biomaterial Companies
The Tissue Engineering KPI Dashboard in Excel is the perfect tool for anyone in the field of tissue engineering looking to track and optimize their research. With features designed to monitor cell growth, scaffold performance, material properties, and experimental outcomes, this dashboard helps ensure that your research meets the highest standards of quality and success.
Click here to read the Detailed blog post
https://www.pk-anexcelexpert.com/tissue-engineering-kpi-dashboard-in-excel/
Visit our YouTube channel to learn step-by-step video tutorials
Youtube.com/@PKAnExcelExpert


Reviews
There are no reviews yet.