The thrift fashion industry is growing faster than ever as customers embrace sustainability, affordability, and conscious consumption. However, running a successful thrift or resale fashion business is not just about sourcing great products. Store owners must constantly track costs, profits, discounts, returns, customer satisfaction, and monthly trends to remain competitive and profitable.
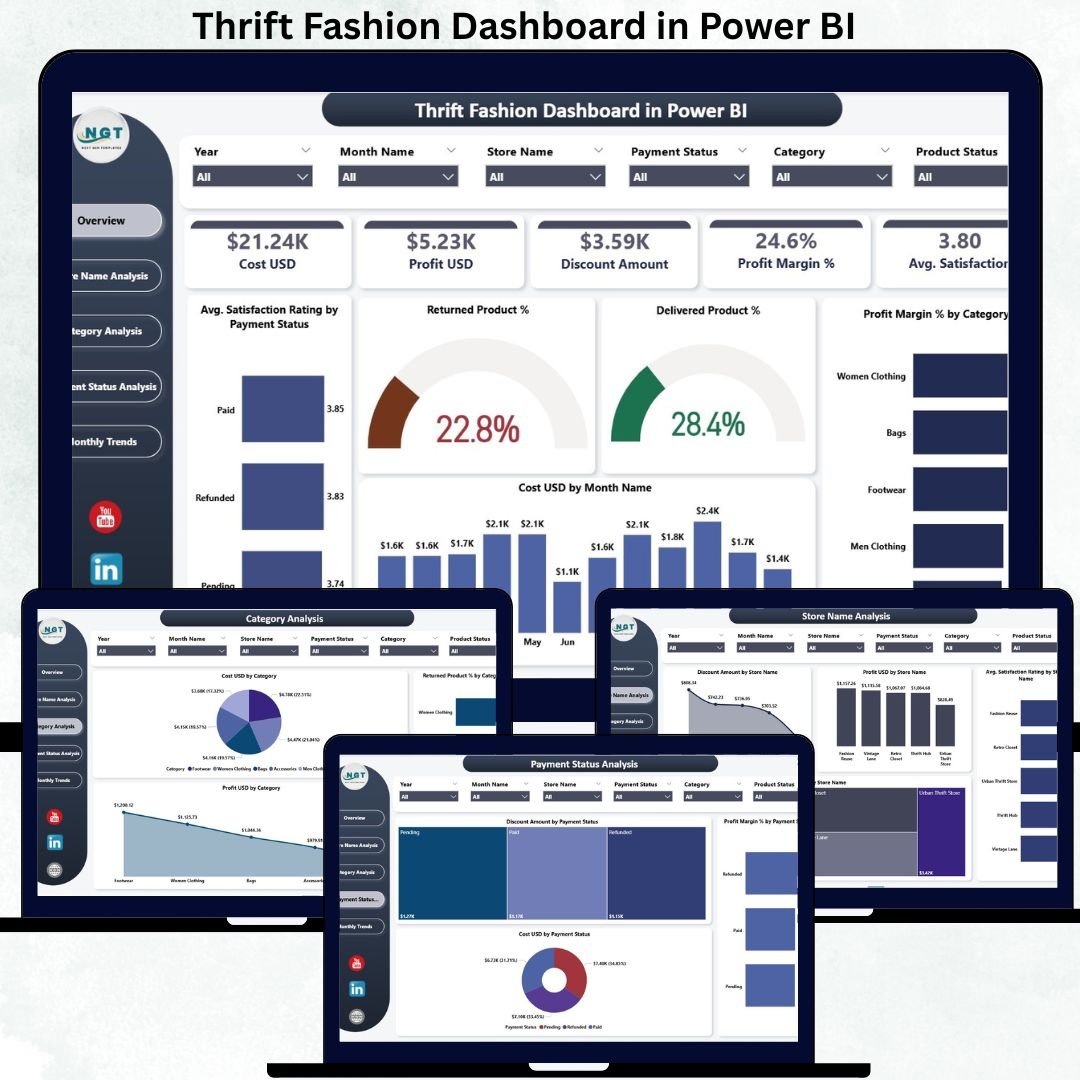
The Thrift Fashion Dashboard in Power BI is designed to solve this exact challenge. Thrift Fashion Dashboard in Power BI It converts raw sales and operational data into interactive, easy-to-understand visuals that help thrift fashion businesses see the full picture of their performance. Thrift Fashion Dashboard in Power BI With smart KPIs, slicers, and trend analysis, this dashboard enables faster decisions, better pricing strategies, and improved customer experience—all in one Power BI report. 🚀
Whether you run a single thrift store or manage multiple resale locations, this dashboard becomes your central performance command center.
Key Features of the Thrift Fashion Dashboard in Power BI ✨
This dashboard is purpose-built for thrift and resale fashion analytics:
✨ 5 Insight-Driven Pages – Overview, Store Analysis, Category Analysis, Payment Status Analysis & Monthly Trends
📊 Powerful KPI Cards – Track cost, profit, discounts, margins & satisfaction instantly
🎯 Interactive Slicers – Filter data by store, category, payment status & time
📉 Profit Margin & Discount Analysis – Understand real profitability
🔄 Return & Delivery Performance Tracking – Reduce losses proactively
📈 Trend Analysis Charts – Identify seasonality and growth patterns
💡 User-Friendly Power BI Design – No technical expertise required
⚡ Fast & Accurate Insights – Replace slow manual reports
This dashboard transforms sustainability-focused retail data into actionable business intelligence.
What’s Inside the Thrift Fashion Dashboard in Power BI 📂
You get a complete analytical framework with five powerful pages:
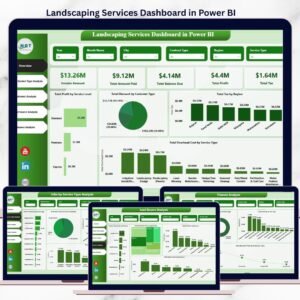
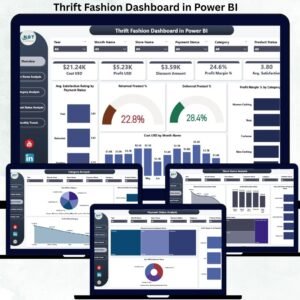
📌 Overview Page
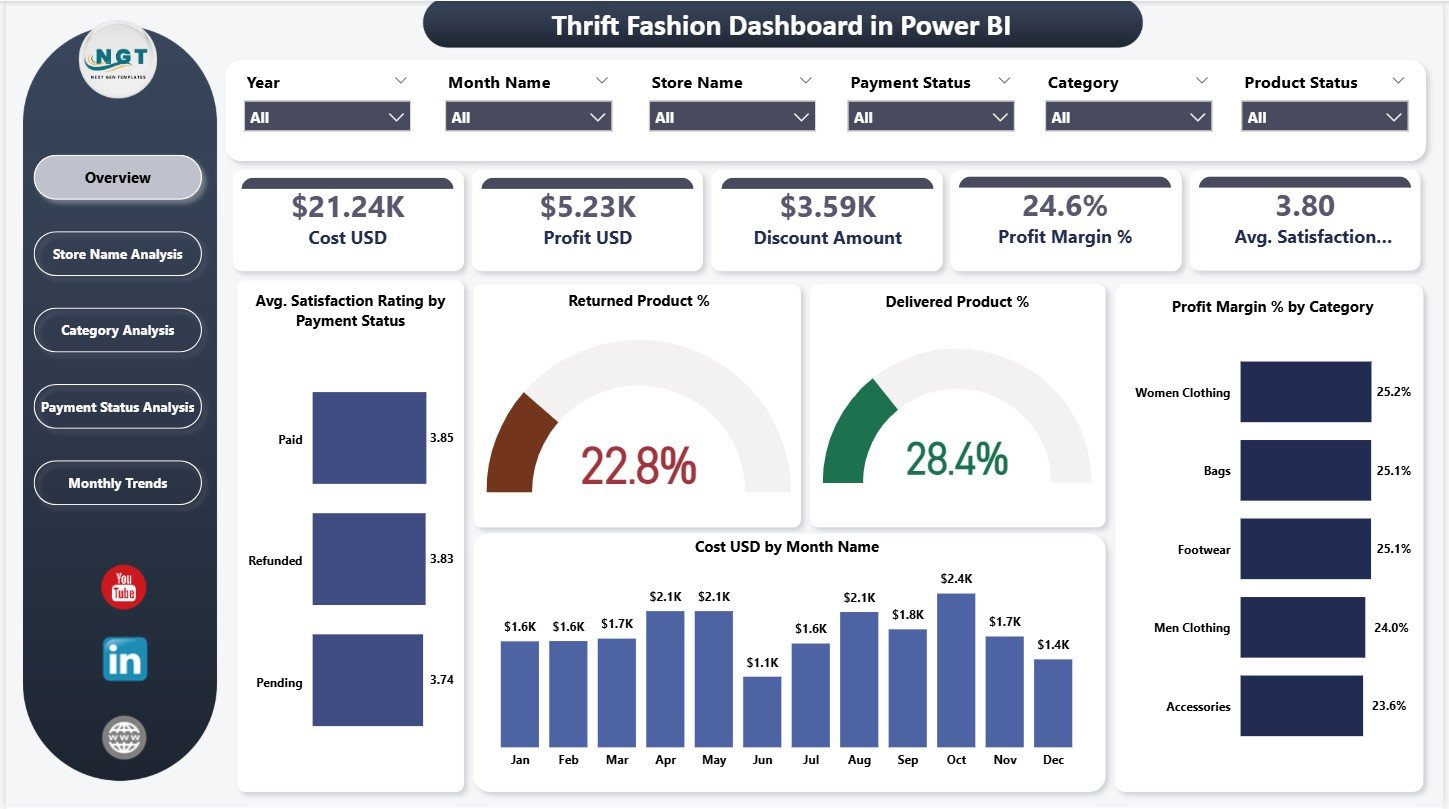
A high-level snapshot of overall business health featuring:
-
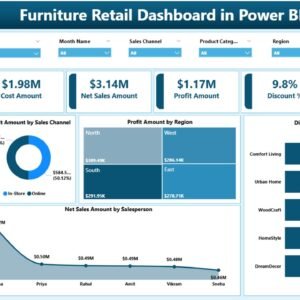
KPI Cards: Cost, Profit, Discount Amount, Profit Margin %, Avg Satisfaction Rating
-
Satisfaction Rating by Payment Status
-
Returned vs Delivered Product %
-
Profit Margin % by Category
-
Cost (USD) by Month
-
Dynamic slicers for quick filtering
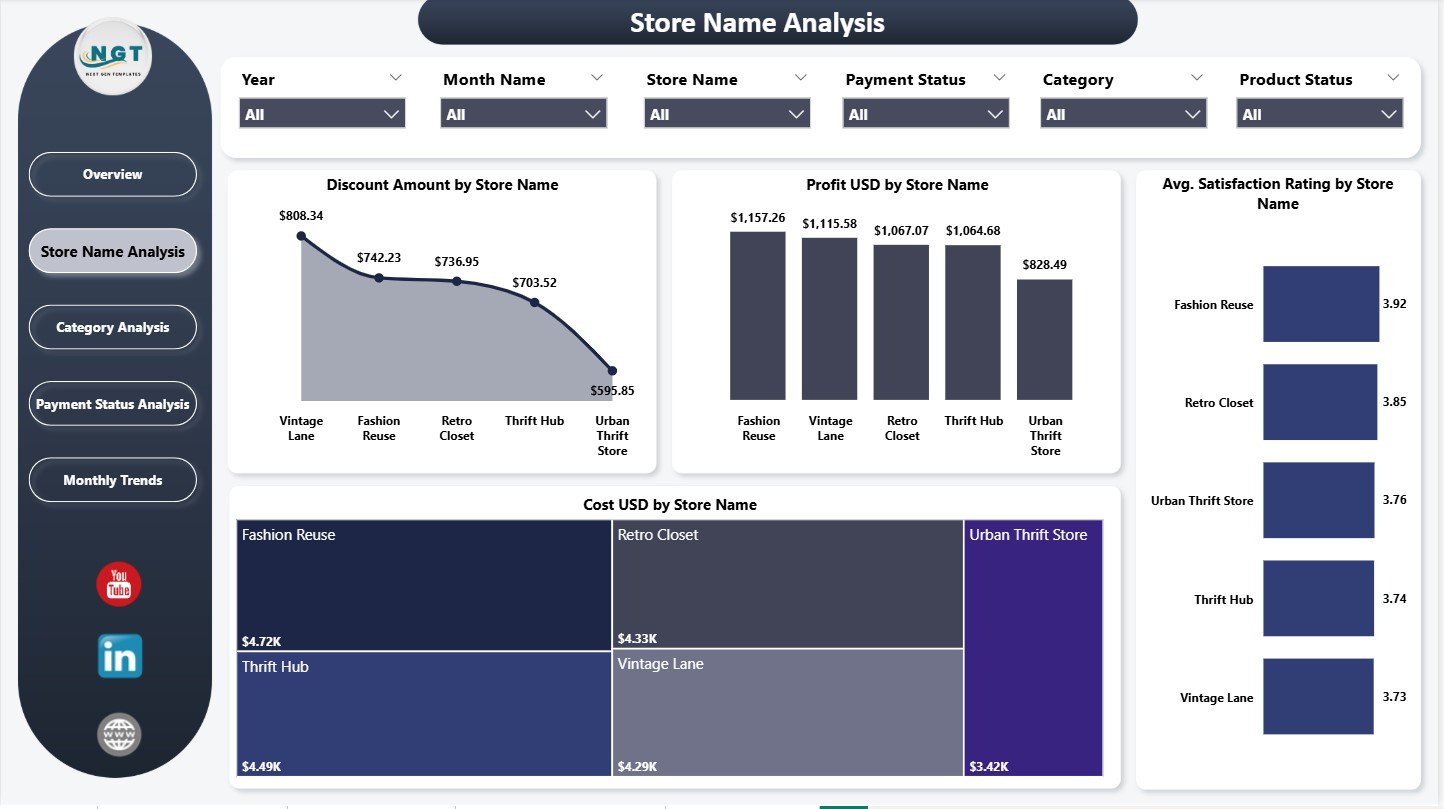
📌 Store Name Analysis Page
Compare individual store performance using:
-
Discount Amount by Store
-
Profit (USD) by Store
-
Avg Satisfaction Rating by Store
-
Cost (USD) by Store
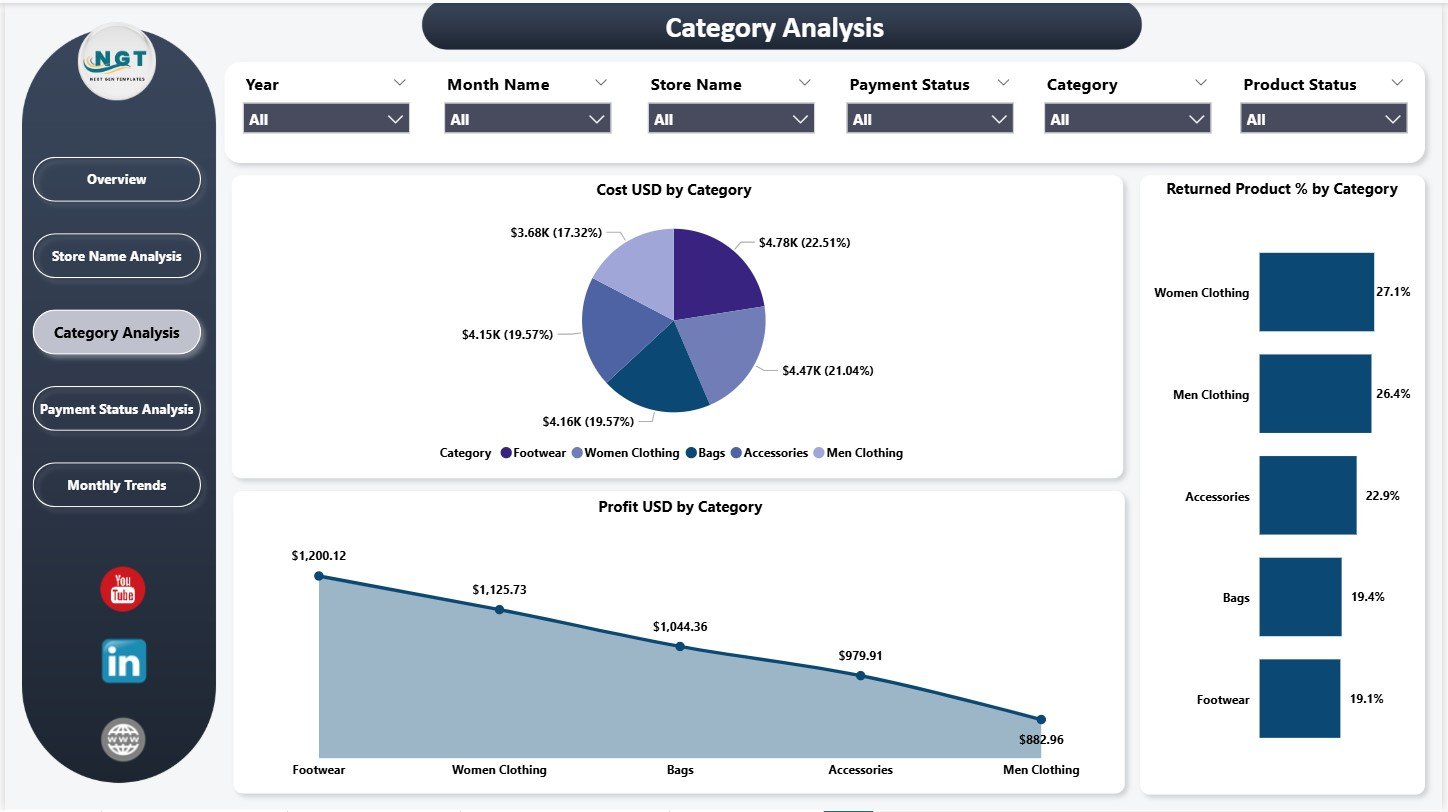
📌 Category Analysis Page
Understand category-wise performance with:
-
Cost by Category
-
Profit by Category
-
Returned Product % by Category
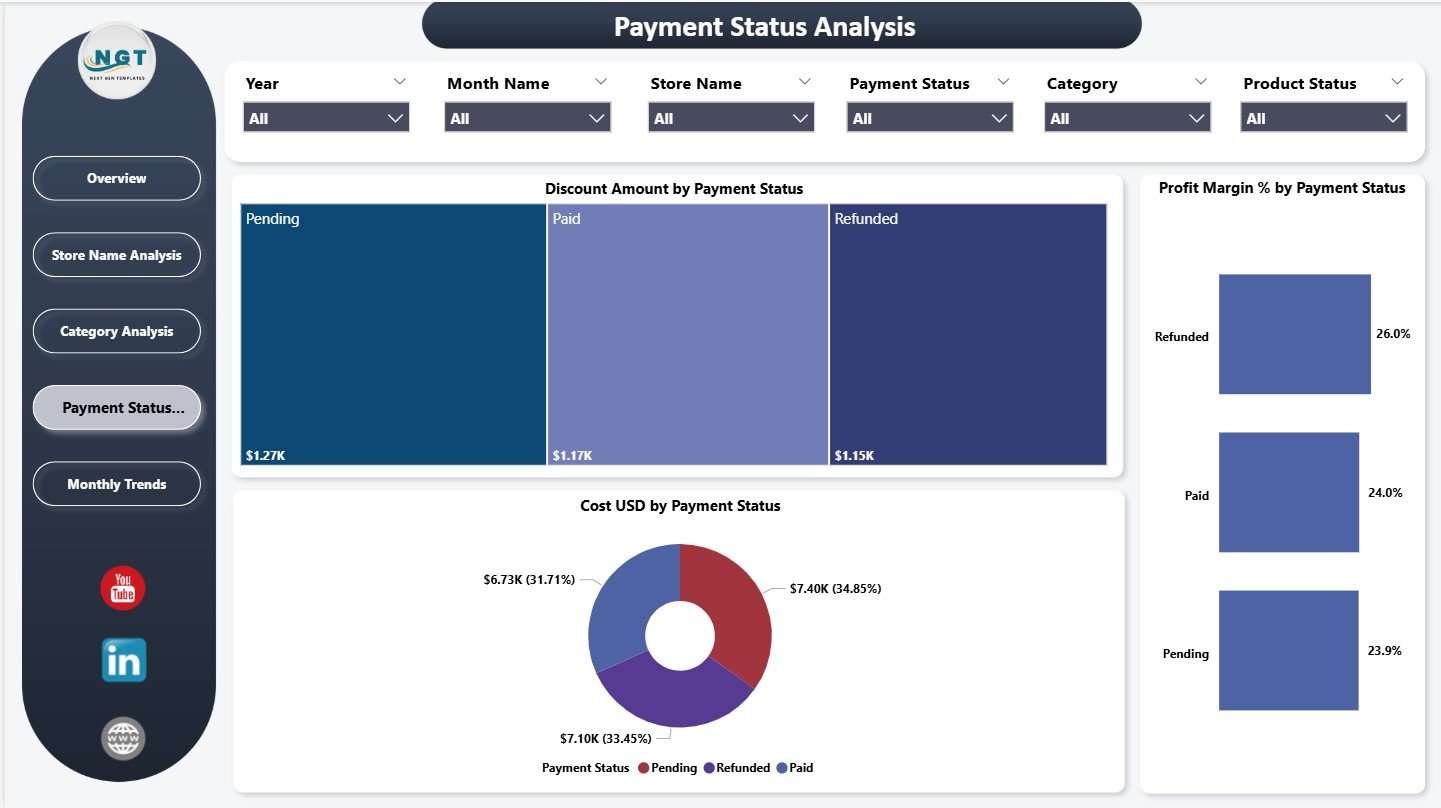
📌 Payment Status Analysis Page
Evaluate payment-method impact using:
-
Discount Amount by Payment Status
-
Cost by Payment Status
-
Profit Margin % by Payment Status
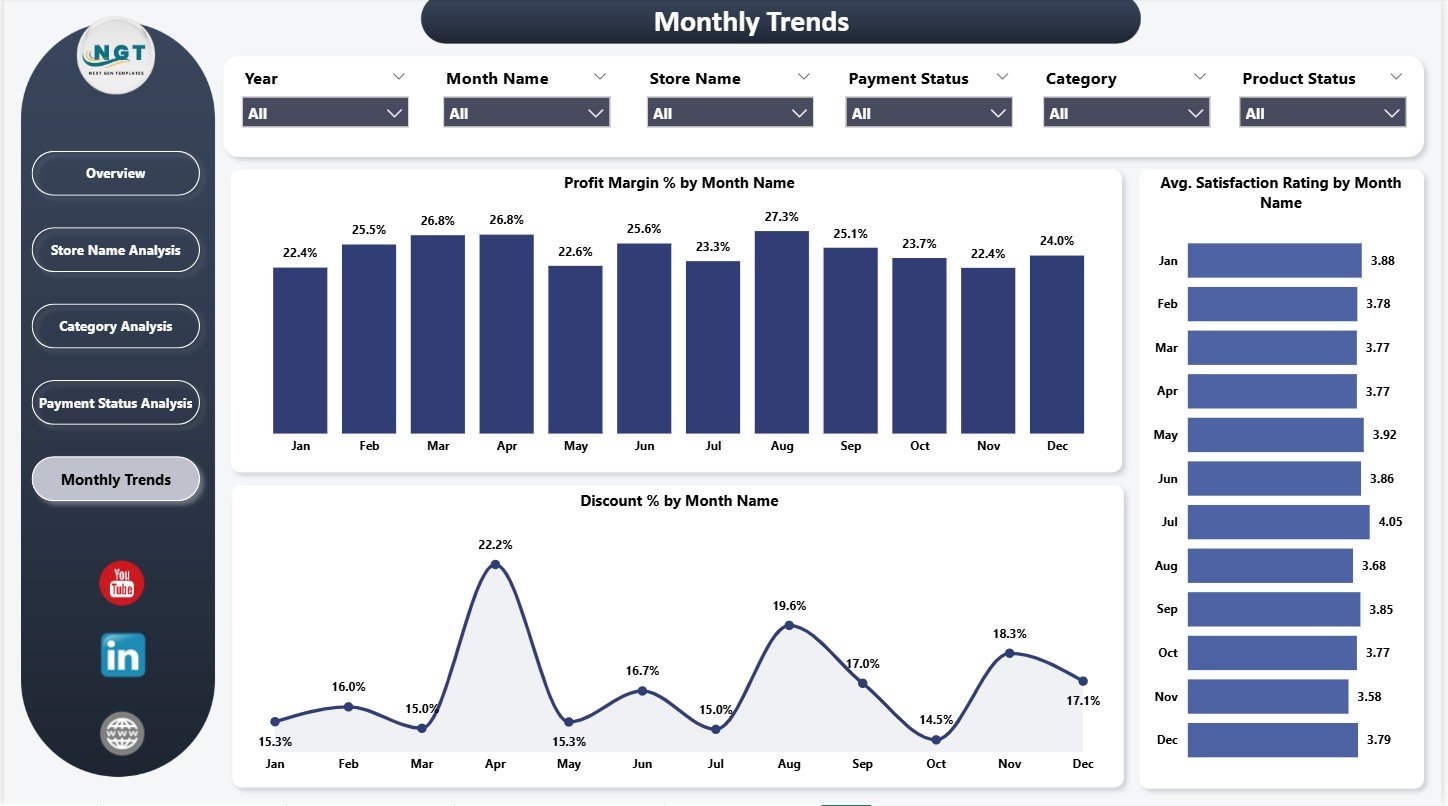
📌 Monthly Trends Page
Track time-based performance using:
-
Profit Margin % by Month
-
Avg Satisfaction Rating by Month
-
Discount % by Month
Each page works together to deliver a 360-degree view of your thrift fashion business.
How to Use the Thrift Fashion Dashboard in Power BI 🛠️
Using the dashboard is simple and intuitive:
1️⃣ Load your sales, cost, discount, and satisfaction data
2️⃣ Refresh the Power BI report
3️⃣ Use slicers to filter by store, category, payment status, or month
4️⃣ Review KPI cards for instant performance insight
5️⃣ Analyze store, category, and payment behavior
6️⃣ Track trends to plan promotions and pricing strategies
No coding. No complex formulas. Just smart analytics. ⚡
Who Can Benefit from This Thrift Fashion Dashboard? 👥
This dashboard is ideal for:
♻️ Thrift Store Owners – Monitor profitability and margins
👗 Resale Fashion Brands – Track sustainable growth
📊 Retail Analysts – Analyze trends and performance gaps
💰 Finance & Operations Teams – Control costs and discounts
📈 Marketing Teams – Align promotions with profitable periods
If your business values sustainability + profitability, this dashboard is essential.


Reviews
There are no reviews yet.