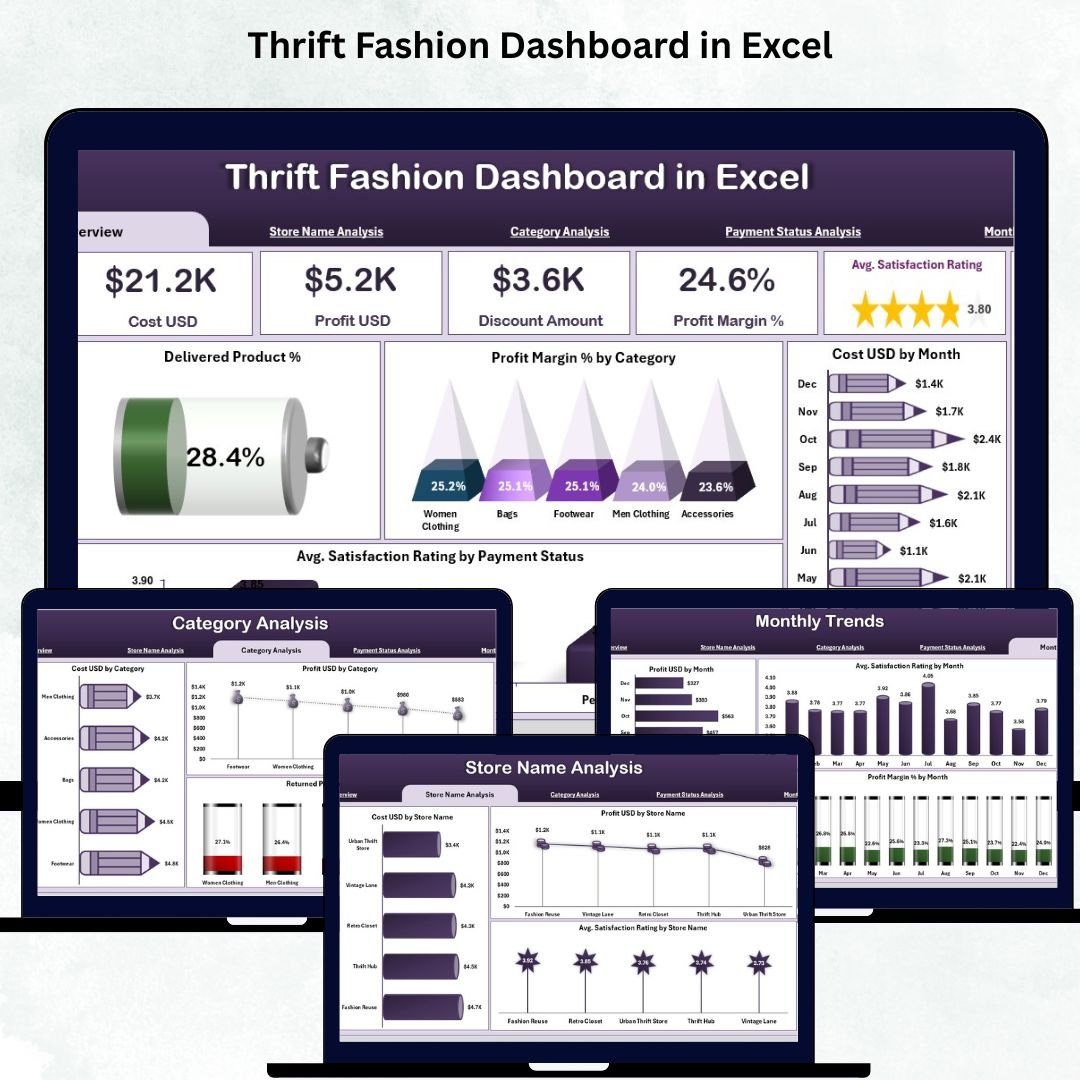
Managing a thrift fashion business becomes easier when you can track performance, study category trends, and monitor customer behavior—all in one place. The Thrift Fashion Dashboard in Excel is a ready-to-use, visually interactive, and beginner-friendly reporting system designed to simplify your entire thrift store operations. 💡 Whether you manage multiple stores, explore second-hand apparel sales, analyze category performance, or want to improve customer satisfaction, this dashboard gives you complete business visibility within seconds.
Packed with powerful charts, slicers, KPI cards, and automated visuals, this dashboard transforms raw data into meaningful insights—helping you make smarter decisions without spending hours on manual reporting.
✨ Key Features of the Thrift Fashion Dashboard in Excel
This dashboard is designed to give you clarity, speed, and actionable insights. Here’s what makes it truly powerful:
📊 Ready-to-Use Analytics
Get five analytical pages—Overview, Store Name Analysis, Category Analysis, Payment Status Analysis & Monthly Trends—each offering deep insights with one click.
🎯 Smart KPI Cards
Monitor important performance metrics like Delivered Product %, Total Profit, Average Satisfaction Rating, Total Sales, and Total Cost instantly.
📉 Insightful Charts & Trends
Study customer ratings, profit trends, return patterns, category performance, and monthly behavior with clear, interactive visuals.
🔽 Slicers for Instant Filtering
Filter data by month, store, category, payment status, and more. Deep analysis has never been easier.
⚡ Automatic Refresh
Update the Data Sheet only once—and the dashboard refreshes automatically across all pages.
📦 What’s Inside the Thrift Fashion Dashboard in Excel
Inside this professional dashboard template, you will find:
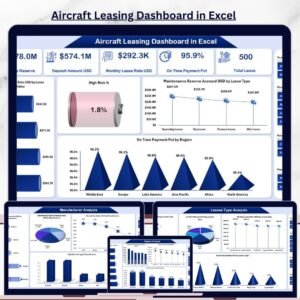
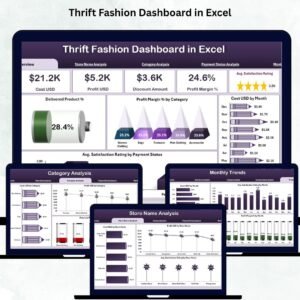
1️⃣ Overview Page
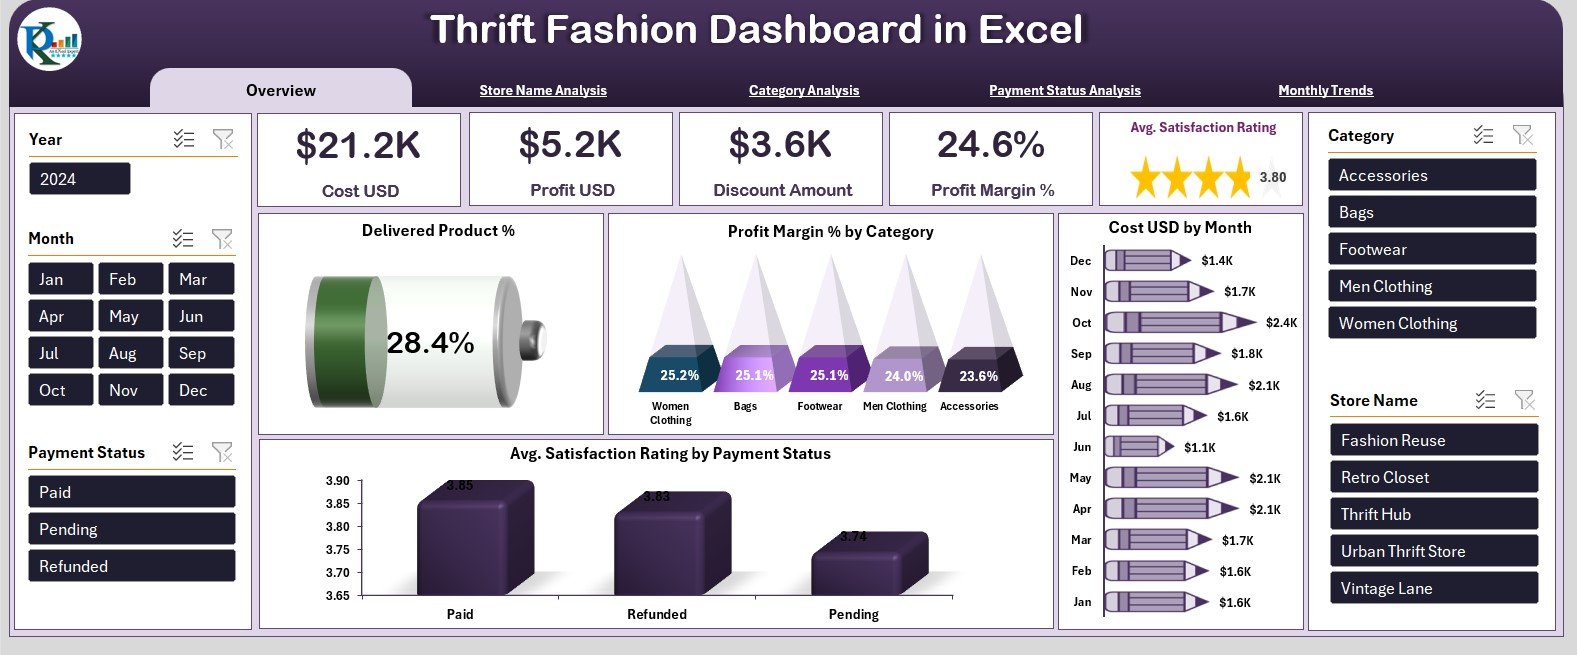
Your daily command center! It includes KPI cards, slicers, and charts like:
-
Delivered Product % 📦
-
Profit Margin by Category 💰
-
Cost by Month 📅
-
Satisfaction Rating by Payment Status ⭐
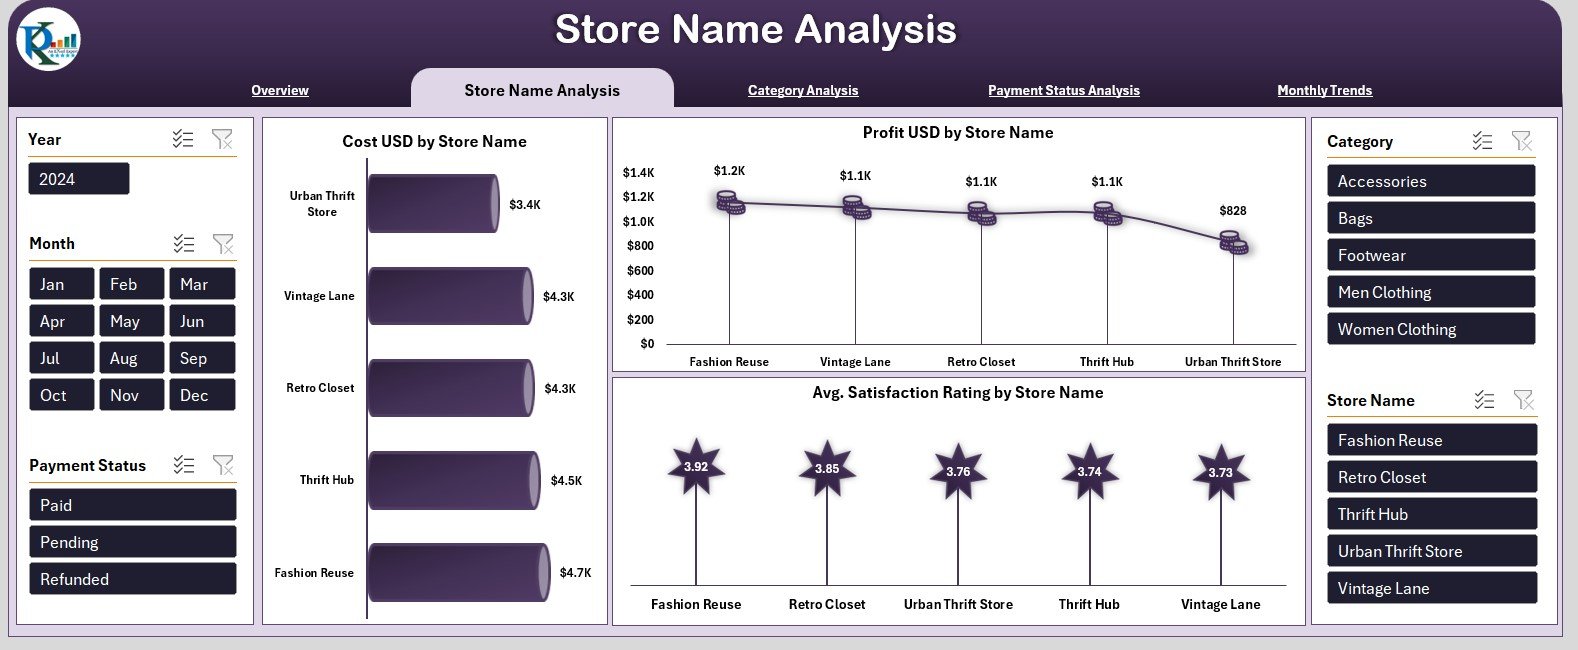
2️⃣ Store Name Analysis Page
Helps you compare store-wise performance, costs, profitability, and customer satisfaction. Perfect for multi-location thrift brands.
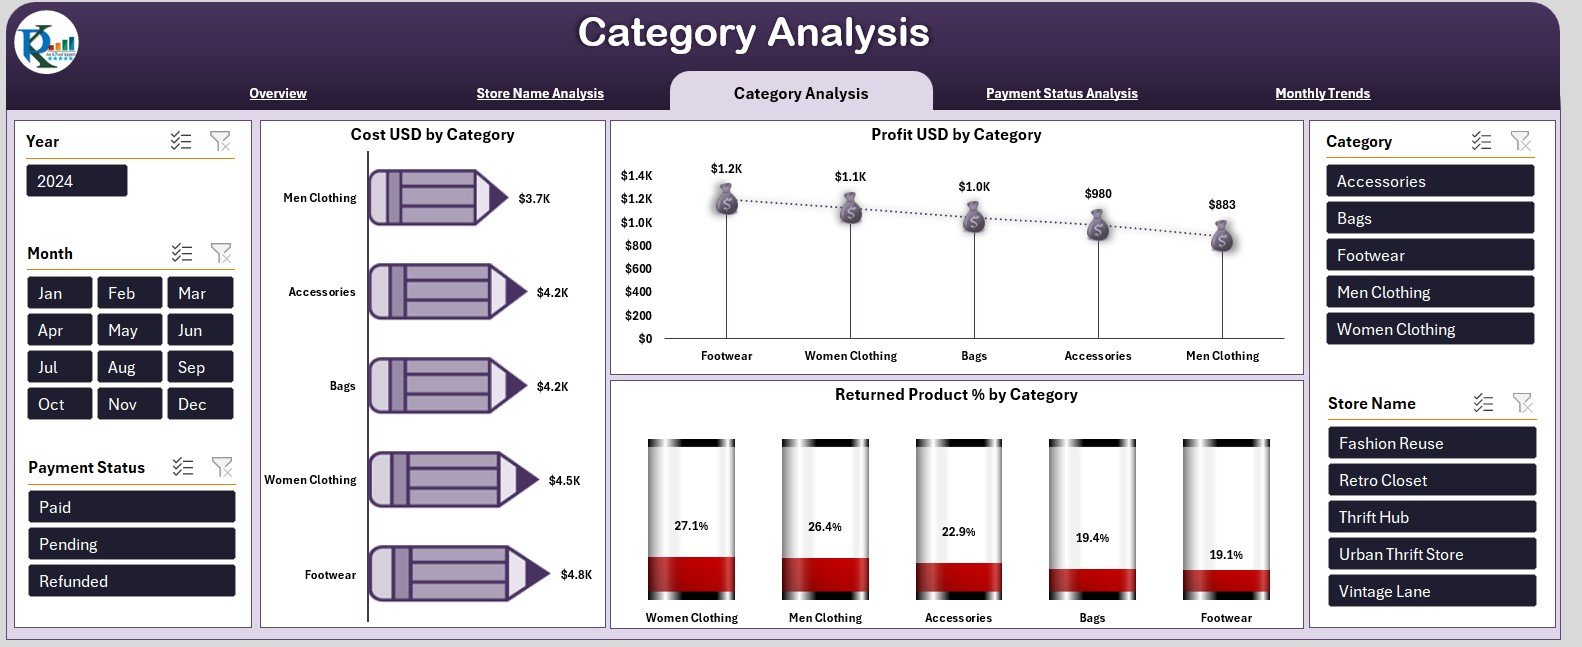
3️⃣ Category Analysis Page
Understand which categories (Clothing, Accessories, Bags, Shoes, etc.) drive profits and which ones face high return rates.
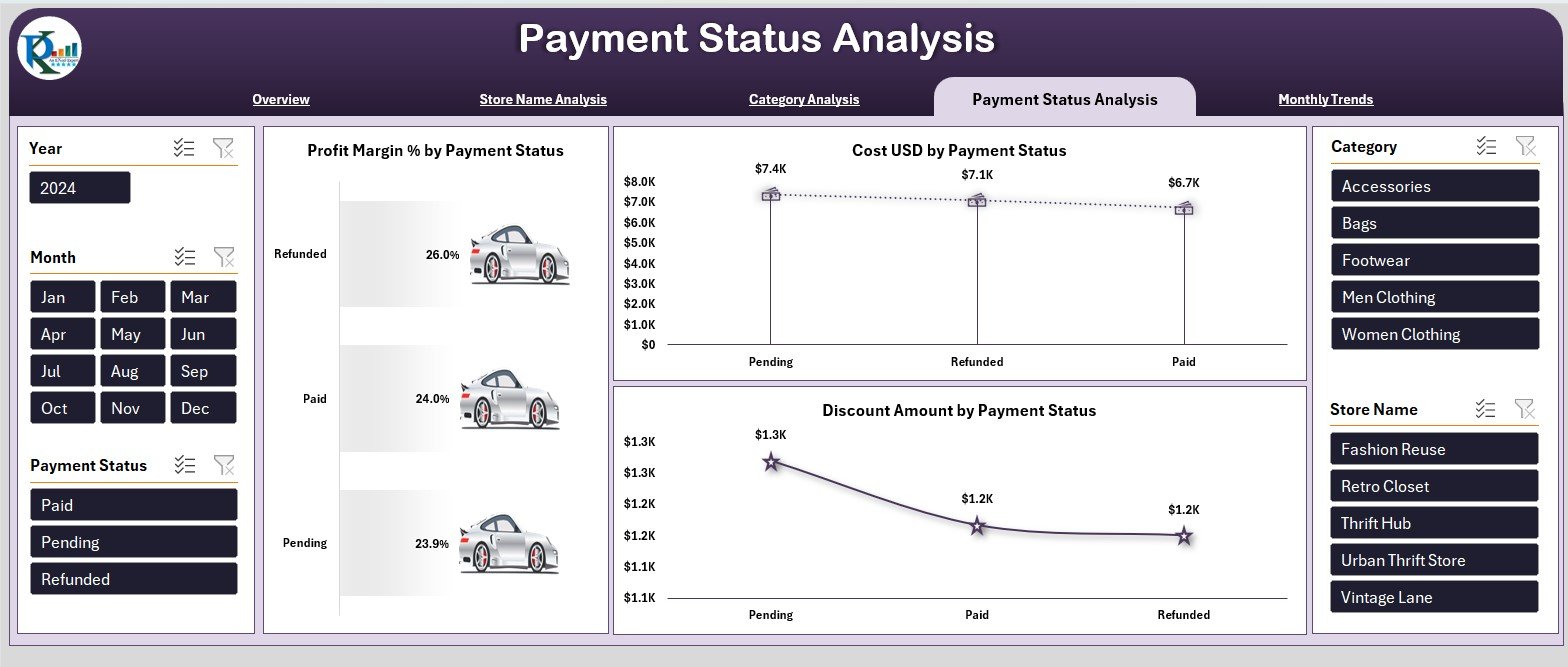
4️⃣ Payment Status Analysis Page
Study how Cash, Online Payments, and Card Payments influence cost, discounts, and profit margins.
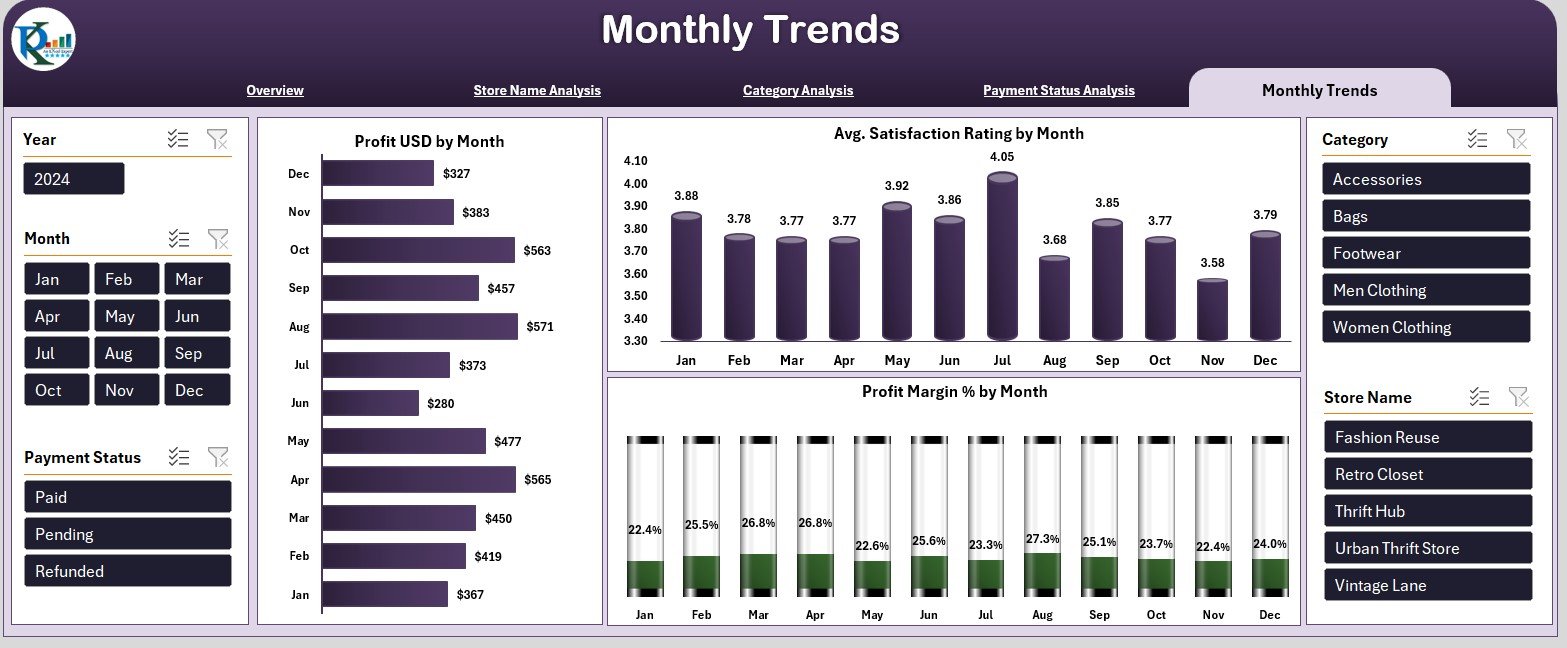
5️⃣ Monthly Trends Page
Discover long-term patterns in profit, margin %, and satisfaction ratings month-by-month.
📄 Support Sheet
Contains dropdown values for consistent data entry.
📊 Data Sheet
Your raw data hub—just update this sheet and all visuals refresh automatically.
🛠️ How to Use the Thrift Fashion Dashboard in Excel
Using this dashboard is extremely simple—even if you are not an Excel expert!
Step 1: Update the Data Sheet
Enter or paste your store data (Profit, Cost, Sales, Category, Payment, Satisfaction Rating, Returns, etc.).
Step 2: Select Filters & Explore Insights
Use the right-side slicers to switch between stores, months, payment modes, or categories.
Step 3: Review KPI Cards
Get instant clarity on performance, profit, returns, and customer satisfaction.
Step 4: Check Analytical Pages
Move through different pages using the page navigator for detailed insights.
Step 5: Take Action
Use insights to improve inventory, pricing, discounts, store performance, and customer experience.
🎯 Who Can Benefit from This Thrift Fashion Dashboard?
This dashboard is designed for anyone who manages or analyzes thrift fashion operations:
👚 Thrift Store Owners
Track performance across all categories and stores easily.
📍 Multi-Store Retailers
Monitor store-wise profits, satisfaction ratings, and costs.
📈 Retail Analysts
Analyze product returns, payment behavior, and customer trends.
📦 Inventory Managers
Understand category demand and optimize stock levels.
🧾 Finance Teams
Track profit, margin %, and cost patterns efficiently.
🎨 Sustainable Fashion Startups
Get complete visibility into operations and growth patterns.


Reviews
There are no reviews yet.