Managing logistics without structured analytics is risky. Costs increase silently. Delivery performance becomes inconsistent. Customer expectations rise. And scattered spreadsheets slow down decisions.
What if you could monitor subscriptions, revenue, regional growth, device performance, and monthly trends — all inside one interactive Power BI dashboard?
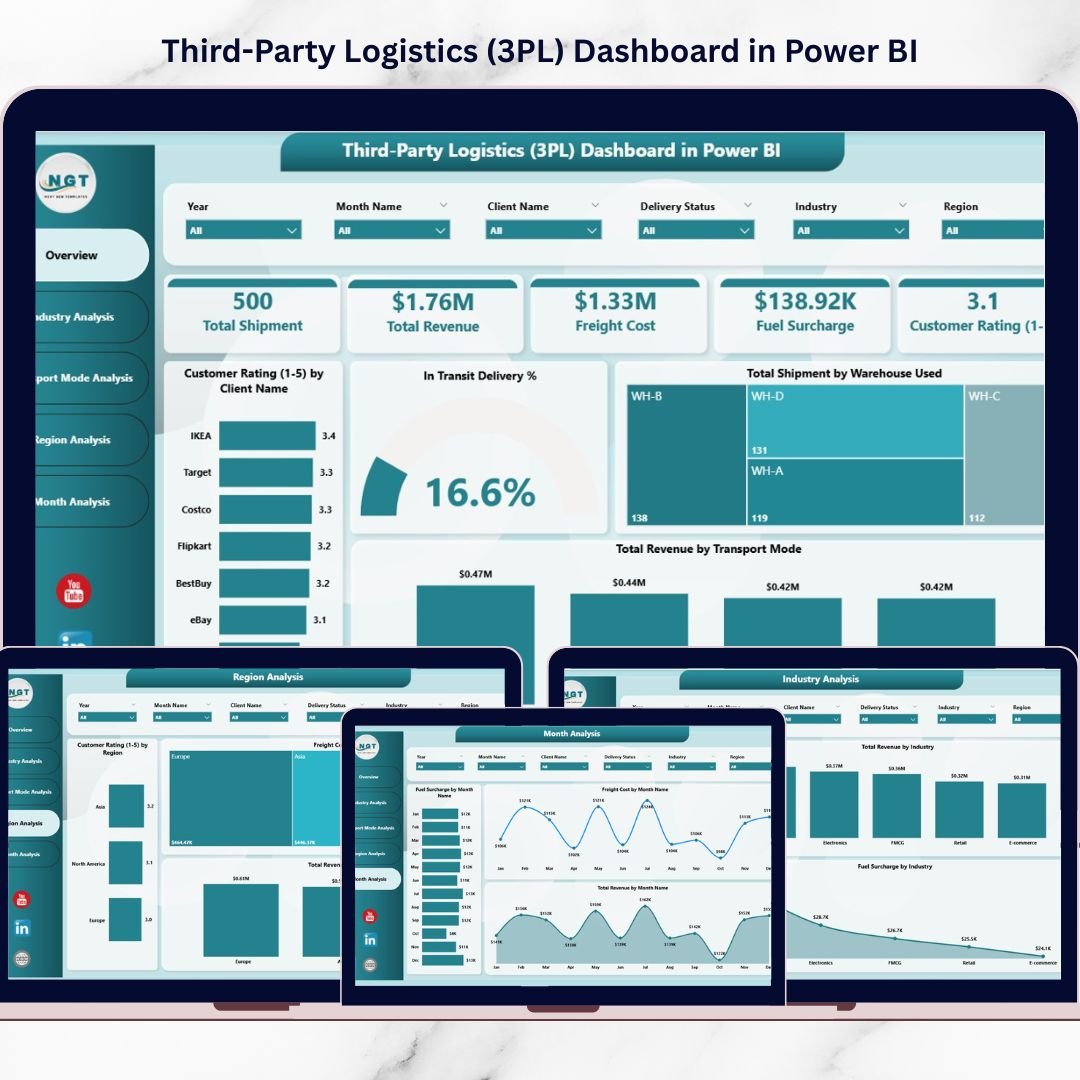
The Third-Party Logistics (3PL) Dashboard in Power BI is your complete logistics intelligence system. It transforms raw operational data into dynamic, visual, and real-time insights. Instead of manually compiling reports, you gain instant clarity that improves efficiency, reduces costs, and increases profitability.
If you want centralized control and smarter logistics decisions, this dashboard delivers exactly that.
🚀 Key Feature of Third-Party Logistics (3PL) Dashboard in Power BI
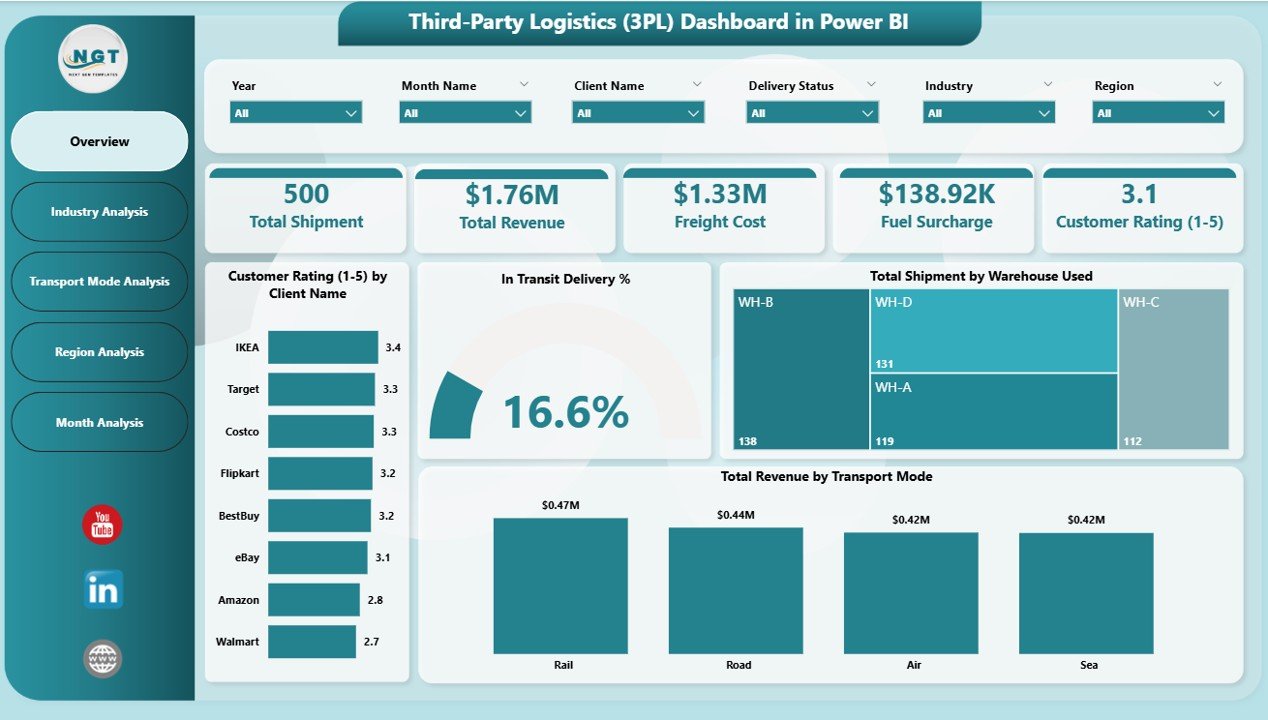
This ready-to-use dashboard includes 5 structured analytical pages, each designed to monitor different performance dimensions.
📊 Interactive Overview Page – Get a complete snapshot with Total Subscriptions, Active Subscription %, Monthly Fee, and Revenue summary.
🎯 Smart KPI Cards – Instantly assess operational health with clear performance indicators.
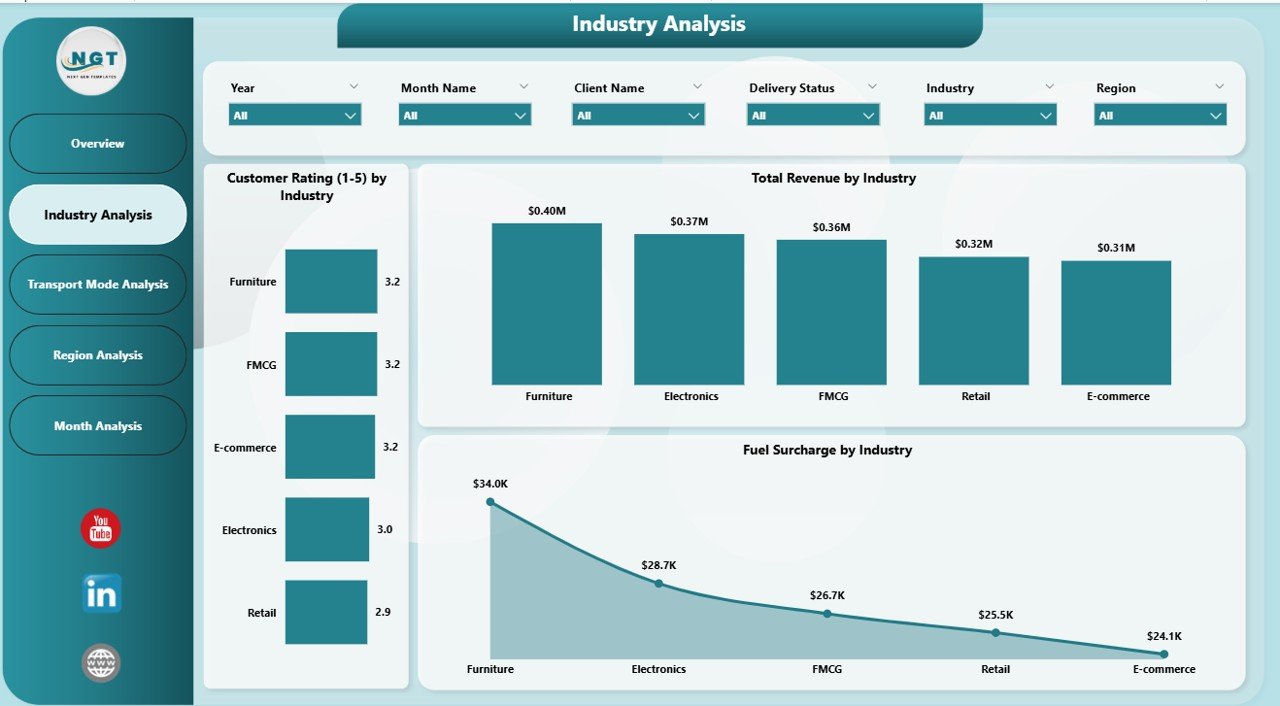
📈 Platform Name Analysis – Compare revenue and subscription performance across platforms.
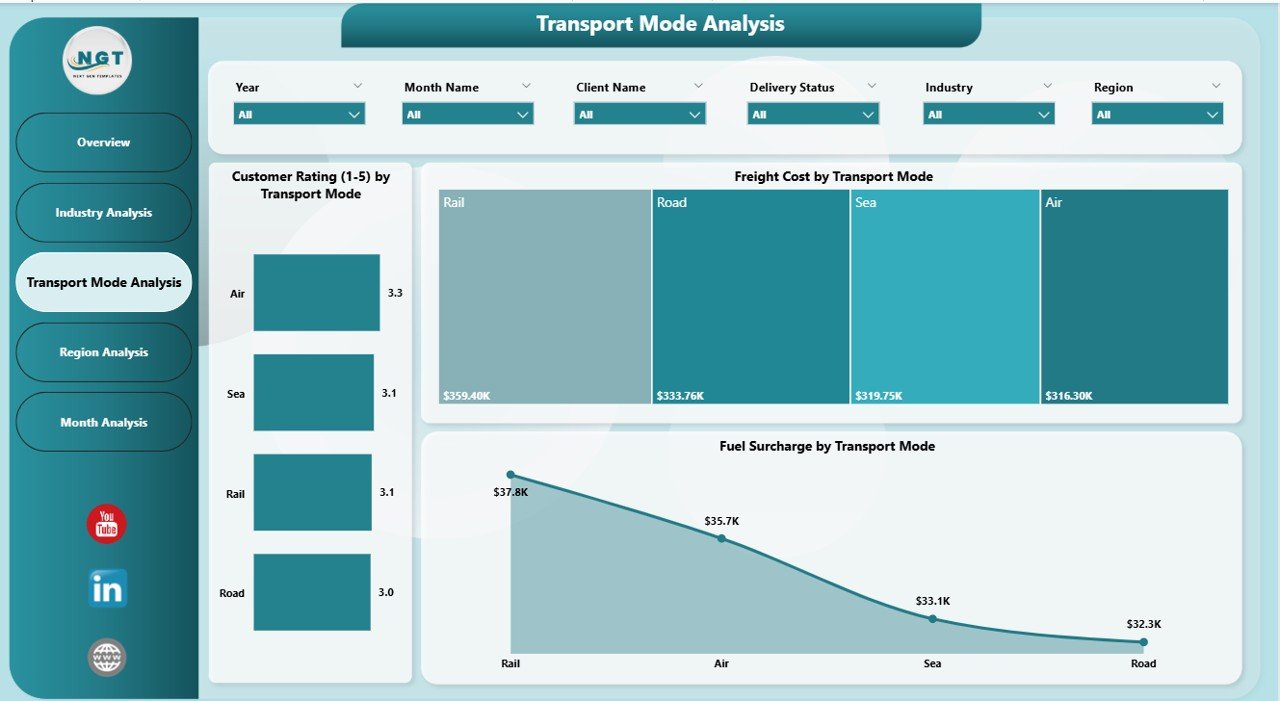
📱 Device Type Analysis – Understand how different devices contribute to revenue and subscriptions.
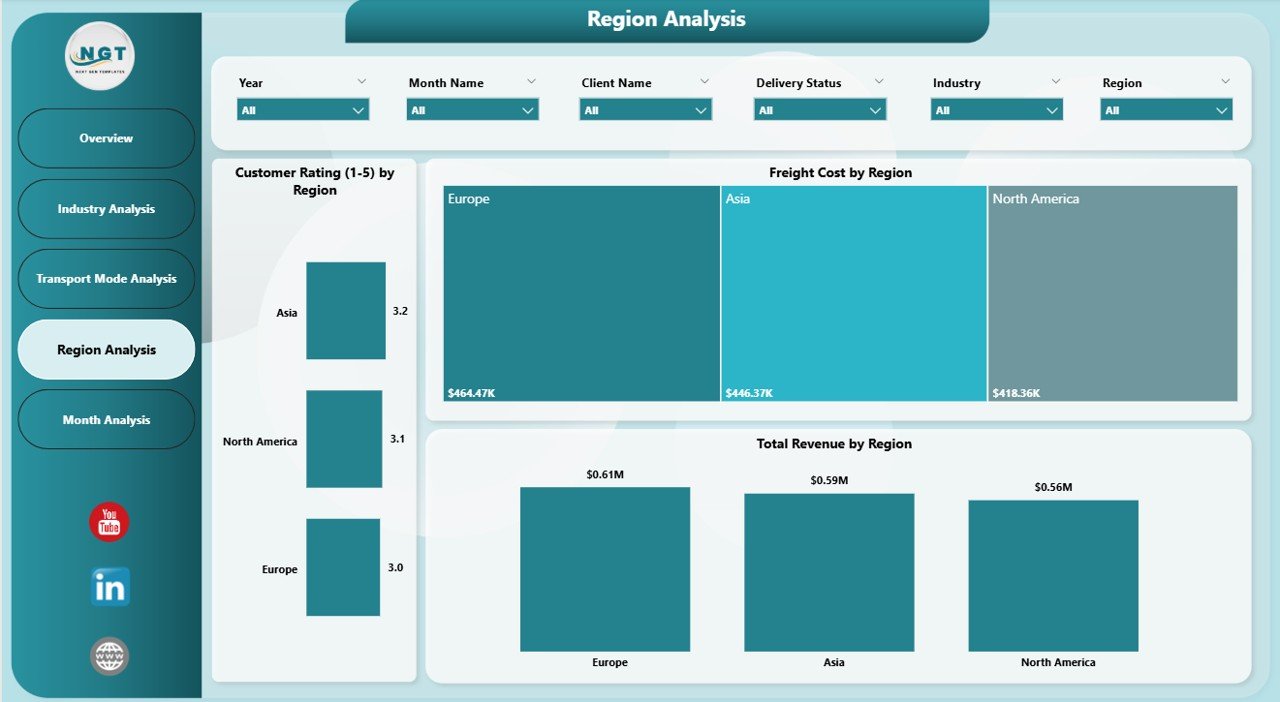
🌍 Region Analysis – Track regional revenue growth and performance variations.
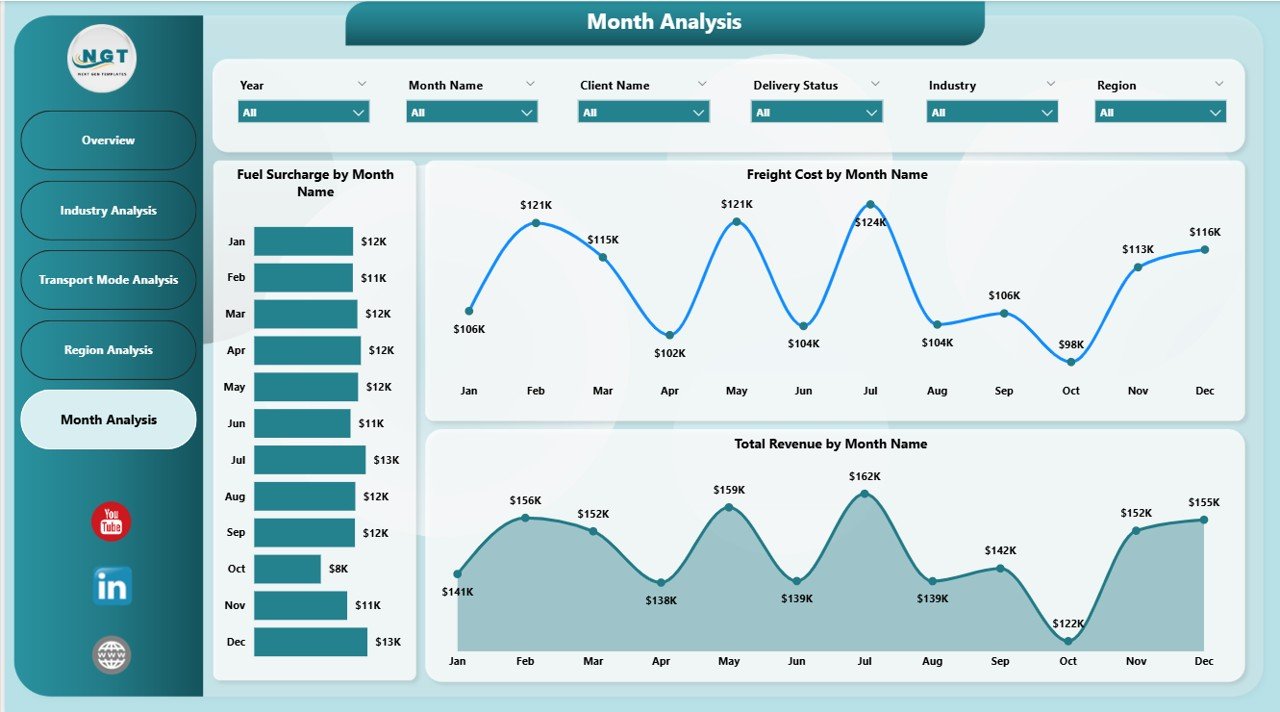
📅 Month Analysis – Monitor time-based trends and identify seasonal performance patterns.
🔄 Dynamic Slicers & Filters – Filter instantly by platform, subscription type, region, and month.
Because Power BI visuals update dynamically, every selection refreshes the entire dashboard in seconds.
📦 What’s Inside the Third-Party Logistics (3PL) Dashboard in Power BI
This solution is built using structured data modeling and intelligent DAX calculations to ensure accurate KPI tracking.
Inside the dashboard, you get:
✅ 5 fully designed Power BI report pages
✅ Pre-built KPI measures
✅ Interactive slicers for instant filtering
✅ Revenue and subscription trend analysis
✅ Platform, device, and regional breakdowns
✅ Scalable structure for adding new KPIs
✅ Professional executive-ready layout
The dashboard supports integration with:
Excel files
ERP systems
Cloud databases
Logistics management systems
Because of its flexible architecture, you can customize it according to your logistics operations.
⚙️ How to Use the Third-Party Logistics (3PL) Dashboard in Power BI
Implementation is simple and structured.
1️⃣ Import your logistics dataset into Power BI.
2️⃣ Create relationships between data tables.
3️⃣ Refresh the dashboard to update visuals.
4️⃣ Use slicers to filter by platform, region, or month.
5️⃣ Analyze trends and KPIs for smarter decisions.
You do not need advanced technical skills. Basic Power BI knowledge is enough to operate and analyze the dashboard effectively.
👥 Who Can Benefit from This Third-Party Logistics (3PL) Dashboard in Power BI
This dashboard is ideal for:
🚛 Third-Party Logistics Providers
📦 Supply Chain Managers
🏭 Operations Managers
📊 Finance & Revenue Teams
📈 Business Analysts
🚚 Subscription-Based Logistics Services
If your organization manages logistics performance, this dashboard helps you centralize reporting and improve decision-making.
💡 Why This Dashboard Improves Logistics Performance
✔ Centralized performance monitoring
✔ Real-time analytics and reporting
✔ Faster and more accurate decision-making
✔ Improved revenue tracking by platform and region
✔ Better subscription growth monitoring
✔ Clear monthly trend analysis
✔ Interactive user-friendly interface
✔ Scalable and customizable system
Instead of reacting to operational issues, you proactively manage performance using data-driven insights.
This dashboard turns complex logistics data into clear strategic direction.
### Click here to read the Detailed blog post
Visit our YouTube channel to learn step-by-step video tutorials
Youtube.com/@PKAnExcelExpert