


Managing performance in the textiles and apparel industry is challenging. Production moves fast, material costs rise, and quality standards become more demanding. To stay competitive, manufacturers need a simple, automated, and highly visual way to monitor every KPI that matters. That’s exactly why we created the Textiles & Apparel Manufacturing KPI Dashboard in Excel — a ready-to-use, professional-grade template that transforms raw data into meaningful insights within seconds.Textiles & Apparel Manufacturing KPI Dashboard in Excel
This dashboard helps textile mills, garment factories, exporters, and production teams track efficiency, quality, cost, machine performance, and delivery KPIs — Textiles & Apparel Manufacturing KPI Dashboard in Excel all inside a user-friendly Excel interface. Whether you want to monitor month-to-date (MTD) and year-to-date (YTD) performance, compare results with targets, or review last year’s numbers, this dashboard gives you complete visibility in one click.Textiles & Apparel Manufacturing KPI Dashboard in Excel
✨ Key Features of the Textiles & Apparel Manufacturing KPI Dashboard in Excel
This powerful Excel template comes with several features designed for fast, accurate, and visual reporting:
📊 1. Month & Year Comparison
Review MTD and YTD Actual vs Target vs Previous Year in a single view.
📈 2. Trend Visualization
See performance trends across months to identify improvement opportunities.
🎯 3. Automated Dashboard
Select the month from a simple drop-down, and every chart updates instantly.
📁 4. Fully Structured Worksheets
Includes dedicated sheets for Actuals, Targets, Previous Year, KPI Definitions, and Trends.
📉 5. Conditional Formatting Indicators
Green upward arrows for improvement, red downward arrows for declining performance.
🔧 6. 100% Editable in Excel
Add or modify KPIs, change formulas, and customize according to your needs.
📤 7. One-Click Reporting
Perfect for management reviews, production meetings, and daily stand-up reporting.

📦 What’s Inside the Textiles & Apparel Manufacturing KPI Dashboard in Excel
This template includes 7 professionally structured worksheets, each built for efficiency:
📍 Summary Page
A clean index page with buttons to navigate to all sheets instantly — no scrolling required.
📊 Dashboard Sheet
Your main dashboard showing MTD, YTD, Target vs Actual, and Previous Year KPIs with icons, charts, and automatic updates.
📈 Trend Sheet
Pick any KPI and review its month-wise trends for MTD and YTD along with KPI Group, Unit, Type, and Definitions.
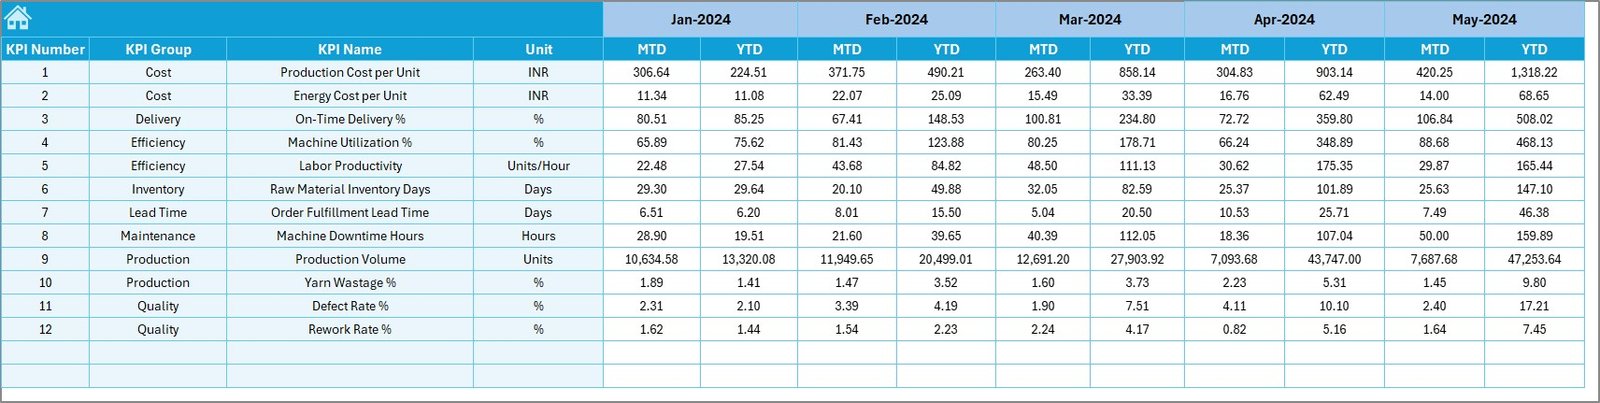
📝 Actual Numbers Input Sheet
Enter monthly performance values (MTD & YTD). Select the start month, and the dashboard adjusts automatically.
🎯 Target Sheet
Define MTD and YTD targets for every KPI to enable performance comparison.
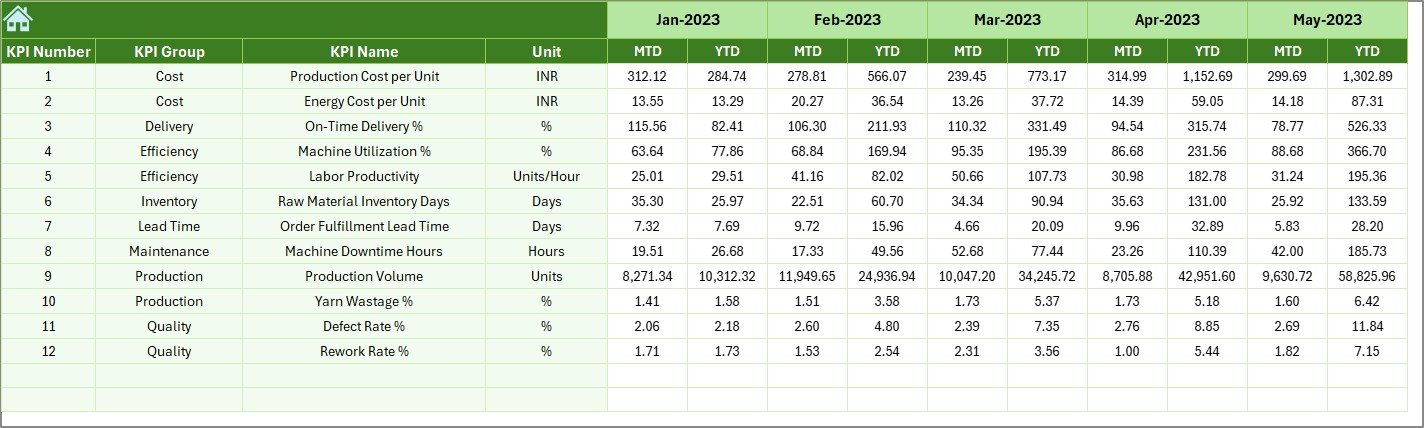
📅 Previous Year Sheet
Add last year’s monthly data to understand long-term progress and patterns.
📘 KPI Definition Sheet
Clear details including KPI name, group, formula, unit, and type (LTB/UTB).
Everything is neatly organized to ensure accurate reporting and faster analysis.
🛠️ How to Use the Textiles & Apparel Manufacturing KPI Dashboard in Excel
Using this dashboard is simple and requires no advanced Excel skills:
-
Enter actual values in the Actual Numbers sheet.
-
Add monthly targets in the Target Sheet.
-
Fill previous year numbers for historical comparison.
-
Go to the Dashboard Sheet and select a month.
-
Instantly analyze performance, trends, and KPIs.
-
Use the Trend Sheet to understand the bigger picture.
-
Share the dashboard during review meetings for powerful decision-making.
In minutes, you’ll have accurate performance reports that normally take hours to prepare manually.
👥 Who Can Benefit from This KPI Dashboard
This Excel dashboard is useful for anyone in the textiles and apparel value chain, including:
🏭 Textile Mills & Yarn Spinning Units
Track production volume, wastage, efficiency, and machine KPIs.
👕 Garment Manufacturing Units
Monitor quality percentages, rework, delivery timelines, and productivity.
📦 Apparel Export Houses
Improve shipment planning, order fulfillment, and compliance reporting.
📉 Quality & Production Managers
Identify gaps, forecast trends, and take action quickly.
📈 Senior Management & Operations Heads
Get real-time insights for performance reviews and strategic planning.
🧵 Fabric Processing & Dyeing Units
Track consumption, cost, process performance, and waste levels.
No matter your role, this dashboard helps you make accurate, data-driven decisions quickly.
### Click here to read the Detailed blog post
Watch the step-by-step video tutorial:


Reviews
There are no reviews yet.