In the competitive world of education 🎓, every data point matters — from student enrollment to faculty efficiency. The Test Preparation Centres KPI Dashboard in Excel gives coaching institutes and education managers the power to turn numbers into insights, effortlessly.
This ready-to-use Excel dashboard is designed to help test preparation centres monitor key performance indicators (KPIs) across academics, marketing, finance, and operations. With automated visuals and formulas, it transforms raw data into a powerful decision-making tool. Whether you manage a single branch or multiple institutes, this dashboard ensures your focus remains on performance, progress, and profitability 🚀.
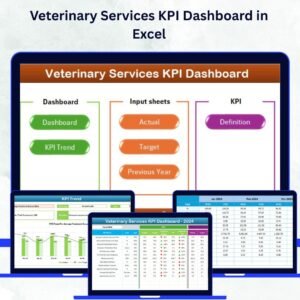
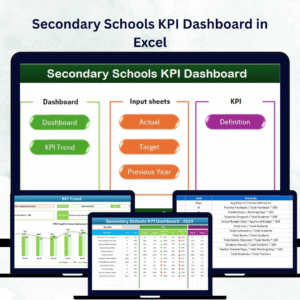
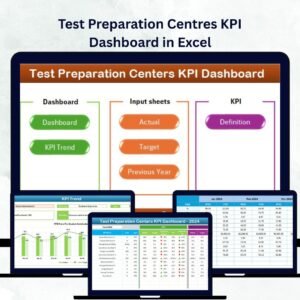
⚙️ Key Features of the Test Preparation Centres KPI Dashboard in Excel
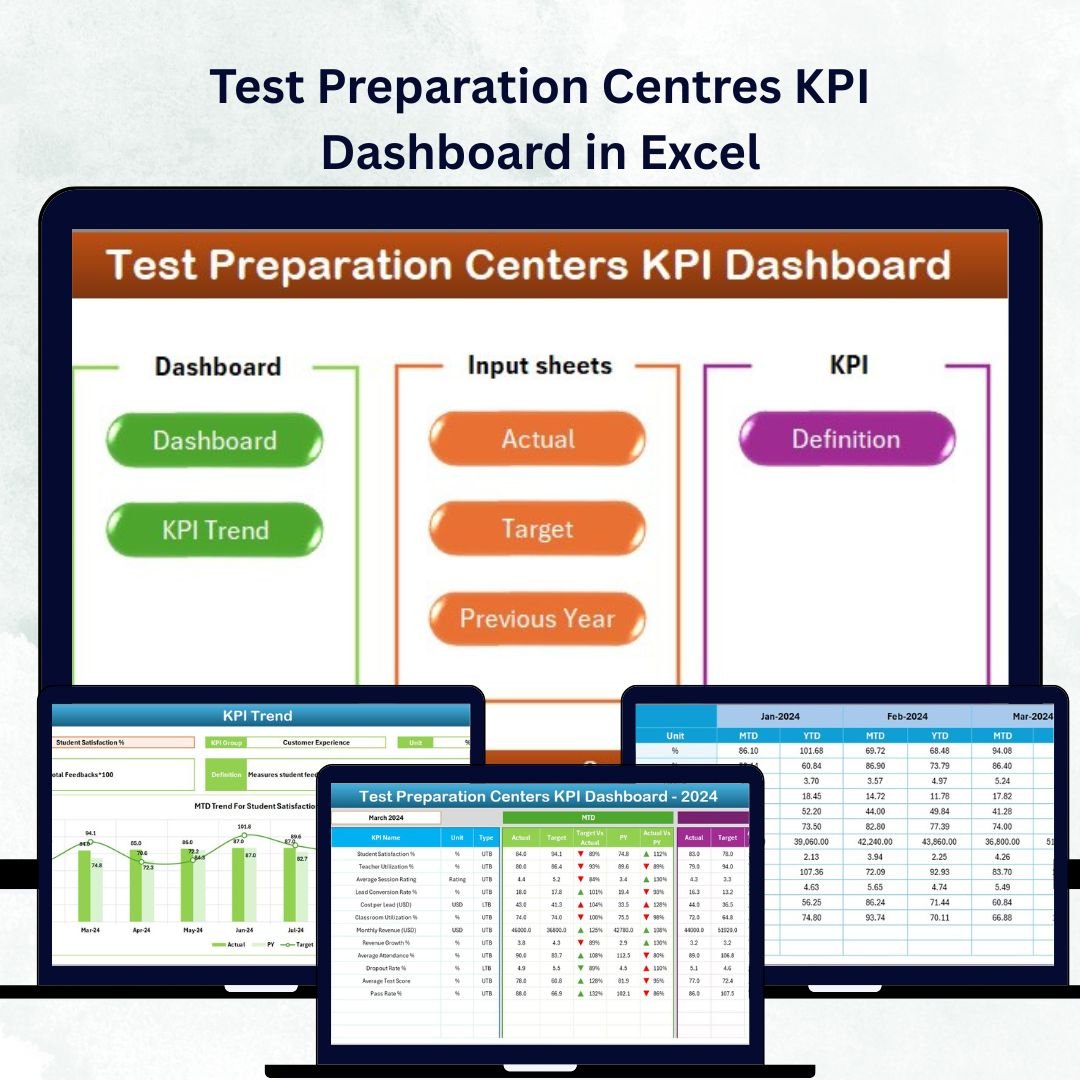
📊 7 Smartly Designed Sheets – Home, Dashboard, KPI Trend, Input, Target, Previous Year, and KPI Definition.
🎯 MTD & YTD Performance Views – Track Month-to-Date and Year-to-Date comparisons instantly.
📈 Actual vs Target vs Previous Year – Three-way analysis for meaningful insights.
🟢 Visual Indicators – Arrows and color codes highlight progress or decline.
💡 Fully Automated – Formulas and charts refresh automatically with every data update.
💾 Centralized Data Entry – Record monthly KPIs in one place, and watch all sheets update instantly.
🧠 Customizable KPIs – Modify academic, operational, and financial metrics as per your needs.
💰 Cost-Effective Analytics – Built entirely in Excel, with no software dependency.
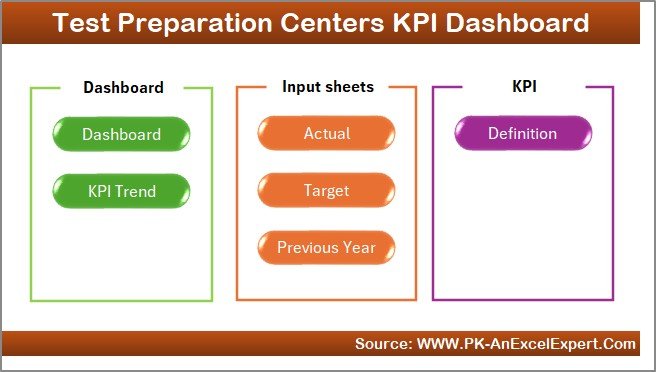
📦 What’s Inside the Dashboard
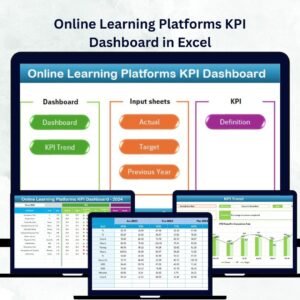
1️⃣ Home Sheet – The Command Centre
Your easy navigation hub 🏠. Use six clickable buttons to jump to Dashboard, KPI Trend, Input, Target, Previous Year, or Definition sheets.
Perfect for beginners — no technical experience required.
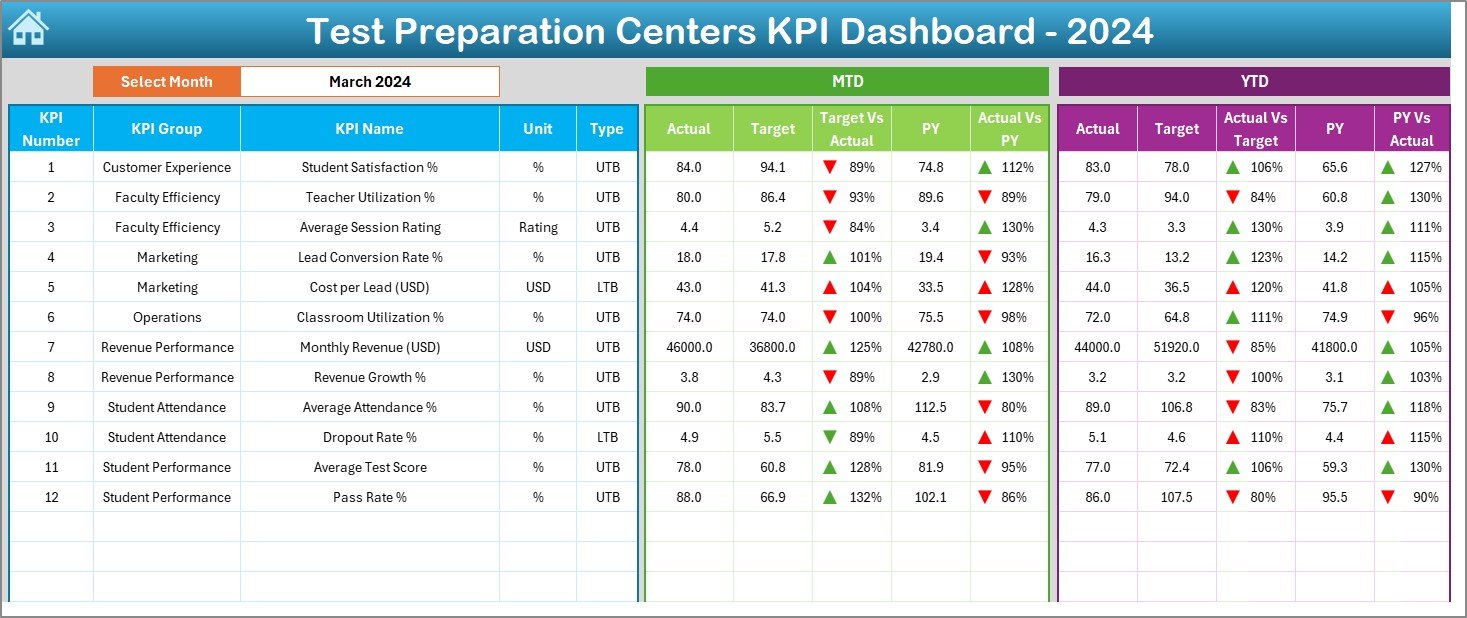
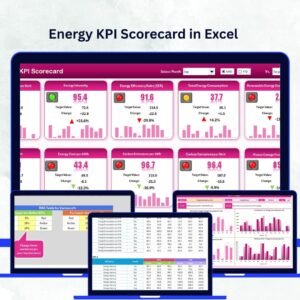
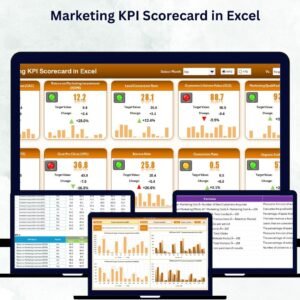
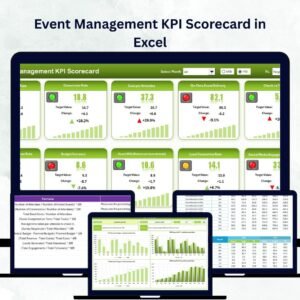
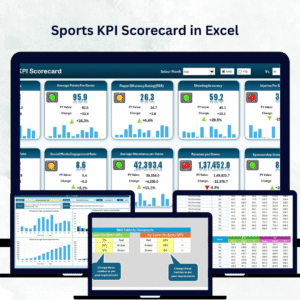
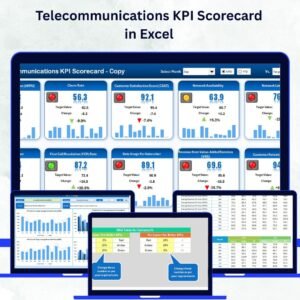
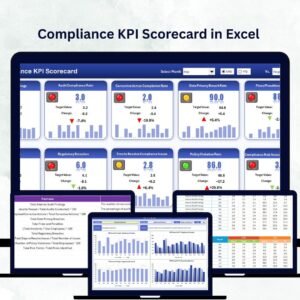
2️⃣ Dashboard Sheet – Performance at a Glance
The main visual display of your centre’s performance.
-
Select any month (cell D3) for instant MTD/YTD analysis.
-
See Actual vs Target vs Previous Year results side by side.
-
Arrows show performance trends.
-
Conditional formatting highlights achievements or issues instantly.
Ideal for management reviews and team performance discussions.
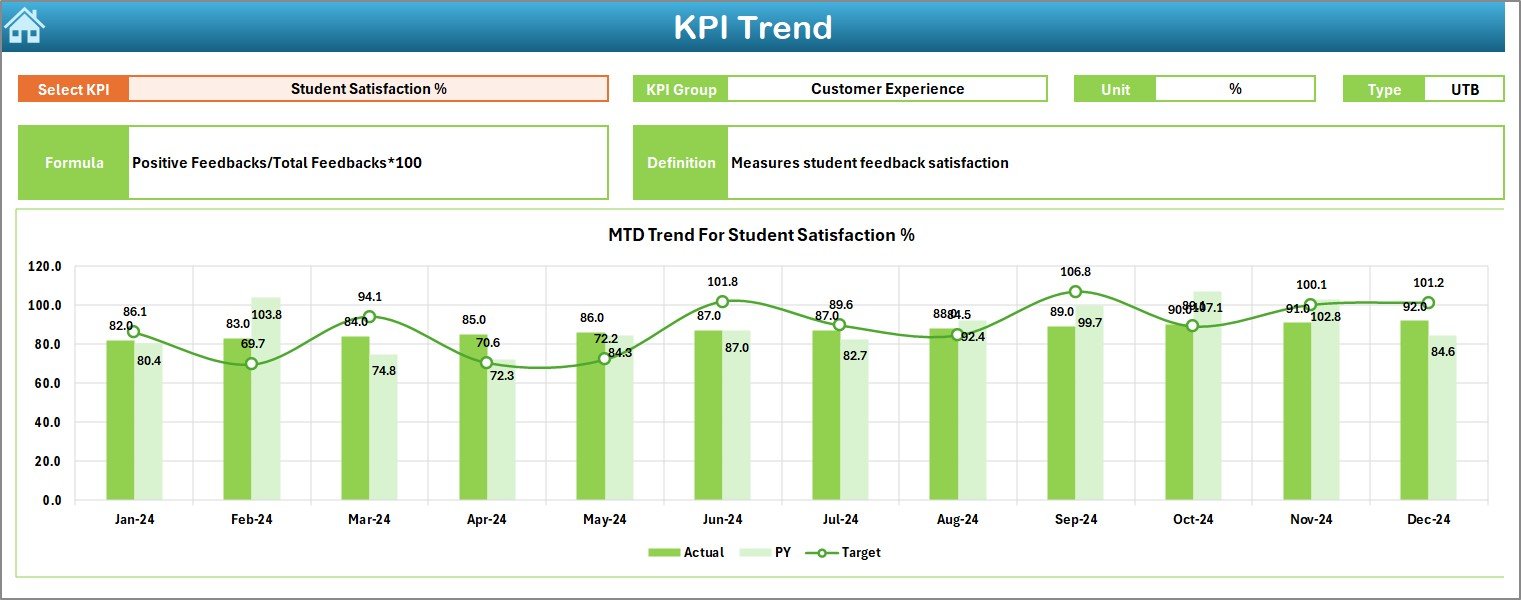
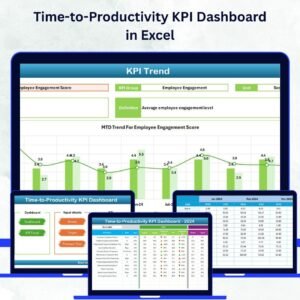
3️⃣ KPI Trend Sheet – In-Depth Metric Analysis
Dive deeper into individual KPIs using the dropdown selector (cell C3).
View KPI Group, Unit, Formula, Type (UTB/LTB), and Definition.
Dynamic charts showcase monthly trends for Actual, Target, and Previous Year — making it easy to identify improvements or declines.
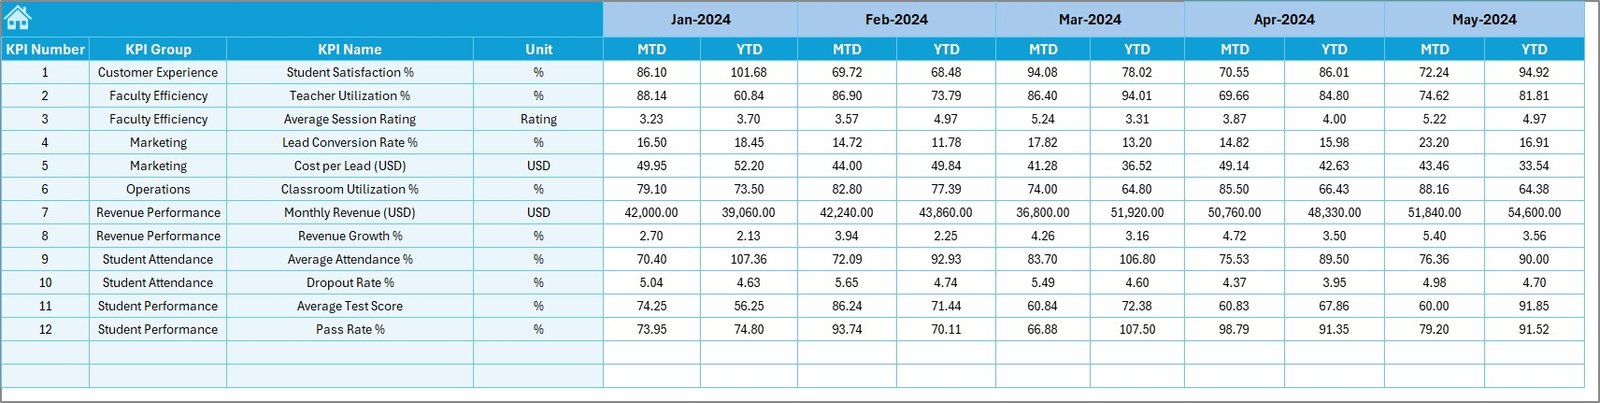
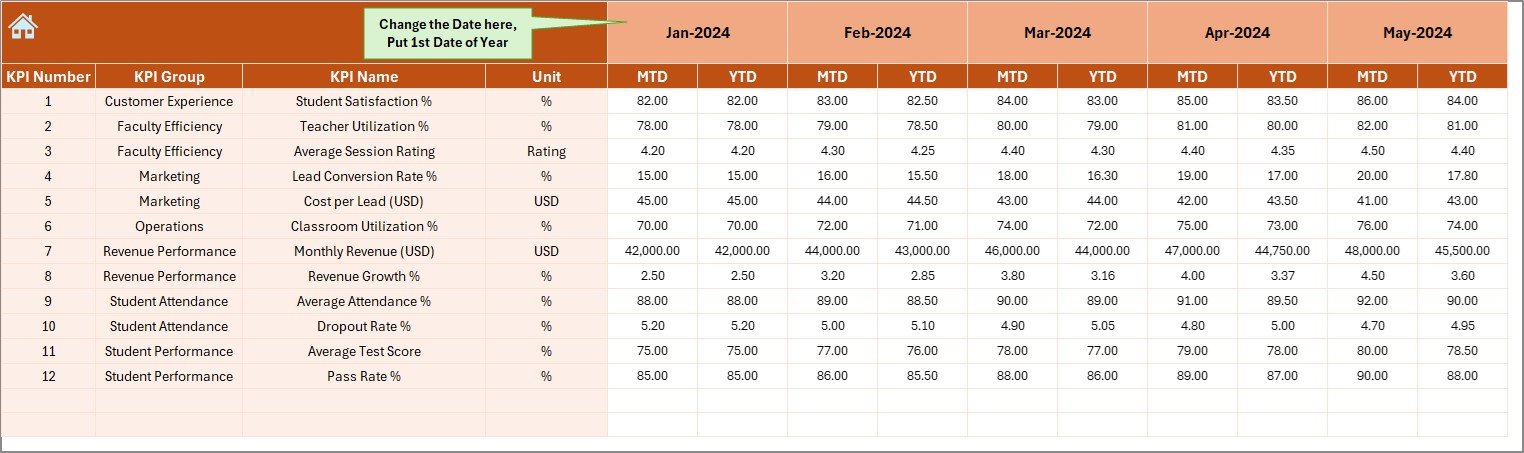
4️⃣ Input Data Sheet – Real Numbers, Real Insights
Record actual performance metrics (MTD/YTD) monthly.
Change the academic start month in cell E1, and everything updates automatically ⚙️.
5️⃣ Target Sheet – Define Success Benchmarks
Set measurable goals for each KPI, such as:
-
🎓 Enrollment Targets
-
🧑🏫 Faculty Effectiveness
-
💬 Student Satisfaction
-
💰 ROI and Profitability
Targets help track success and inspire data-backed decision-making.
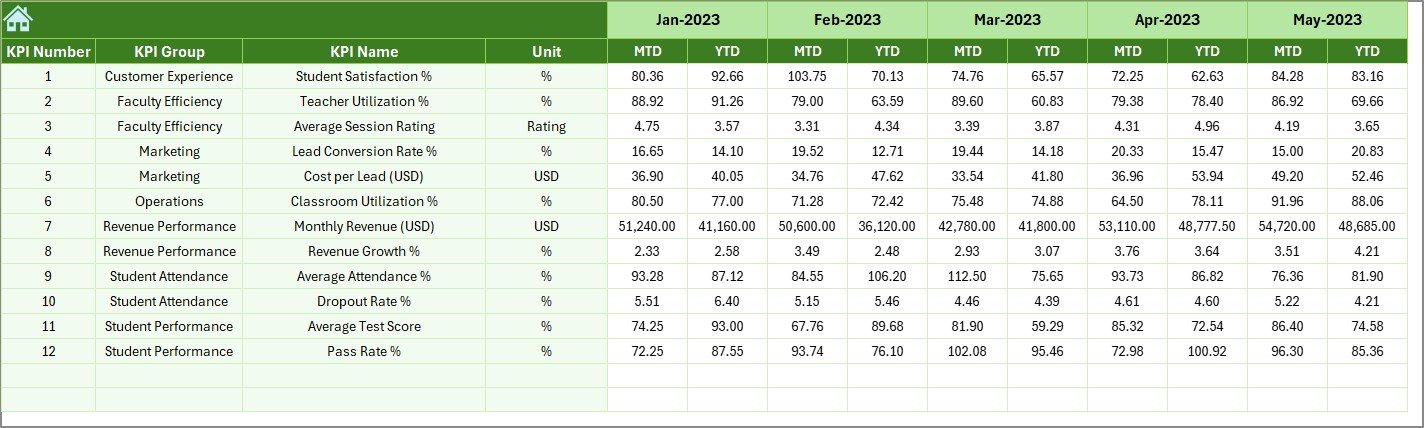
6️⃣ Previous Year Sheet – Benchmark Your Growth
Enter last year’s data to evaluate long-term progress and improvement trends 📆.
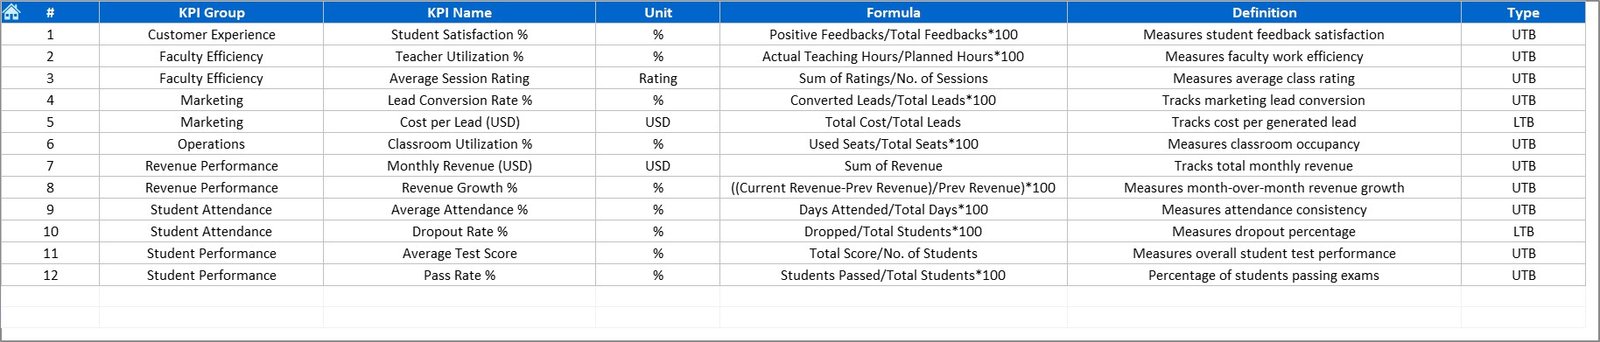
7️⃣ KPI Definition Sheet – Standardized Clarity
Each KPI is explained clearly with its group, unit, formula, and definition.
This ensures consistent understanding and eliminates reporting confusion.
📚 Example KPIs You Can Track
📘 Academic KPIs – Average Student Score (%), Course Completion Rate (%), Pass Percentage (%), Faculty Effectiveness Rating.
⚙️ Operational KPIs – Batch Utilization Rate (%), Attendance (%), Student-Teacher Ratio.
💰 Financial KPIs – Revenue per Student, Cost per Batch, Profit Margin (%), Budget Variance (%).
📢 Marketing KPIs – Conversion Rate, Campaign ROI (%), Social Engagement (%), New Enrollments.
😊 Student Experience KPIs – Satisfaction Score, Feedback Response Rate (%), Referral Enrollment Rate (%).
With this dashboard, you can assess both academic quality and business health — all in one Excel file.
🌟 Advantages of Using the Test Preparation Centres KPI Dashboard in Excel
✅ Centralized Performance Monitoring – Track academic, financial, and operational results together.
✅ Instant Data Visualization – Understand trends at a glance with charts and indicators.
✅ Accountability Across Teams – Align faculty, marketing, and admin goals with measurable metrics.
✅ Automation Built-In – Say goodbye to manual tracking errors.
✅ Scalable Design – Works perfectly for single centres or nationwide networks.
✅ Affordable & Accessible – 100% Excel-based; no costly subscriptions needed.
💡 Best Practices for Effective Use
-
🎯 Align KPIs with strategic goals.
-
📊 Update data monthly for accurate MTD/YTD analysis.
-
📈 Compare current and previous year for growth tracking.
-
🧩 Use visuals for easy communication in team meetings.
-
🤝 Involve all departments — academics, marketing, and operations — for holistic reviews.
These steps ensure your dashboard becomes an essential management tool, not just a reporting template.
Reviews
There are no reviews yet.